Concepts and Layers
Concept
The cryptocurrency market, much like the forex market, operates 24/7 and exhibits significant time zone characteristics. MethodAlgo's Timezone Bandit indicator is developed based on the core parameter of time. The price action within the major global trading sessions, often displays clear, analyzable patterns.
Timezone Bandit helps traders quickly identify and master these patterns by visually plotting the price range and volatility for each session on the chart, thereby enabling them to anticipate the potential direction of the next session. Furthermore, the indicator includes a unique "Stop-hunt" strategy, providing invaluable decision-making support for intraday and scalping traders.
Three Core Time Zones at a Glance
Visually displays the market characteristics of the three main trading sessions—Asia, London, and New York—helping you to quickly grasp the global market rhythm.
Structured Time Annotations
Goes beyond simply dividing sessions by also plotting dynamic volatility ranges, session extension lines, session midlines, and other practical graphical signals, enabling you to formulate more targeted strategies across different volatility environments.
"Stop-hunt" Strategy
After a new session opens, the indicator highlights when the price sweeps (breaks) above the high or below the low of the previous session, revealing potential reversal opportunities.
Cross-Market Versatility
In addition to the cryptocurrency market, this indicator is equally effective in other highly liquid 24-hour markets, such as forex, providing a multi-dimensional analytical perspective.
Proactive Trading Strategy
The core of the Timezone Bandit indicator is time. By analyzing recent up/down patterns across consecutive sessions, you can form a clear directional bias for the next session. This time-based strategy allows you to take proactive trades within specific time windows rather than passively waiting for price signals. There are typically two entry timings:
- Enter at the session open: To catch the potential start of a multi-hour directional move.
- Enter after a Stop-hunt: To capitalize on market mechanics for a stronger directional confirmation.
What Can You Do With It?
- Quickly Identify Market Rhythm: Different trading sessions come with varying levels of volume and volatility. This indicator visually reveals repetitive price patterns over several days, helping you to plan ahead and precisely time your entries and exits.
- Enhance Intraday Decision Efficiency: For intraday traders and scalpers, predicting the next session's move based on historical patterns allows for trading within fixed time windows, significantly reducing unproductive waiting time.
- Assist in Risk Control: Built-in graphical tools like the Stop-hunt highlight, high/low extension lines, and 50% midline help you better assess risk during volatile periods, enabling effective position sizing and minimizing unexpected losses.
Who Is It For?
- Intraday Traders / Scalpers
- Swing traders who follow global market rhythms
- Professional and semi-professional investors looking to optimize their entry/exit timing
Supported Timeframes
- Session Range & Extensions: Supports only 30-minute and lower timeframes. The indicator will not display any information on higher timeframes.
- Stop-hunt: Displays on 15-minute and lower timeframes, but the algorithm is optimized for the 10-minute timeframe. It will not be displayed on timeframes above 15 minutes.
Chart Layout Suggestions
We recommend placing the Timezone Bandit chart in the third position on your screen and using it in conjunction with tools from the PowerRanger suite, such as the "Smart Cloud" and "Historic Levels". For example, if a session open coincides with a breakout or an Apex state, it can significantly increase your trade conviction. It's advisable to fix this chart's timeframe to 15 minutes or lower (ideally 10 minutes).
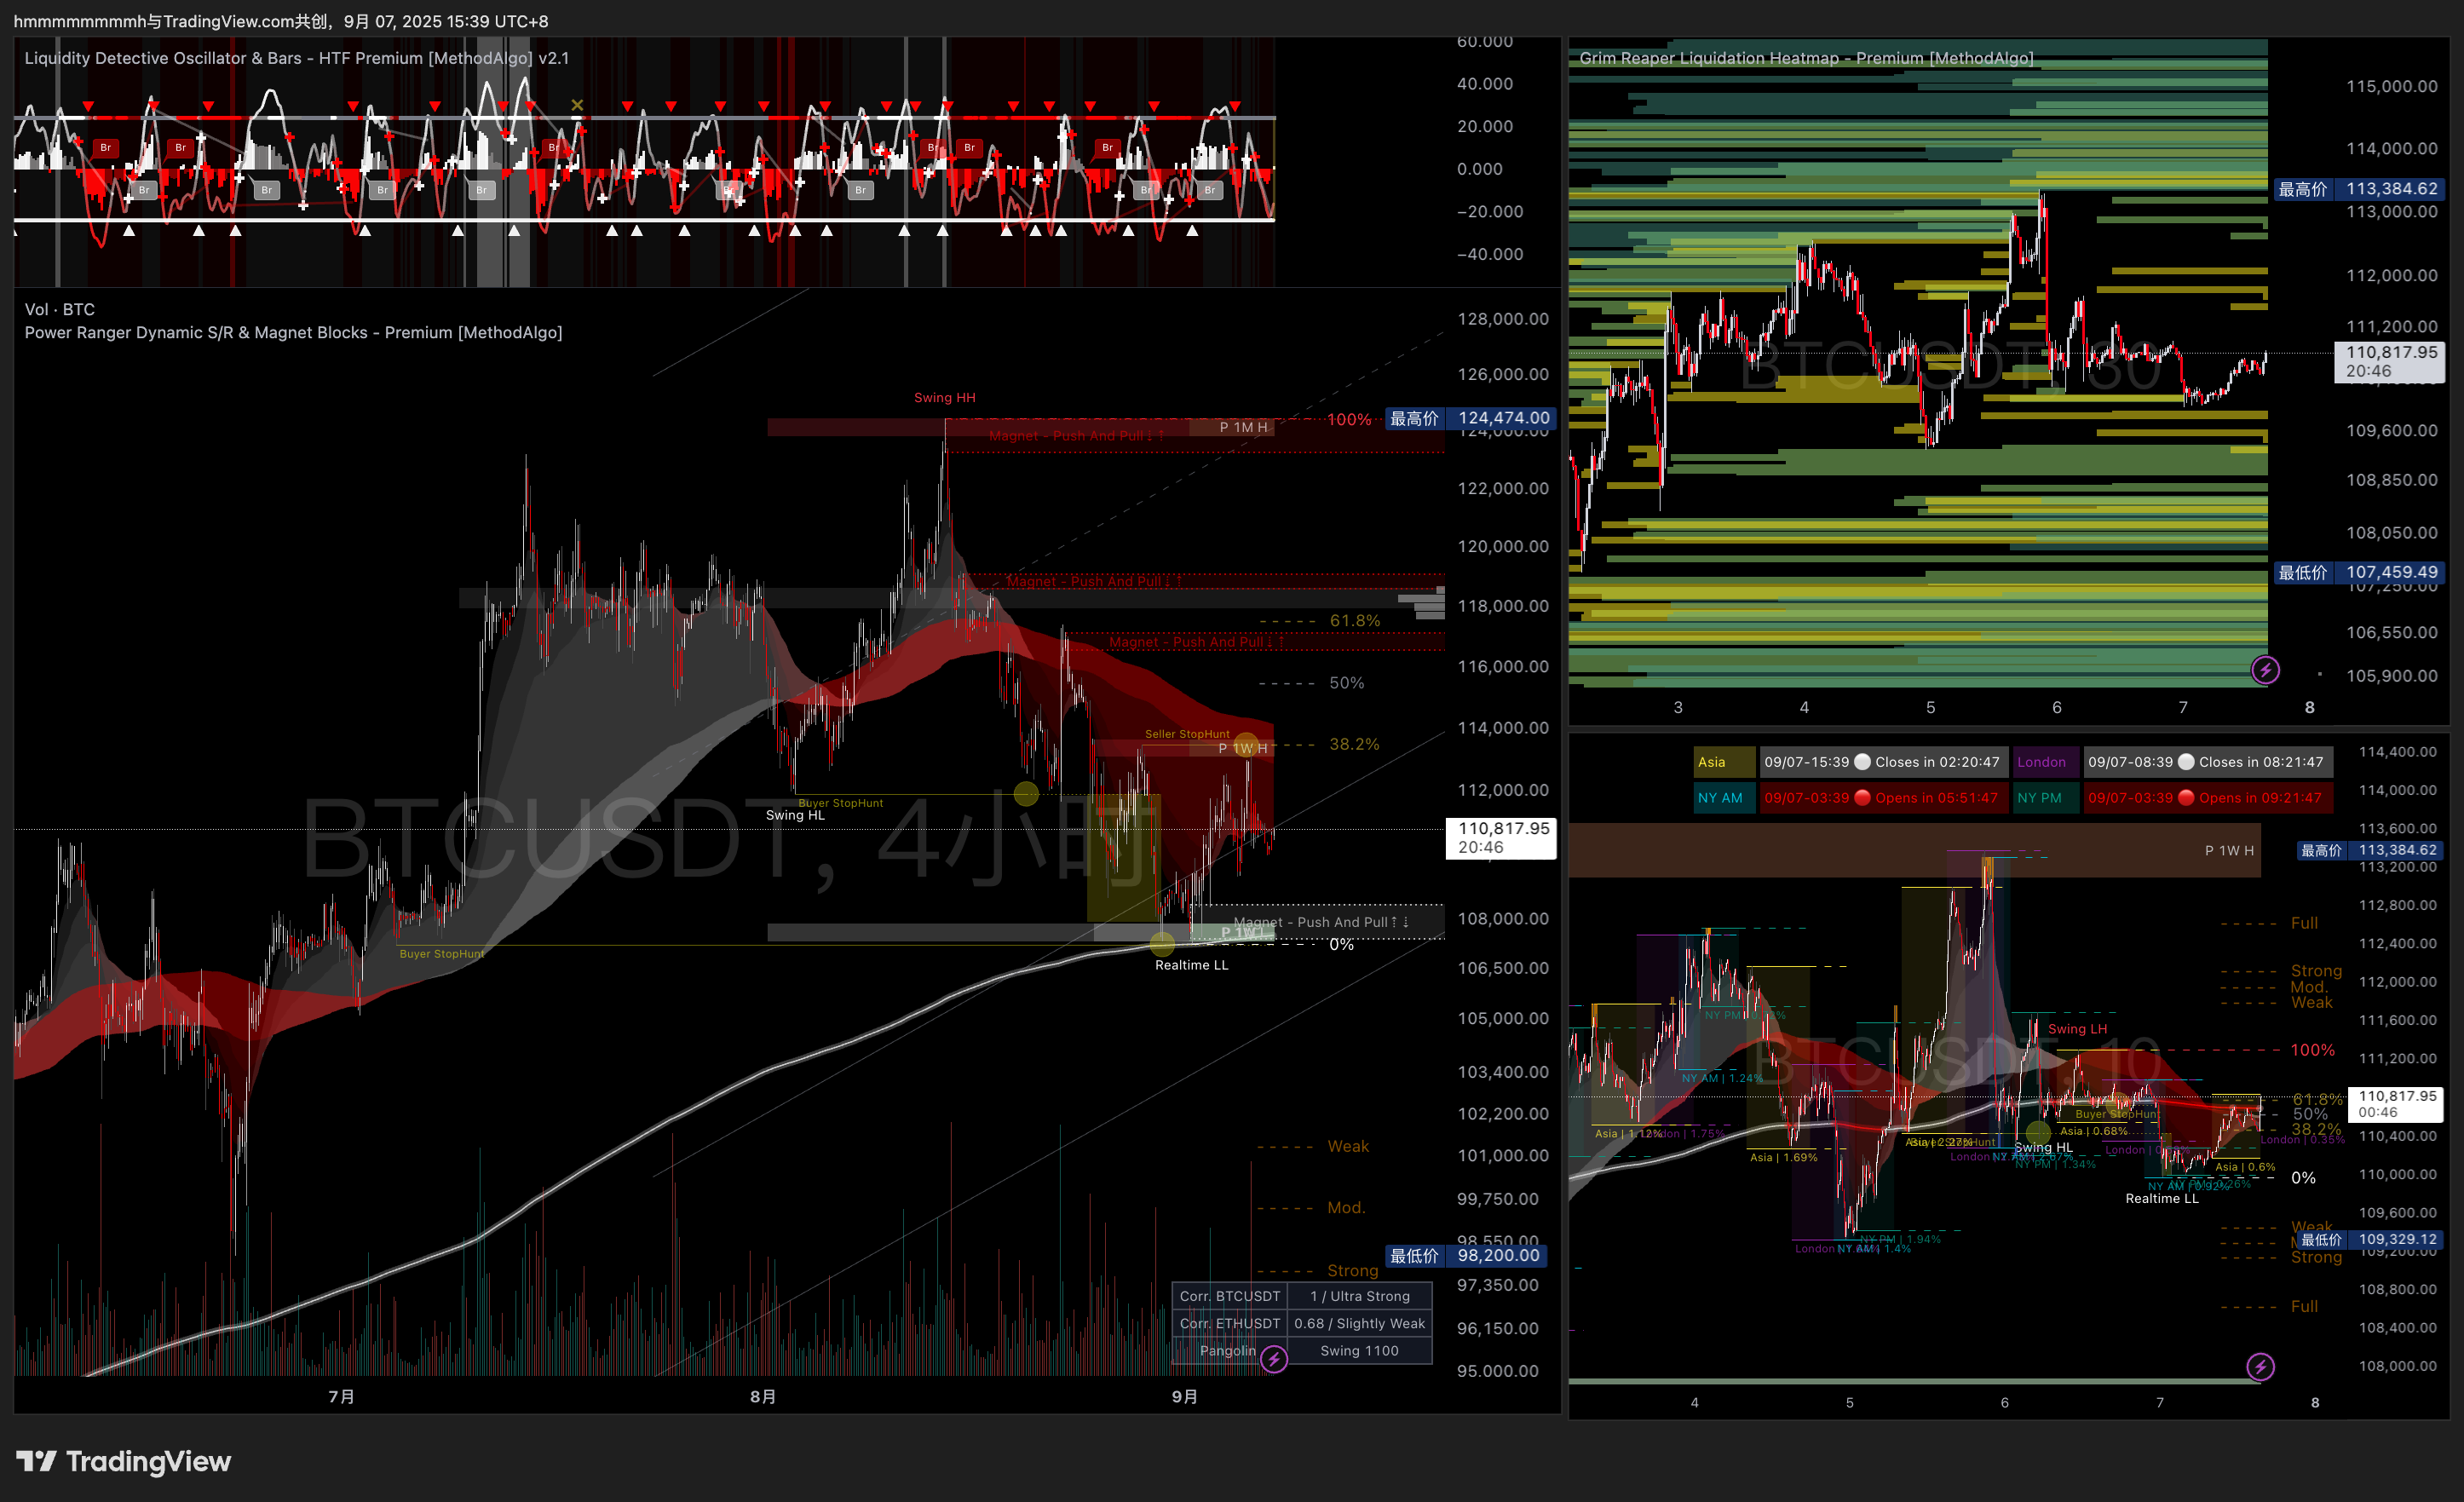
Below is a recommended single-screen layout for a comprehensive short, medium, and long-term analysis of an asset:
- Left Main Chart (Mid- to Long-Term): 1-hour or 4-hour timeframe, with PowerRanger and LiquidityDetective loaded.
- Top Right Chart (Mid-Term & Liquidity Analysis): Fixed to a 30-minute timeframe, with the GrimReaper indicator loaded.
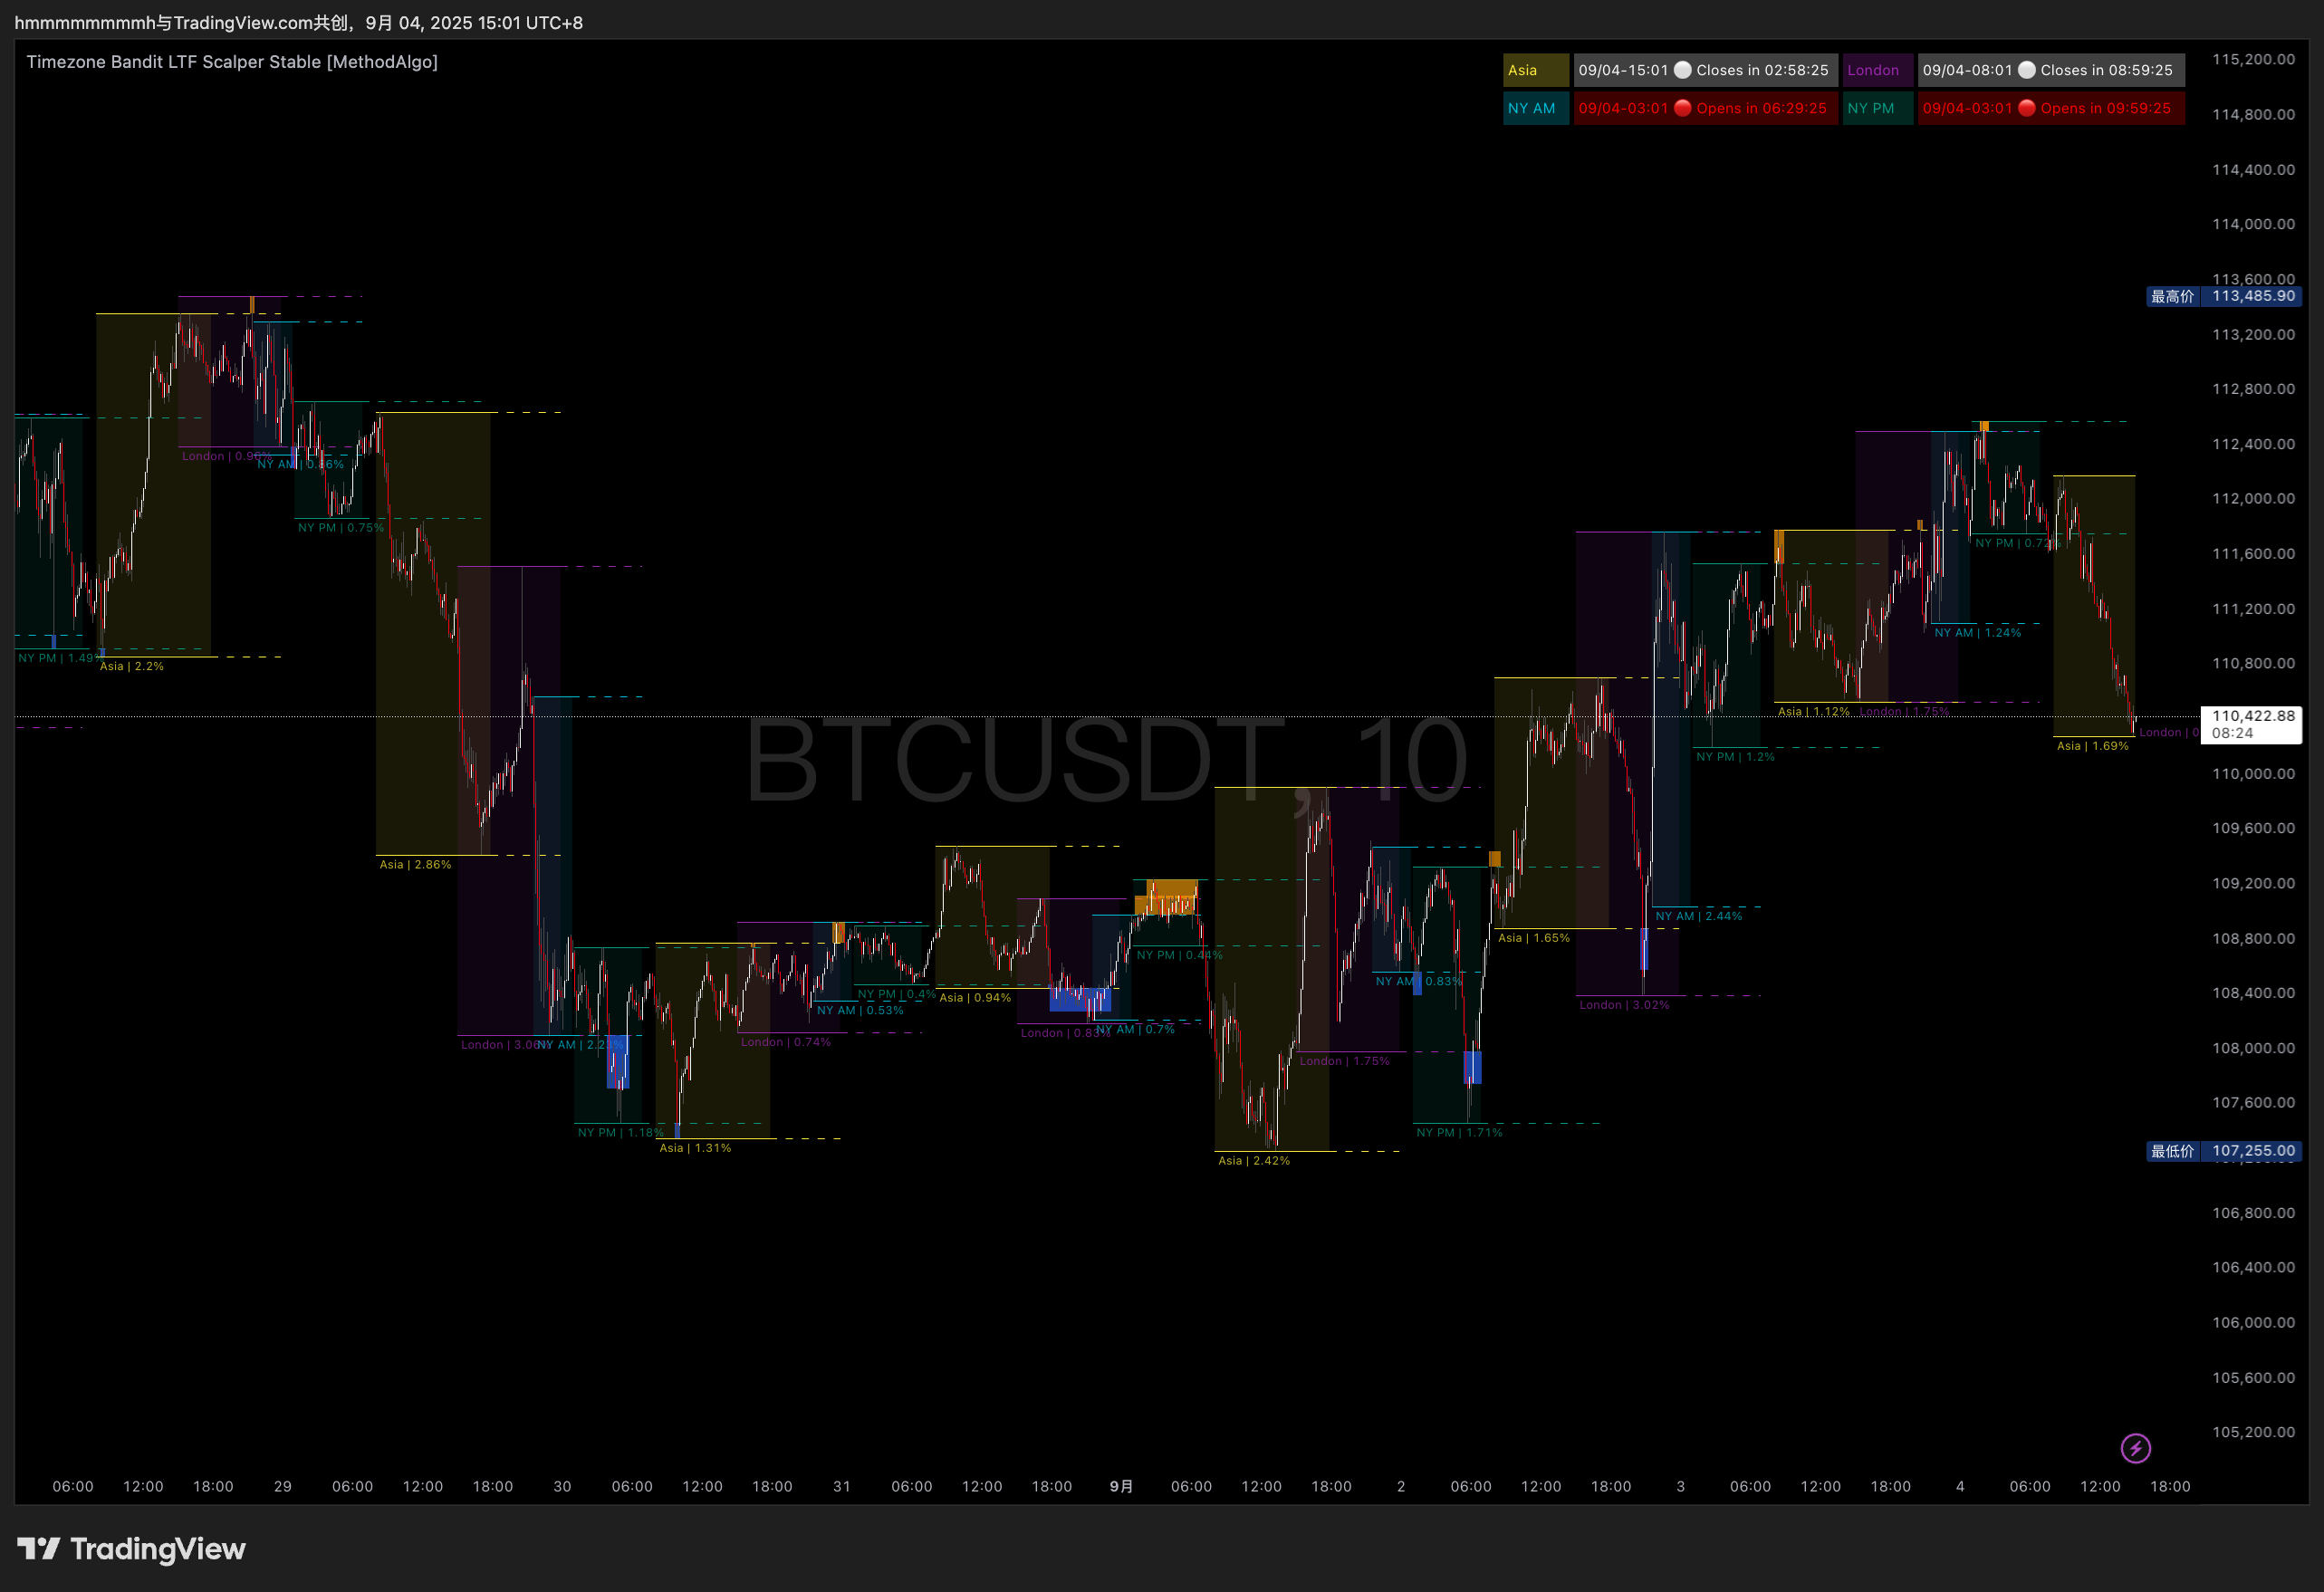
- Bottom Right Chart (Short-Term): Fixed to a 10-minute timeframe, with Timezone Bandit and PowerRanger loaded.
Interface
- Session Range: Marked by solid colored boxes and background shading. The horizontal axis represents the start and end times of the session, while the vertical axis encapsulates the entire price movement within that session.
- Extension Lines: After a session ends, its solid boundary lines turn into dashed lines, representing the Post-Market period. This helps in observing subsequent "Stop-hunt" activity and can serve as time-based support/resistance levels.
- Session Name & Volatility Percentage: Displayed below the session range, showing the name of the current session and the total price volatility within it.
- Stop-hunt Box: Appears after a new session begins but before the previous session's dashed extension lines have ended:
- Orange Highlight: Price moves up and breaks the high of the previous session.
- Blue Highlight: Price moves down and breaks the low of the previous session.
- Highlight Cancellation: If the price continues to move in one direction after the initial break and exceeds a specific range calculated by the built-in ATR algorithm, the highlight box will disappear.
- Signal Confirmation: Like all signals, the highlight box is confirmed and fixed after the current candle closes.
- Opening Bell Countdown: A table in the top-right corner of the chart shows the start and end times for all sessions, along with their respective countdowns.
Signals and Patterns
Timezone Bandit is primarily a visual aid for market structure. Its core value lies in helping you identify patterns rather than generating direct buy/sell signals. The "Stop-hunt" highlight is the only algorithmic signal, but its appearance is a high-probability event. Therefore, the key to using this indicator is to discover and capitalize on the repetitive patterns of recent historical sessions.
Analyzing Historical Price Patterns
Pattern Repetition
The first step in your analysis is to observe the price action of several consecutive sessions leading up to the current time. Set aside all other biases and focus solely on identifying recurring up/down patterns within the sessions.
- What constitutes a pattern?: A similar sequence (e.g., Asia session down, New York session up) needs to occur at least twice in a row.
- Pattern Characteristics: The move typically starts at or shortly after the session opens and concludes around the session changeover.
- Pattern Durability:
- During long periods of consolidation, ranging, or low volume, patterns may repeat more frequently (e.g., 4-5 times).
- In a strong, one-sided trend, patterns usually do not repeat more than 3 times.
Predicting the End of a Pattern
"When you think you've found the key to the market, they change the locks." Every pattern eventually comes to an end. Recognizing signs of exhaustion is as important as identifying the pattern itself.
- Signs of an Ending Pattern:
- After a pattern has repeated 3-4 times, the risk of failure increases significantly. The highest probability of success is typically on the third repetition.
- If the current session (especially the Asian or New York session) moves in the opposite direction of the previous pattern, even though a new pattern has not yet formed, it significantly reduces the likelihood of the previous pattern repeating.
- If the current session's price action (especially Asia or New York) is completely contained within the range of the previous major session, it could be a warning sign that the pattern is about to end.
- The old pattern is only confirmed to be over after two consecutive major sessions deviate from it, marking the potential beginning of a new pattern.
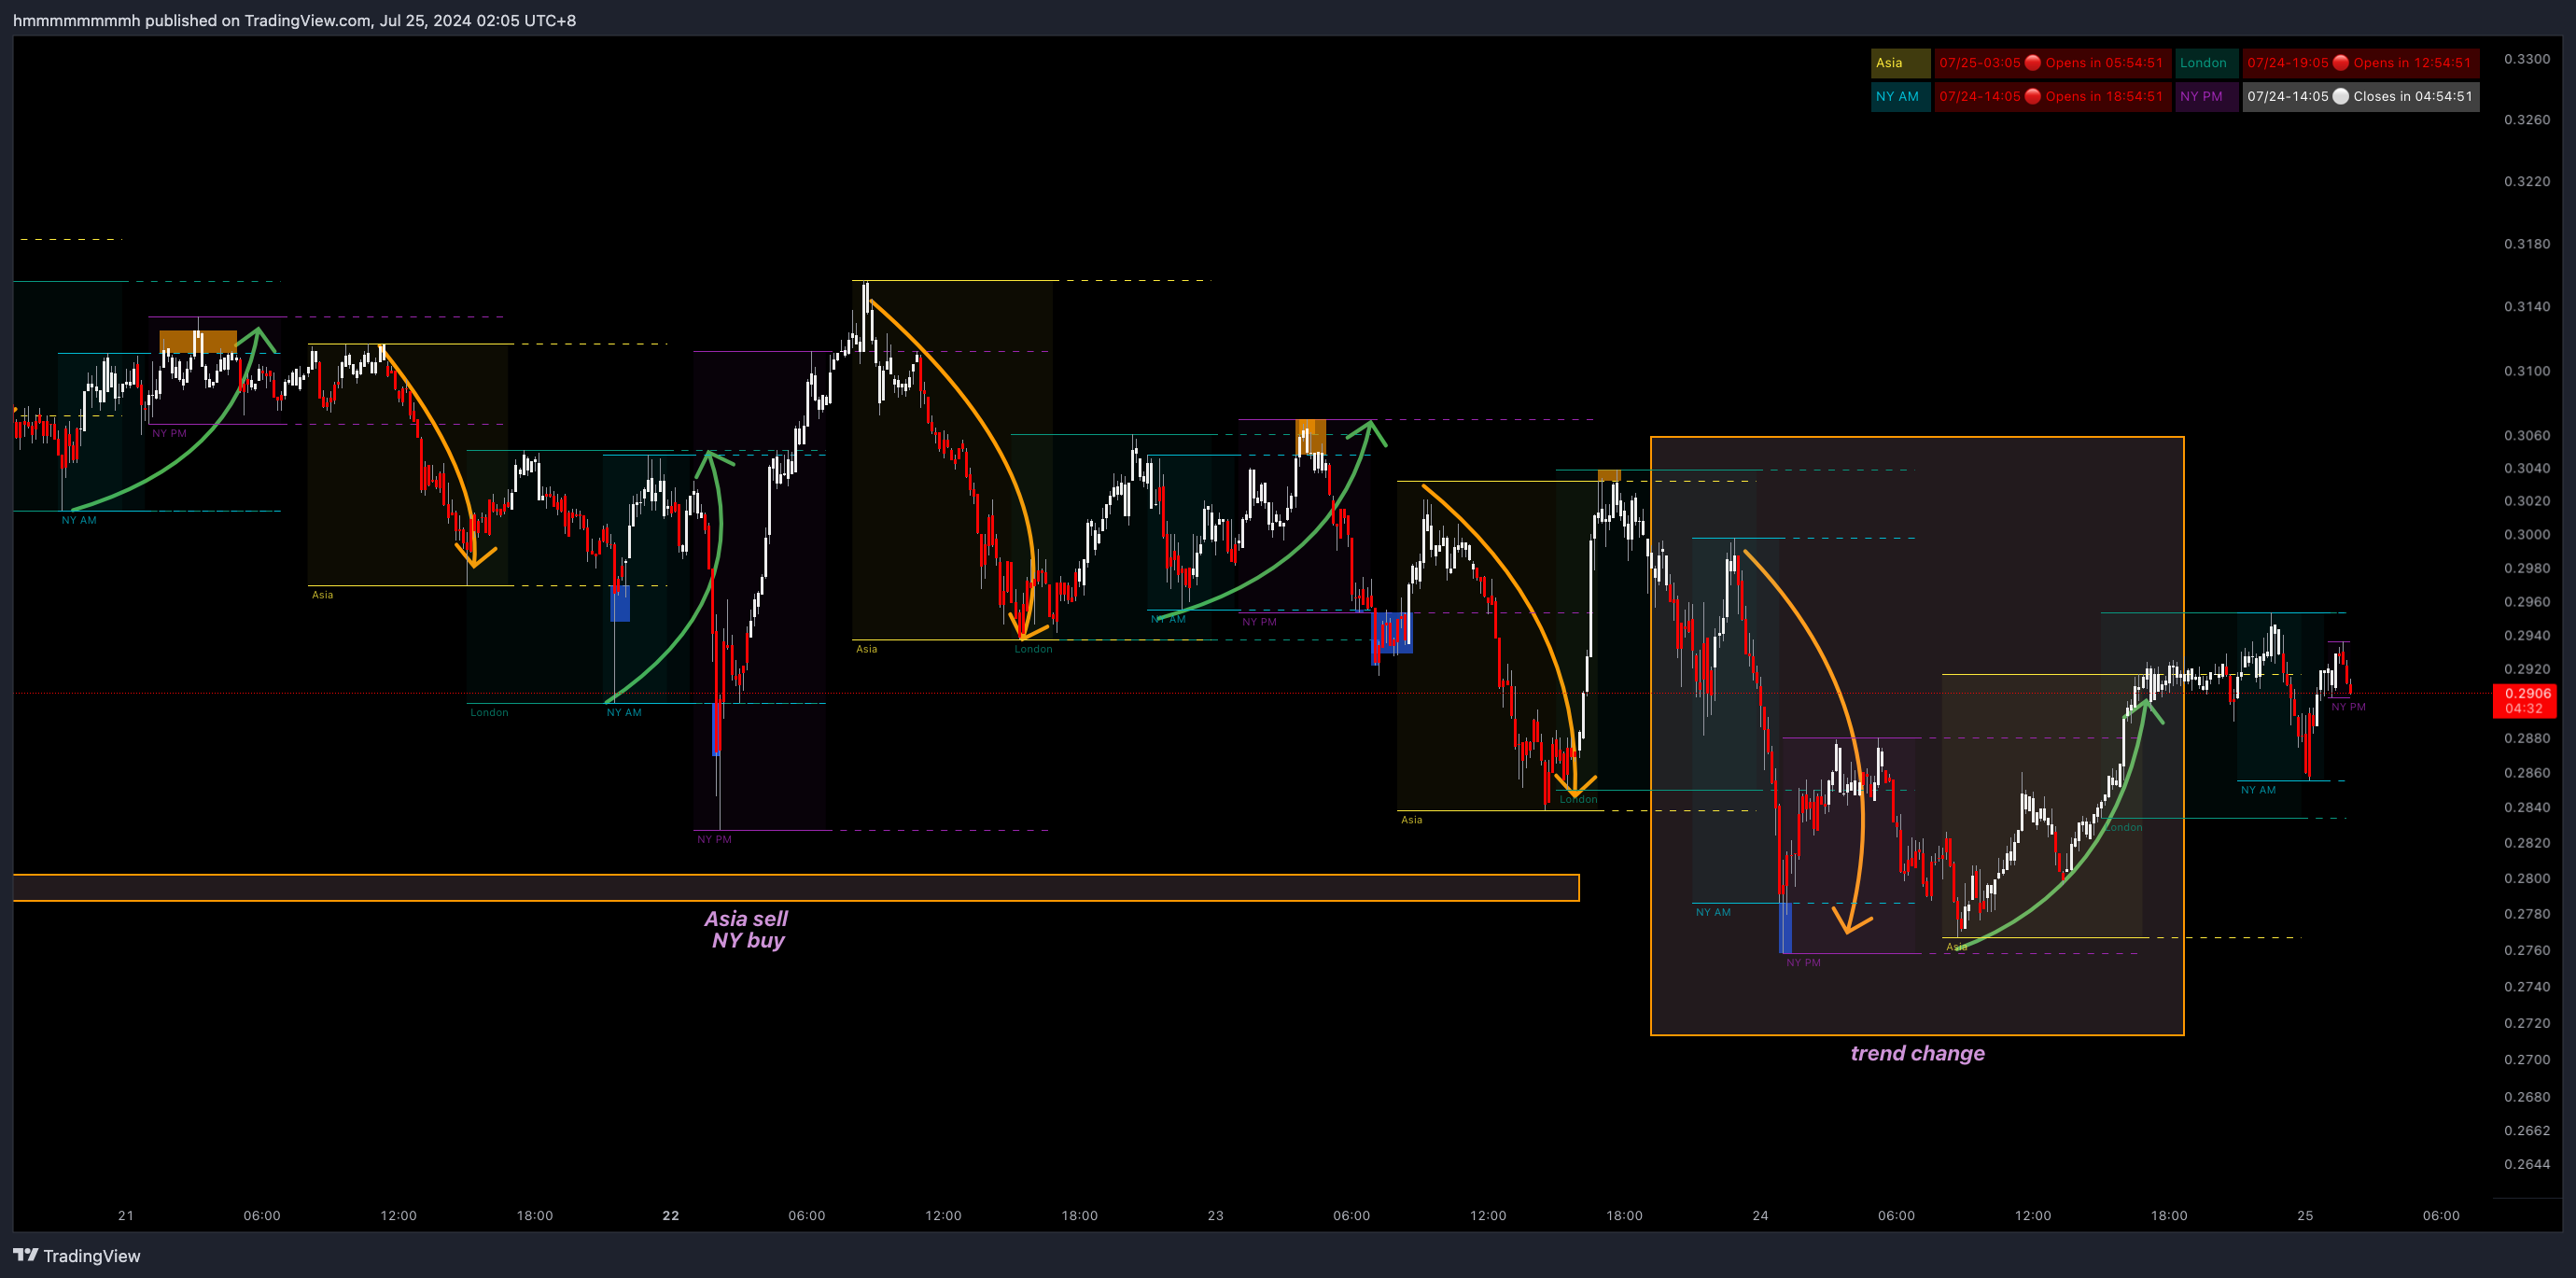 Example 1: The left side highlights the repeating "Asia down, New York up" pattern. The right side shows the end of this pattern, transitioning to "New York down, Asia up."
Understanding Sessions
If you are unfamiliar with the concept of trading sessions, we highly recommend searching online to learn about the opening/closing times of major global exchanges and their impact on market volatility. A solid knowledge base will boost your confidence in the strategy and improve your success rate.
Key Time Nodes
- Asia Session Open (8:00 AM UTC+8): This is not only the start of the Asian market but also 00:00 UTC, the daily reset for many crypto exchanges. New daily, weekly, and even monthly candles are formed, often bringing significant volatility and potential reversal opportunities.
- New York Session Open (8:00 PM - 9:30 PM UTC+8): The US stock market open drives global macro markets. Additionally, the window from 8:00 PM , 8:30 PM, 9:00 PM (UTC+8) Time is when major US economic data is released, making it a critical trading period. The indicator defaults to 9:30 AM NY time (NYSE open), but you can adjust it as needed.
Other Independent Patterns
- If the New York session (AM+PM) experiences a massive rally, the following Asia session is likely to be bearish.
- If the Asia session has a strong rally, the London session may start with a period of consolidation.
- If BTC trades within a narrow range during the London session while an altcoin breaks out, that altcoin’s trend will most likely continue until the start of the New York session.
- Asia Bear,NY Bull pattern is more common than others
- In the three hours before the New York and Asia opens (5:00 PM-8:00 PM / 5:00 AM-8:00 AM UTC+8), market volatility typically decreases.
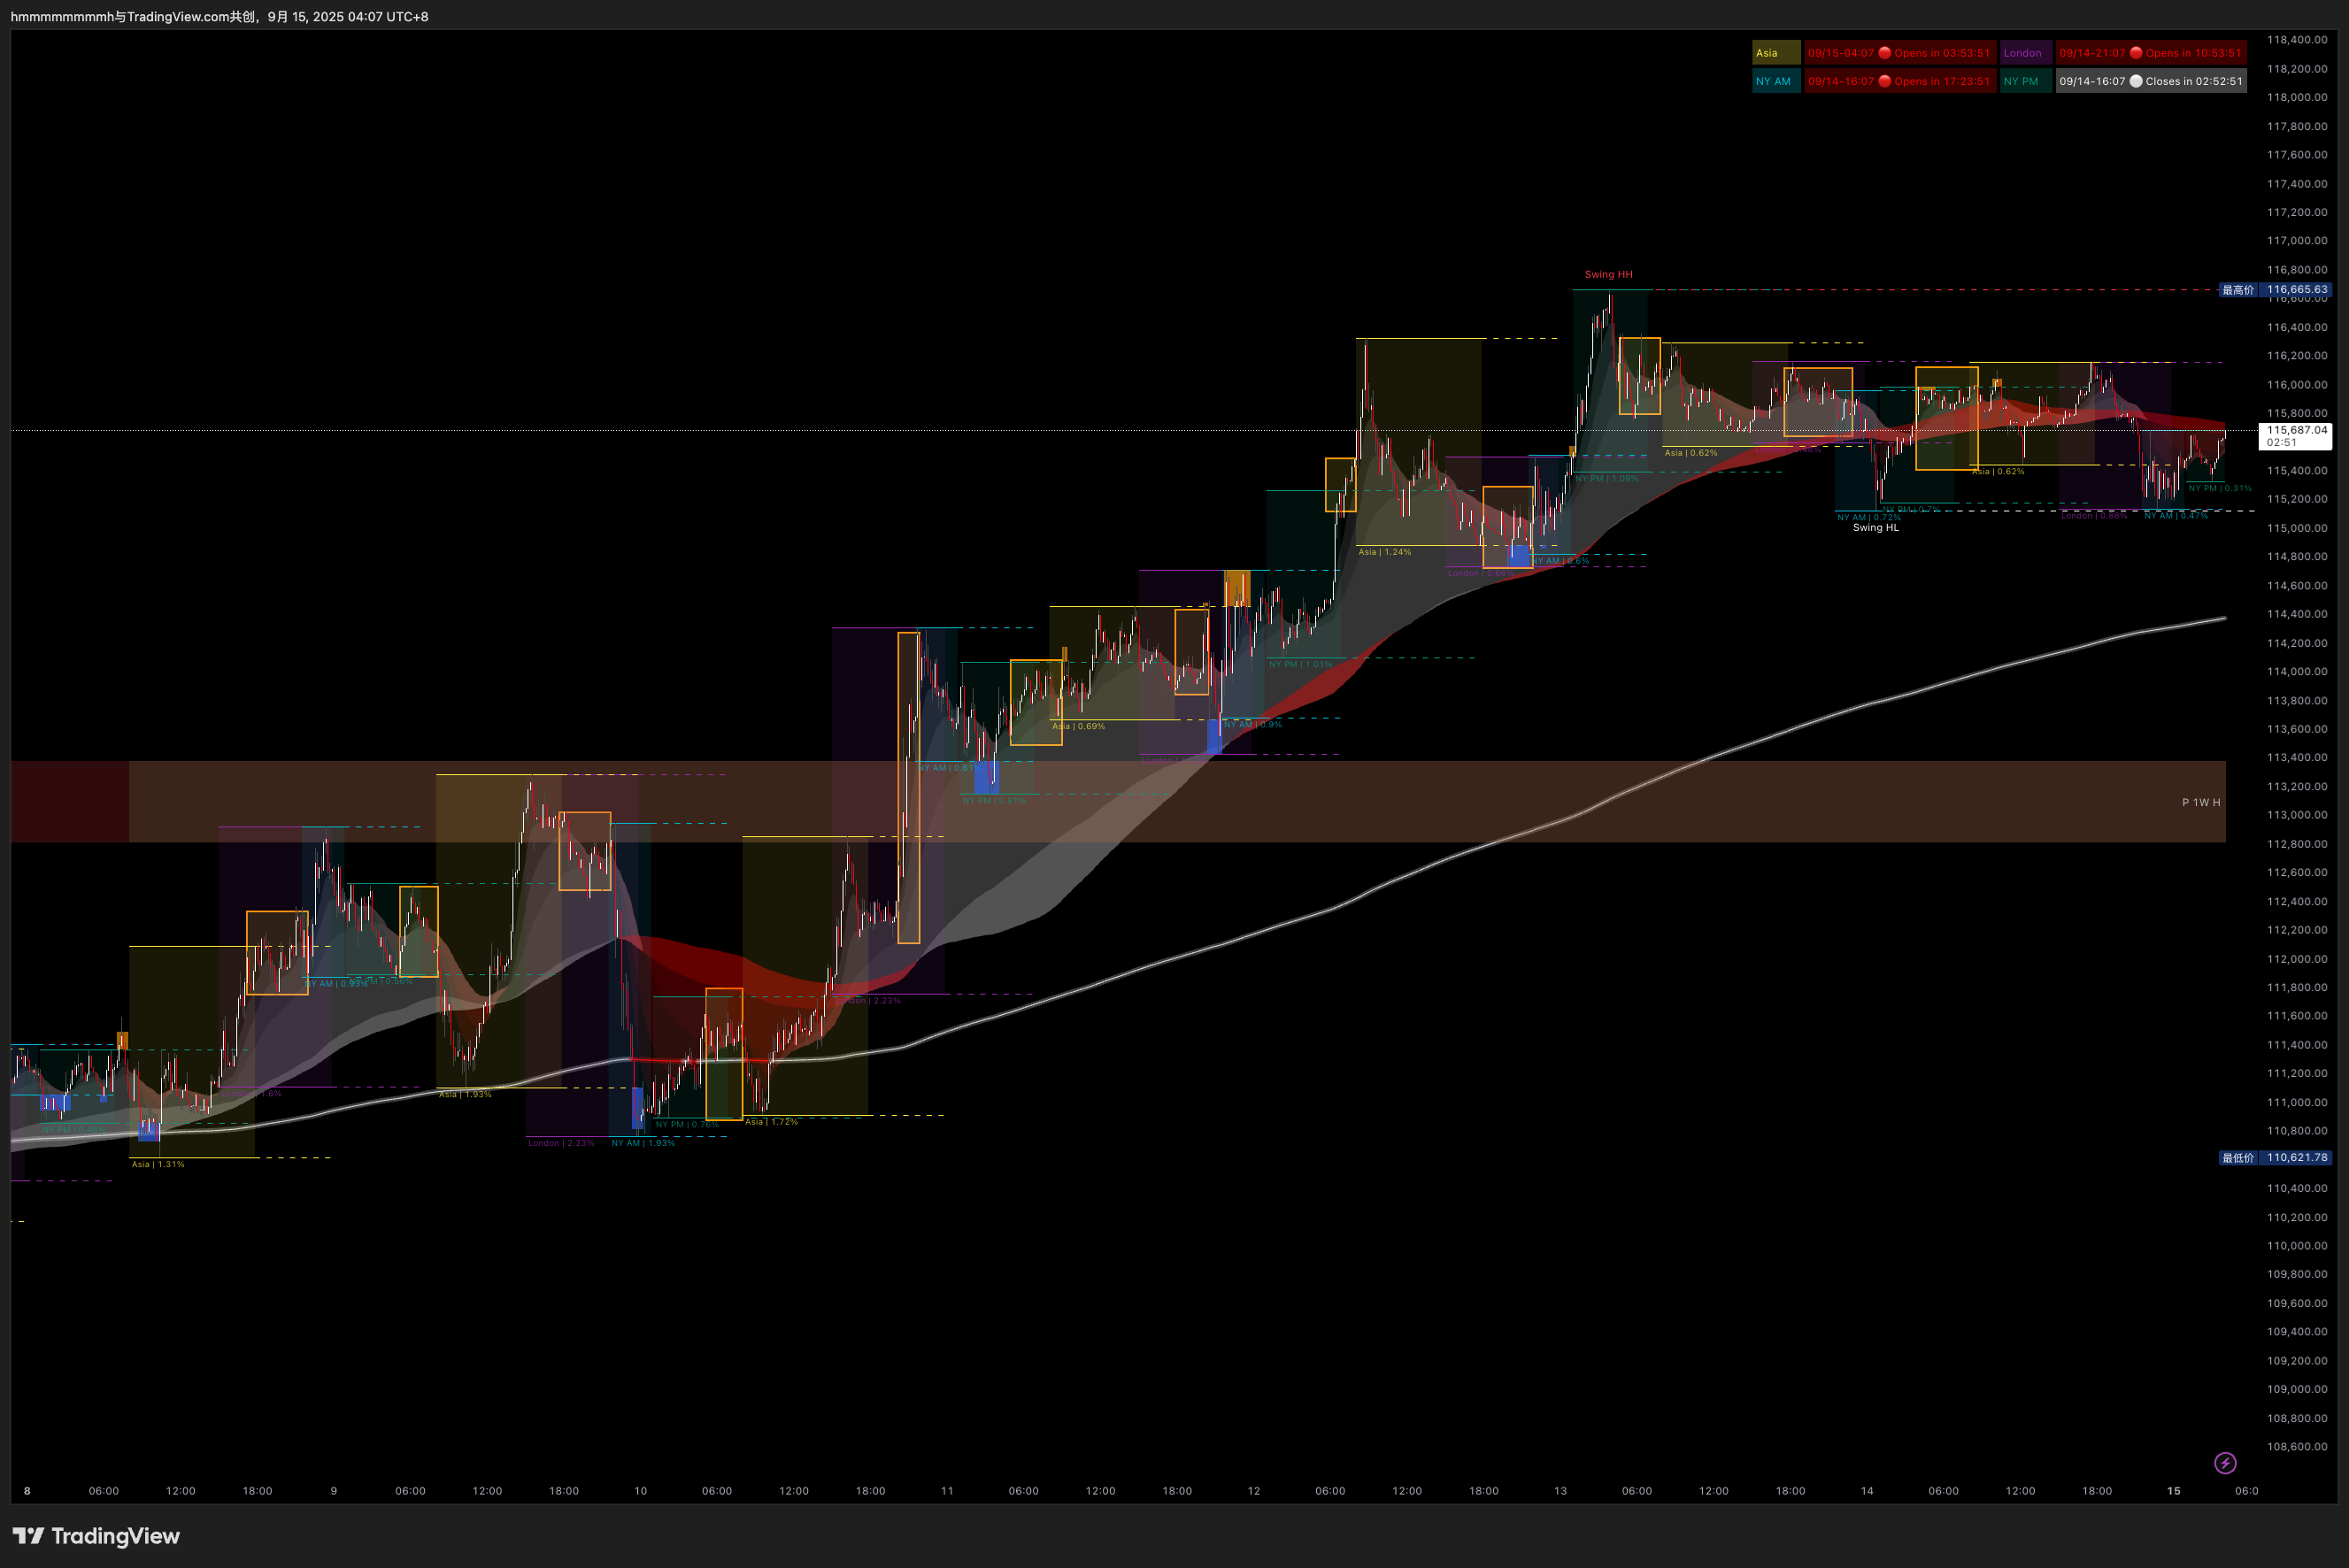 **No trade zone:The yellow box marks the hours before the Asian and New York market openings. During this time, the market is most likely to move sideways with low volatility. Try to avoid entering or closing positions within these two time periods. *
Real-time "Stop-hunt" Analysis
A "Stop-hunt" is the most common liquidity event in session-based analysis, where the price breaks above the previous session's high or below its low. Timezone Bandit provides a convenient highlighting feature for this:
- Orange Highlight: For the first break above the previous session's high.
- Blue Highlight: For the first break below the previous session's low.
- Highlight Persistence: If the price returns within the previous range after a breakout, the highlight box will remain.
- Highlight Cancellation: As mentioned earlier, the box will disappear if the price moves too far in one direction after the break.
Reversal Entry Signal
| Correct Entry Timing | Incorrect Entry Timing |
|---|---|
| After the price reverses from the highlighted area and the first candle closes without the indicator generating a highlight box. | While the indicator is still generating a highlight box or the candle is still inside it. |
The "Stop-hunt" strategy performs exceptionally well on low timeframes (LTF), but the highlight box itself is not an entry signal. A true entry requires you to watch the price action: After entering the highlighted area, the price often consolidates for a short period (potentially 1-2 hours). The ideal entry signal occurs when the breakout is clearly rejected, and the price reverses, moving completely out of the highlighted area (i.e., the indicator stops drawing the box).
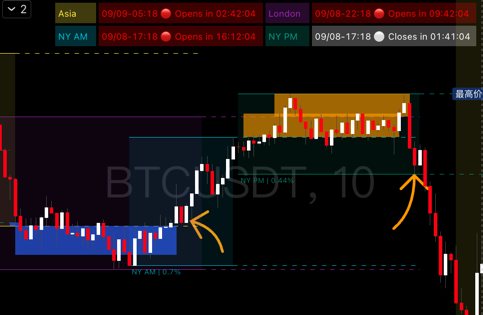
Example 2: Note the candle indicated by the arrow. The indicator is no longer generating a highlight box, presenting a potential entry signal.
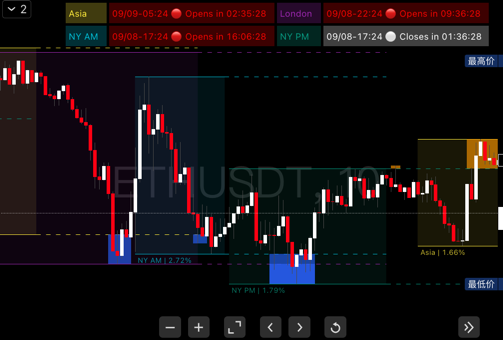
Example 3: A rare case of a direct reversal after a Stop-hunt without consolidation, but the entry logic remains the same.
The "Stop-Hunt" tool in Timezone Bandit is different from the "Stop-Hunt" tool in PowerRanger. The latter uses complex algorithms to proactively predict potential liquidity grab locations. Timezone Bandit's tool is a passive highlight based on simple session highs and lows, designed to help you judge market behavior at specific time nodes.
Strategy
This strategy is primarily for intraday and scalping, but its analytical logic can also provide short-term insights for swing trading. It is recommended to use it in conjunction with other tools like PowerRanger for comprehensive analysis.
1. Identify the Recent Price Pattern
Review the last few sessions using the methods from the Analyzing Historical Price Patterns section to identify the current market rhythm.
2. Predict the Next Session's Direction and Decide on Entry Timing
Based on the clarity of the pattern, you will form either a strong bias or a weak bias for the next session.
- Strong Bias: The historical pattern is clear, the anticipated repetition is the third or fourth one, and there are no major news or economic data events scheduled.
- Available Entry Timings: Enter directly at the session open, or wait for a Stop-hunt reversal signal.
- Weak Bias: The pattern is unclear, or it has already repeated many times.
- Available Entry Timings: Only take cautious scalping trades on clear "Stop-hunt" reversal signals. You should abandon predictions based on the session pattern itself.
- The following situations also classify as a weak bias:
- Only one session has deviated from the pattern; this is not enough to predict a reversal. Wait for a new pattern to form.
- The most recent session was consolidative or its price action was fully contained within the prior session.
- You are predicting the fourth or fifth repetition of a pattern; this carries higher risk and requires more confluence from other signals.
3. Combine with Other Factors for Conviction
Session patterns are the result of multiple market factors. Before acting, always check for other potential price drivers and catalysts to strengthen your judgment.
- News / Economic Events: Always check the MethodAlgo Discord terminal for major economic data releases scheduled for the next session.
- Key Levels: Analyze whether your asset, as well as macro assets like BTC and ETH, are at critical breakout points.
- Other Indicators: Look for signal confluence by combining insights from MethodAlgo's other tools for liquidity, price structure, and momentum.
4. Setting Stop Loss and Take Profit
The TP/SL levels for this indicator are based purely on time-based attribution, not traditional price structures.
- Take Profit (TP):
- Before the session ends or at the changeover to the next session.
- The high, low, or 50% midline of the previous session (the midline must be enabled in settings).
- Stop Loss (SL):
- For entries after a Stop-hunt reversal: Place the stop loss at the furthest edge of the Stop-hunt box.
- For entries at the session open: Place the stop loss at least at the 50% midline of the previous session, or more conservatively, at the 50% midline of the session before that.
Trading Approach Comparison
Assume a trader is looking to go long in an uptrend:
| Trading Strategy | Logic | Pros | Cons | Overall Risk |
|---|---|---|---|---|
| Traditional Support | Place a limit order at support | Safe, flexible, excellent R:R | Uncertain wait time, may miss the move or need to re-analyze | Low |
| Momentum Breakout | Market buy on a momentum signal | Low drawdown after entry | Momentum can be short-lived, small profit window, high risk of reversal | High |
| Session Pattern Strategy | Enter at the target session's open | Low running drawdown, potential for multi-hour directional profit | If the pattern fails, the direction is wrong, leading to a relatively larger loss | Medium |
Risk Management
No trading strategy is complete without strict risk management. Timezone Bandit provides powerful analytical tools, but your profitability ultimately depends on your decisions and discipline.
- Position Size: Determine your position size based on the asset's recent volatility (you can reference the volatility percentage shown by the indicator) and your risk tolerance. Reduce position size in highly volatile markets.
- Strict Stop Loss: Adhere strictly to the stop loss planned in Step 4: Setting Stop Loss and Take Profit. Never move your stop loss in the hope of a reversal, as this is a primary cause of significant losses.
- Avoid Emotional Trading: If a pattern-based prediction fails, accept it calmly. Market patterns always come to an end. Do not try to "revenge trade." Instead, go back to step one, observe and analyze objectively, and wait for a new pattern to form.
- Risk-to-Reward Ratio: Before entering a trade, ensure the potential profit (e.g., reaching the previous session's high) versus the potential loss (stop loss) provides a favorable risk-to-reward ratio (a minimum of 1:1.5 is recommended). If the ratio is poor, it's better to skip the trade.
Parameter Settings
-
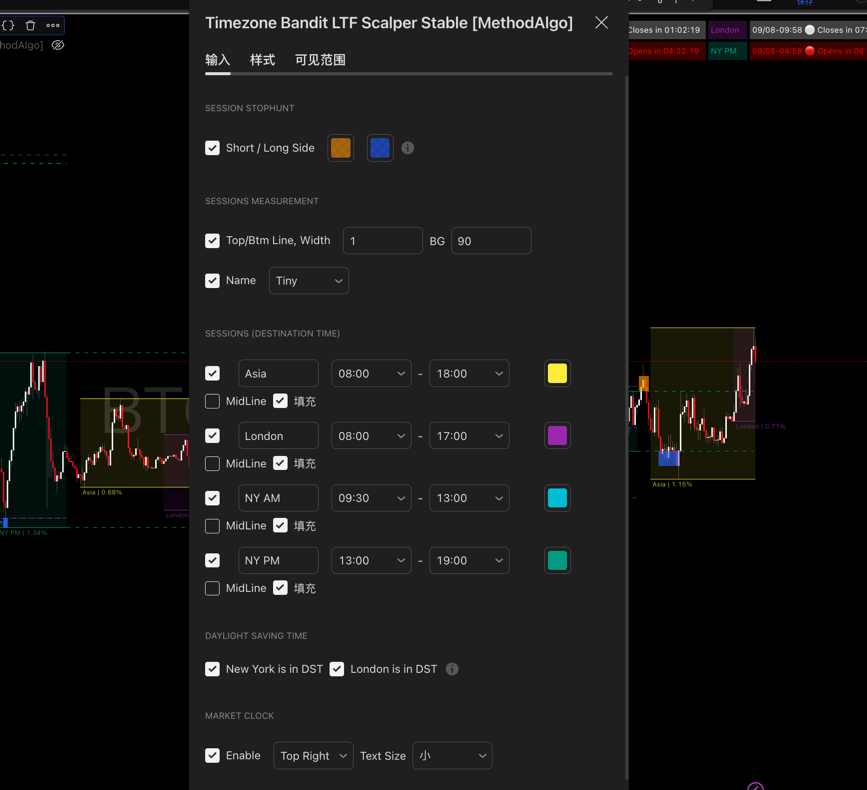
Sessions Stop-Hunt
- Toggle: Enable/disable the Stop-hunt feature.
- Colors: Customize the colors for the upper and lower Stop-hunt zones.
-
Sessions Measurement
- Lines & Background: Adjust the thickness of the session boundaries and the background fill opacity.
- Name: Toggle the visibility of the session name and adjust its font size.
-
Sessions
- Custom Time: You can change session names and customize their start and end times in 30-minute increments.
- Background Color: Customize the background color for each session.
- Midline: Optionally enable the 50% midline of the session's range to act as a weak support/resistance level.
- Fill: Toggle for the session background color.
-
Daylight Saving
- To ensure accurate time calculations, manually toggle Daylight Saving for New York and London according to the following schedule:
- New York: Turn ON on the second Sunday in March; turn OFF on the first Sunday in November.
- London: Turn ON on the last Sunday in March; turn OFF on the last Sunday in October.
- To ensure accurate time calculations, manually toggle Daylight Saving for New York and London according to the following schedule:
-
Market Clock
- Display: Control the clock's visibility, position, and font size.
Frequently Asked Questions (FAQ)
Q1: Why doesn't my indicator show up on the 1-hour chart?
A: This indicator is designed specifically for intraday trading, and its core logic is based on capturing fine-grained price movements within sessions. Therefore, it only supports timeframes of 30 minutes and below. On higher timeframes, the indicator will automatically hide to prevent misleading signals based on incorrect periodic analysis.
Q2: What happens if I forget to adjust the Daylight Saving settings?
A: Daylight Saving causes a one-hour shift in the actual trading times for New York and London. If you forget to adjust the setting, the session ranges drawn by the indicator will be misaligned with the market's true active hours by one hour. This could lead to misjudgments of market rhythm and cause you to miss optimal, time-sensitive trading opportunities.
Q3: How should I interpret a "Stop-hunt" signal from this indicator and a "Liquidity Hunt" signal from PowerRanger appearing at the same time?
A: This is a very strong signal confluence, which significantly increases trade conviction. The "Stop-hunt" confirms a liquidity grab event at a specific time node, while the "Liquidity Hunt" signal confirms from a price structure and algorithmic level that this is a significant liquidity pool. When both occur simultaneously, the probability of a price reversal is extremely high, making it a high-priority trading opportunity.
Q4: Is this indicator suitable for beginner traders?
A: Yes, with a caveat. For beginners, Timezone Bandit offers a very intuitive and structured way to view the market, making it an excellent tool for learning to understand global market dynamics. However, we strongly recommend that beginners: 1) first use it in demo trading to become fully familiar with its features and strategies; 2) strictly adhere to risk management principles and avoid live trading until they have a complete understanding.
The engineers at MethodAlgo are proud of their work, but it's essential for you to understand that no indicator / algorithm can guarantee perfect success. Trading profits and losses are greatly influenced by the trader's psychology, knowledge, experience, and risk management.
The algorithmic interfaces we provide are all part of T.A.T.A. When trading in reality, traders should make their decision like T.A.T.A, considering various factors and signals from other tools to establish confluence system.
Any unclear explanations or errors in this tutorial? Please contact MethodAlgo's @Staff on the Discord Trading Terminal for corrections.