Chart Setup
After you have gained Access, your TradingView account has the corresponding indicator permissions for the package you have chosen. Now, let's add them to your charts.
Add Indicators
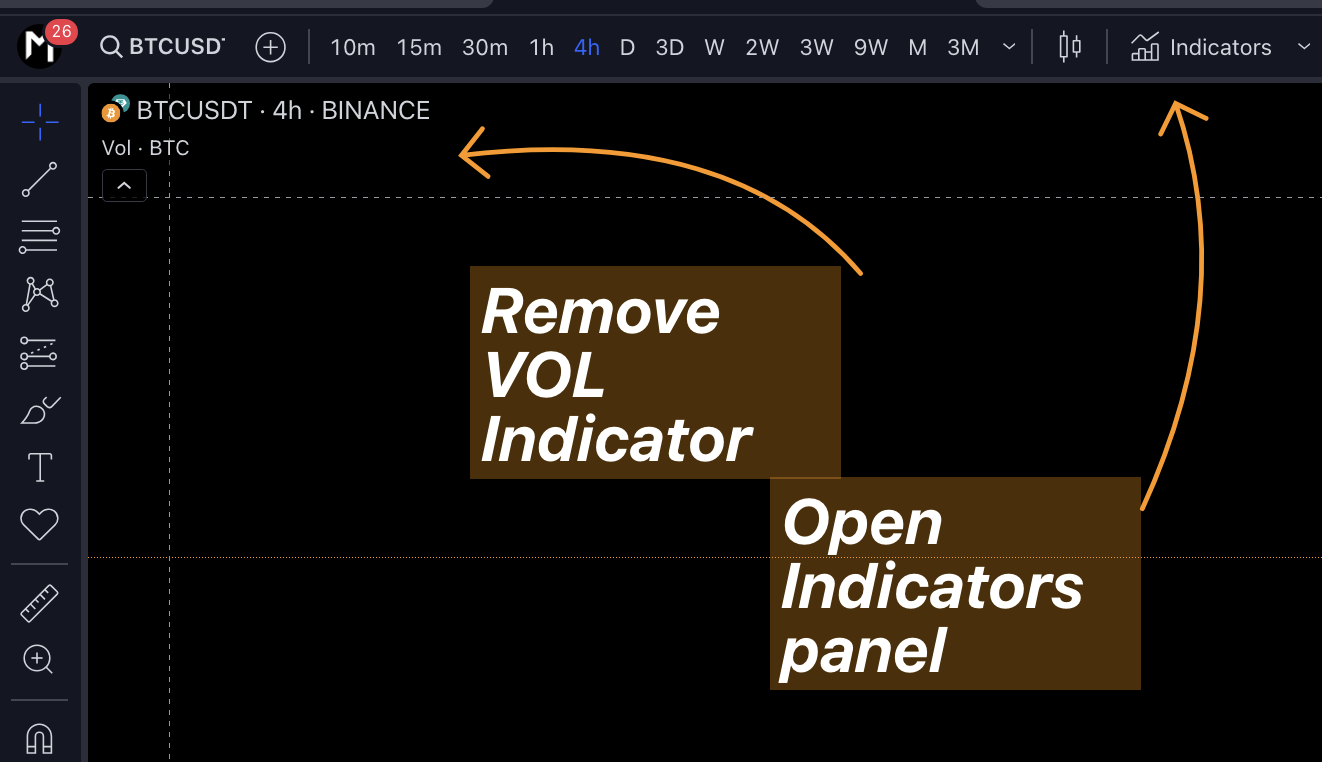
If you are new to TradingView, you will need to remove the default Vol indicator from newly created charts. That is because you can only add a maximum of 2 indicators to your chart for free, more will need a paid TradingView subscription. which unnecessary for new user.
And to use MethodAlgo system, you need to have at-least Power Ranger and Liquidity Detective on your chart.
The process is slightly different for desktop and mobile versions:
- Desktop
- Mobile
1. fully refresh your chart by press `F5` or `⌘ + R`
2. Open indicator panel by tap `Indicators` in menu bar or use keyboard shortcut `/`
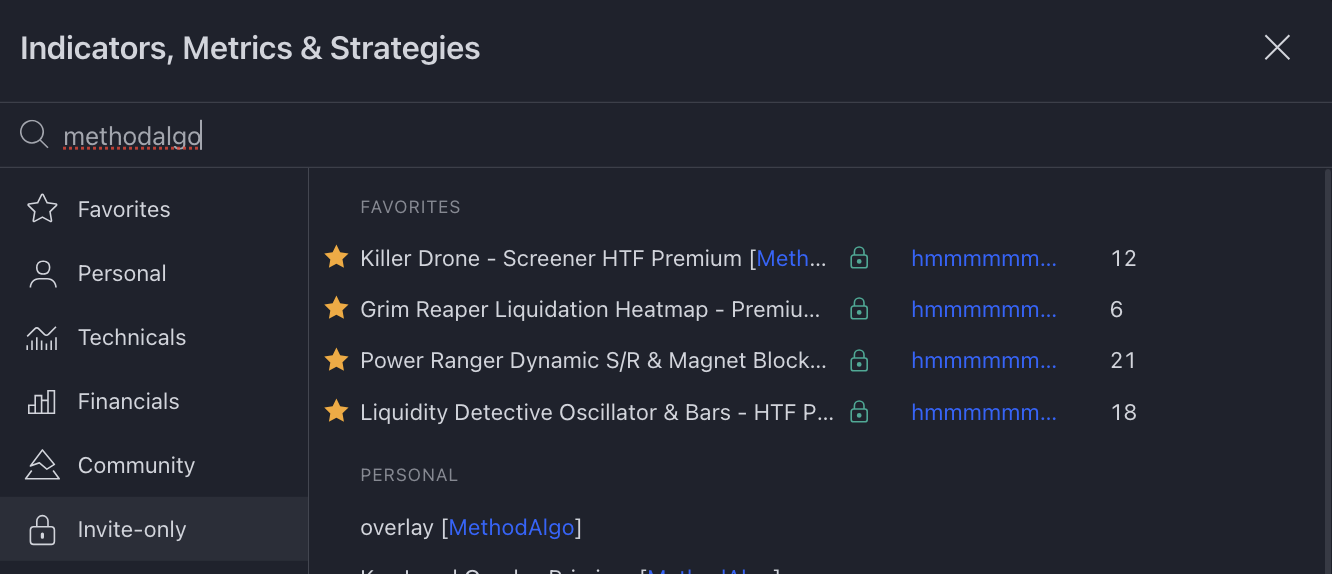
3. Locate `Invite-Only` category
4. Click on the names to add indicators to chart,
   You need at-least `PowerRanger` and `LiquidityDetective`
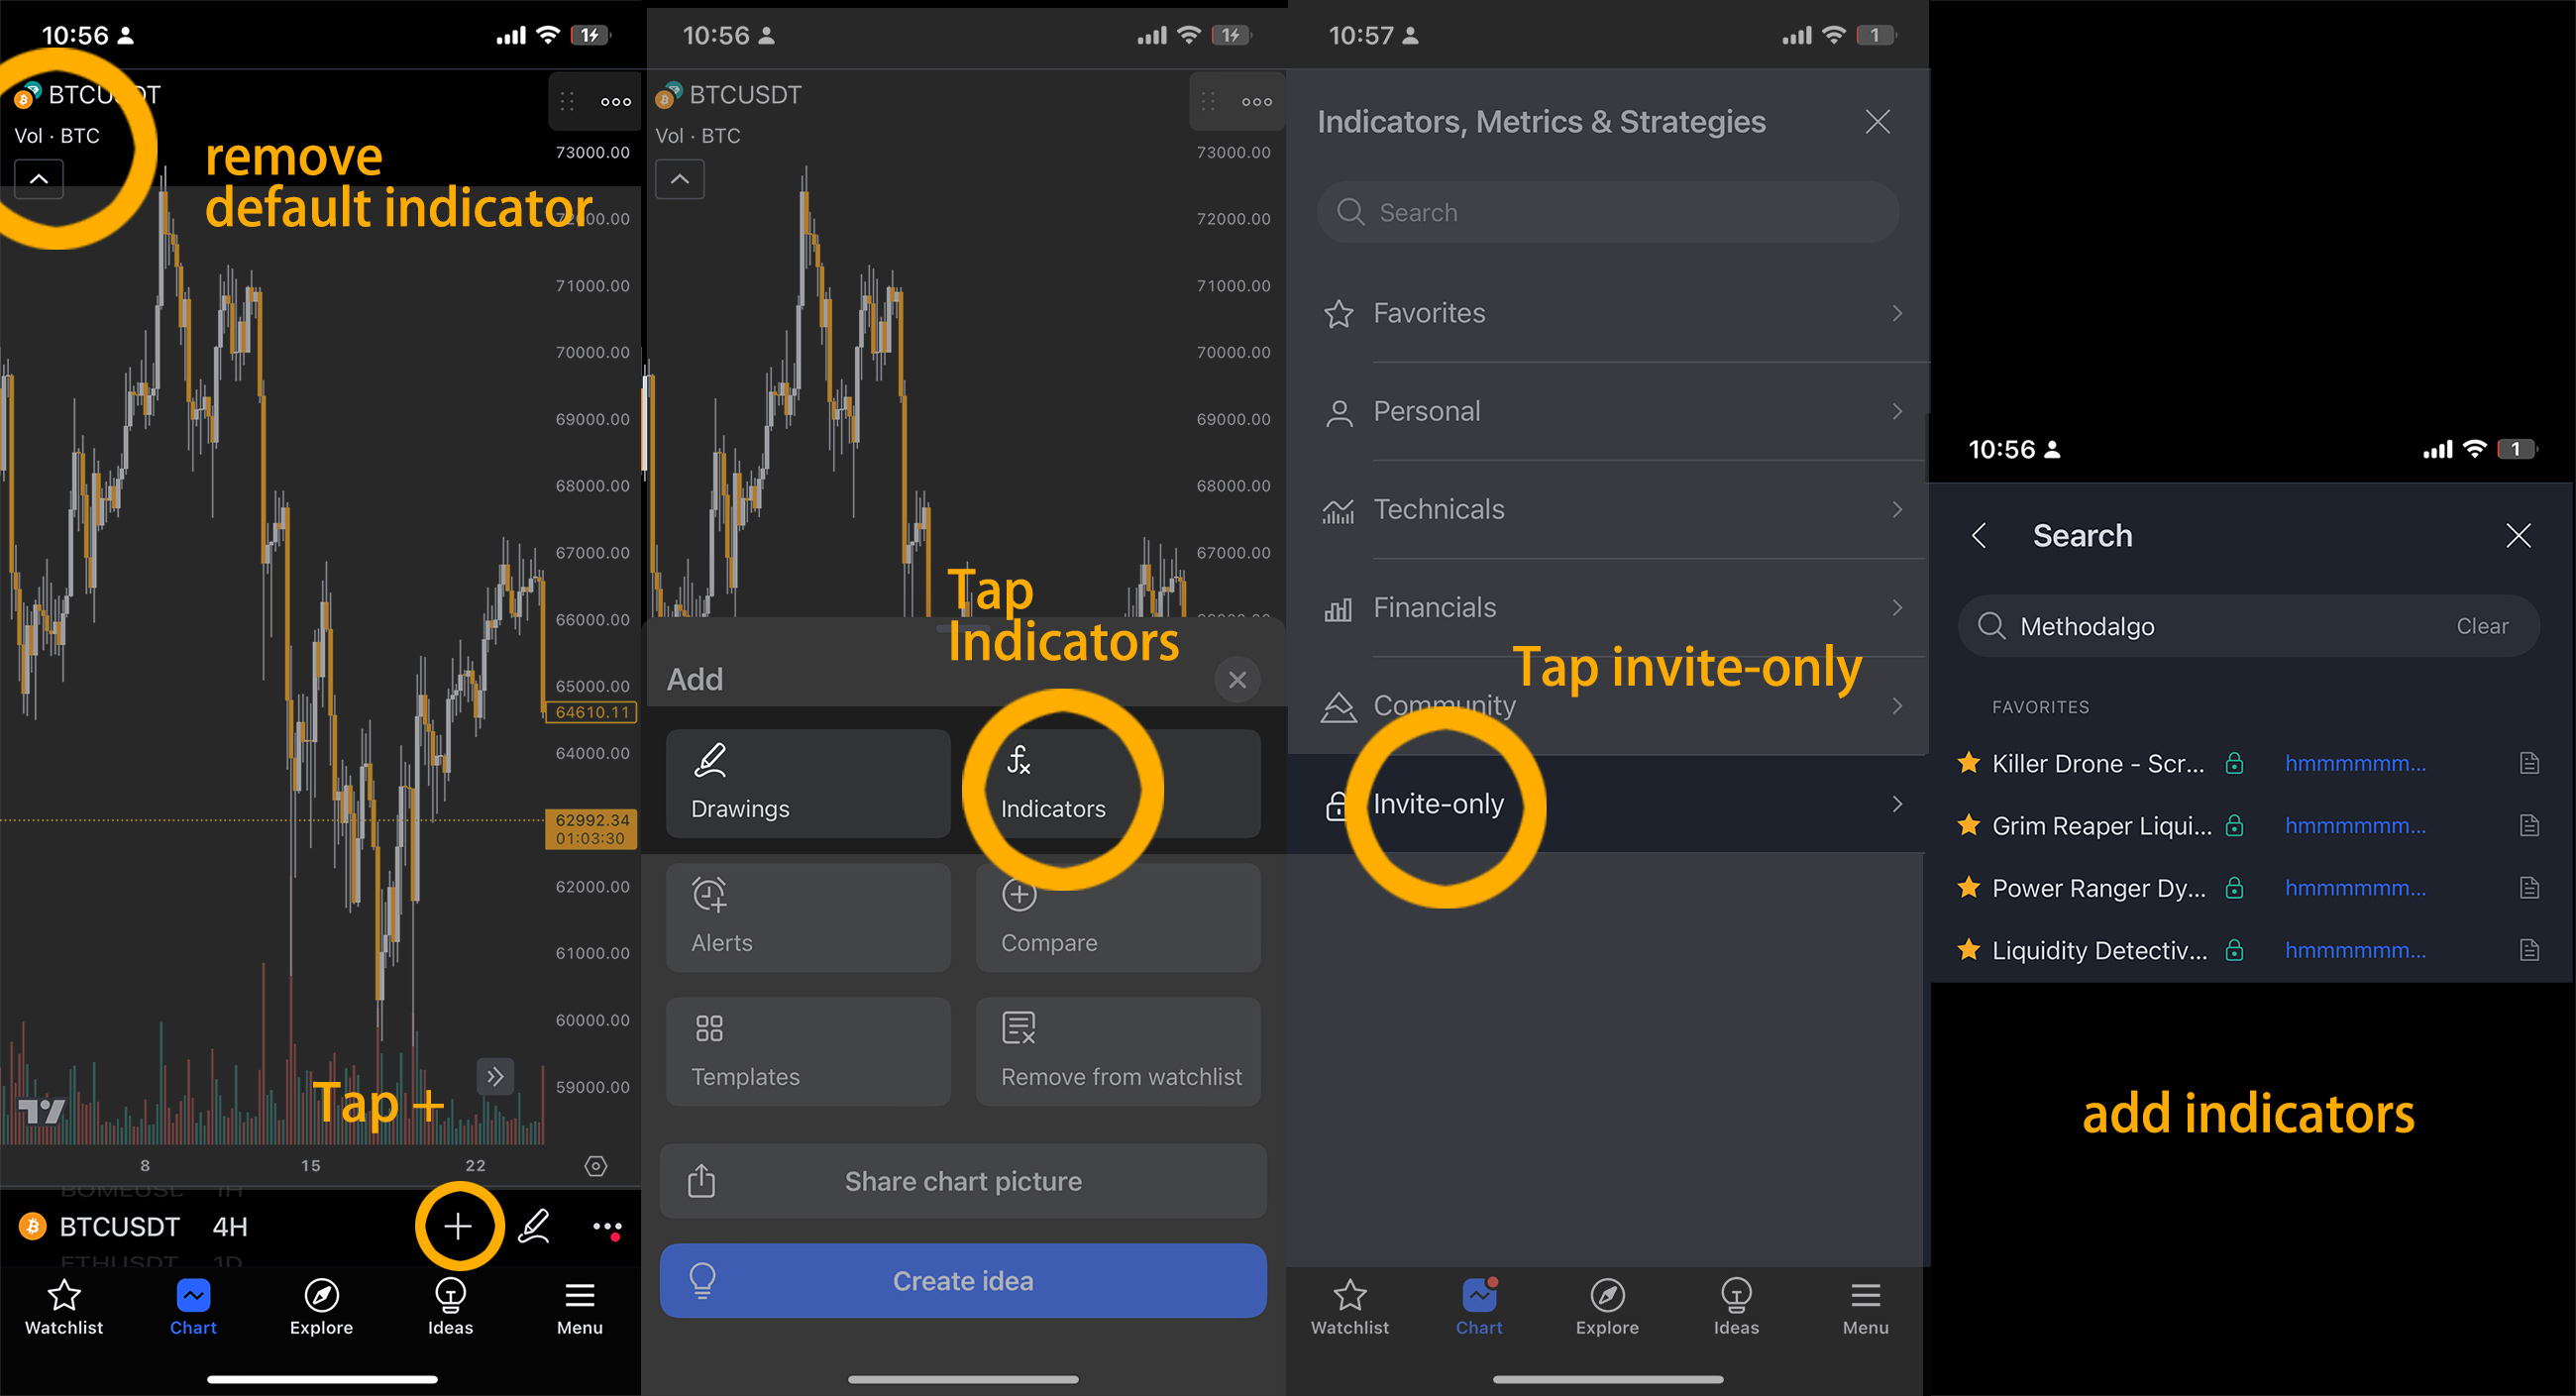
1. Close and reopen the TradingView app completely from your phone's background.
   (no need to log out, just close and reopen the app)
2. Tap `+` button at the bottom of the chart then tap `Indicators`
3. Tap `Invite-Only` category
4. Tap on the names to add the indicators to your chart.
   (You need to add at least PowerRanger and LiquidityDetective.)
Update Indicators
We actively update our indicators. When you receive an email or an announcement in the Discord terminal notifying you of an indicator update, please follow these steps:
- Desktop
- Mobile
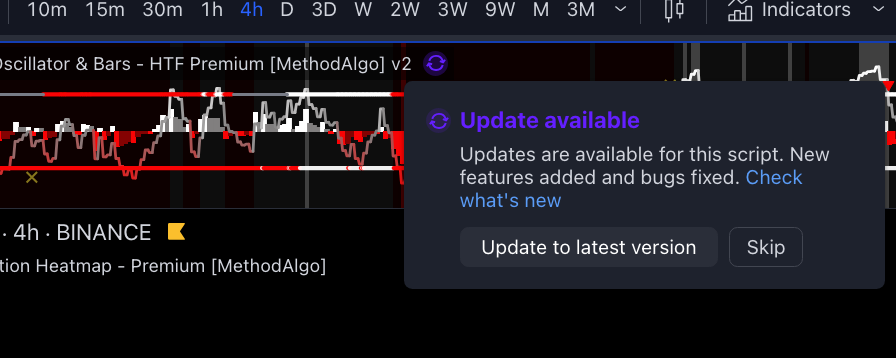
- Refresh your TradingView cache: Press
F5or⌘ + Rto fully refresh your chart - Click on the update button on the side of indicator name to update.
- Save layout
- Close and reopen the TradingView app completely from your phone's background (no need to log out, just close and reopen the app)
- Tap on the update button on the side of indicator name to update.
- Save layout
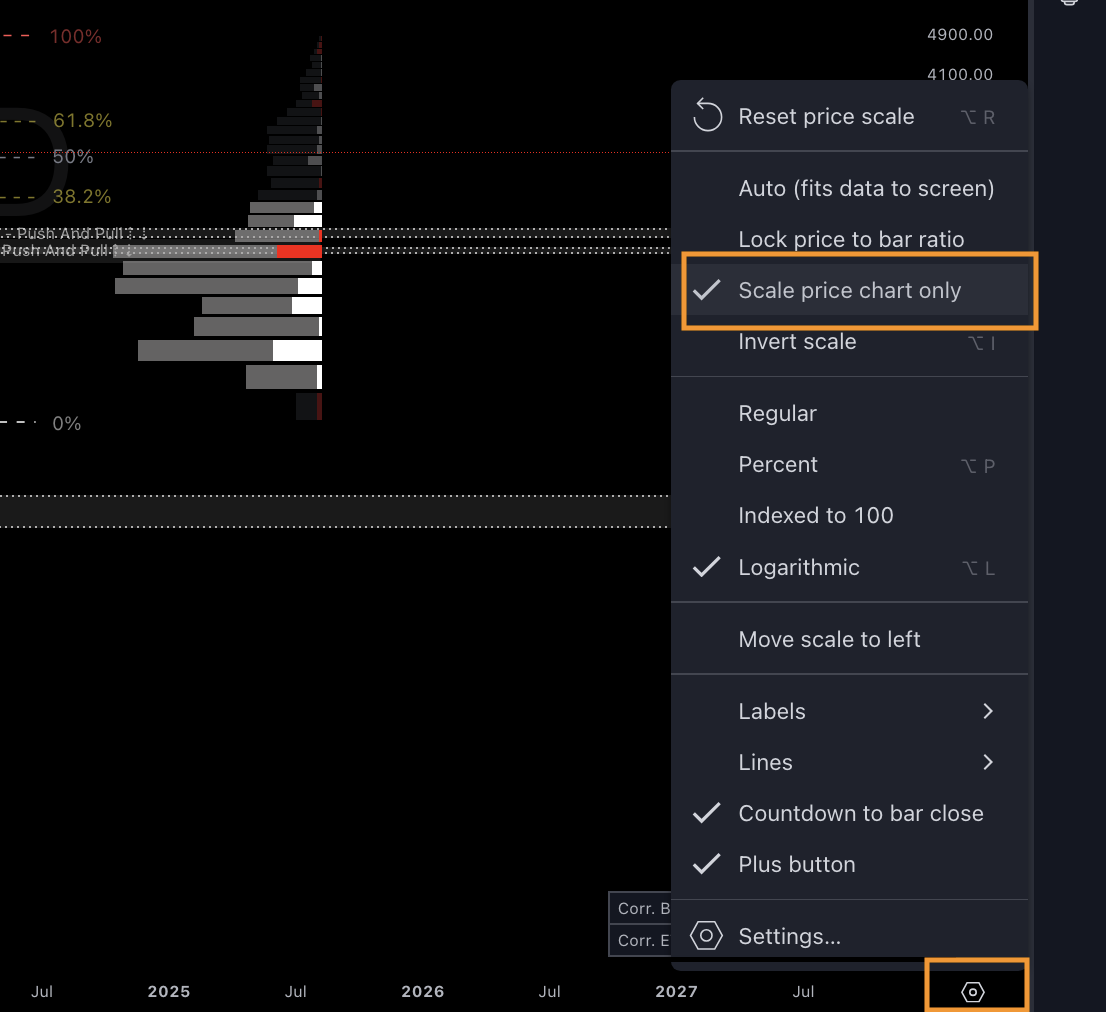
Adjust Chart Scale
By default, new charts may look zoomed out, because the Magnet block feature can detect from years ago
To fix, open the chart settings and enable the "Scale price chart only" option. If the scale doesn't adjust automatically, double-click on the price bar on the right side of the chart
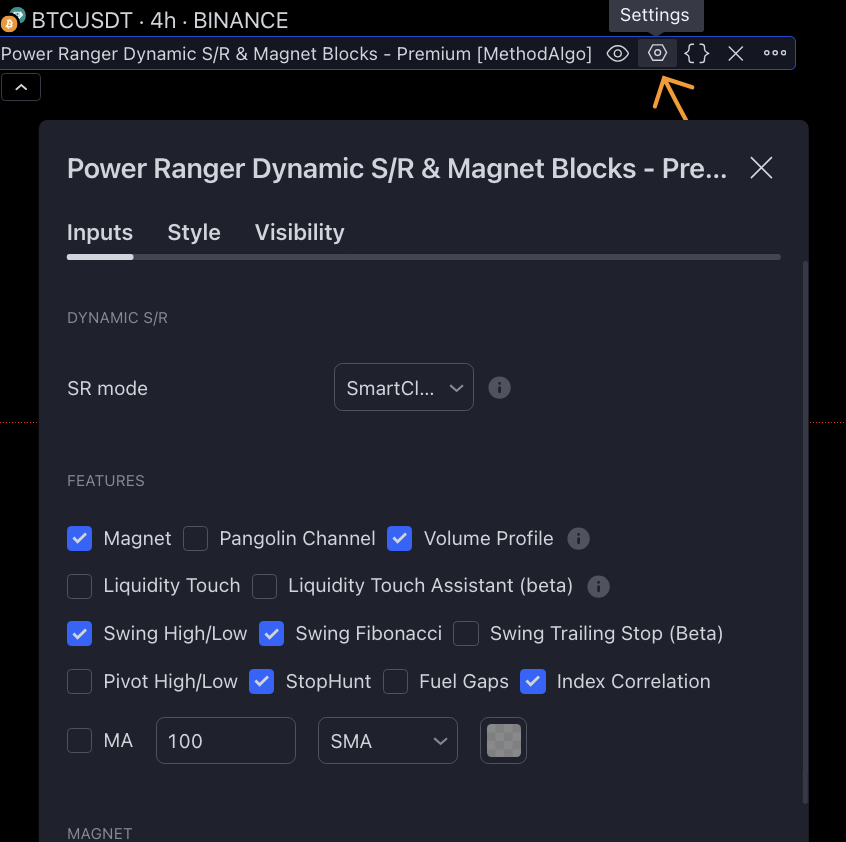
Configure Parameters
Click on the ⚙️ button next to the indicator name to open the indicator parameter configuration interface. The default settings are commonly used tools with optimal parameters. You can adjust these settings for your own analysis needs.
if you are on Trial, to avoid sensory overload, it is advised to disable all the tools in our indicators Features setting, but keep all parameters in default. open tools from Features section one by one following the tutorial docs and learn, and keep the tools you need in the end.
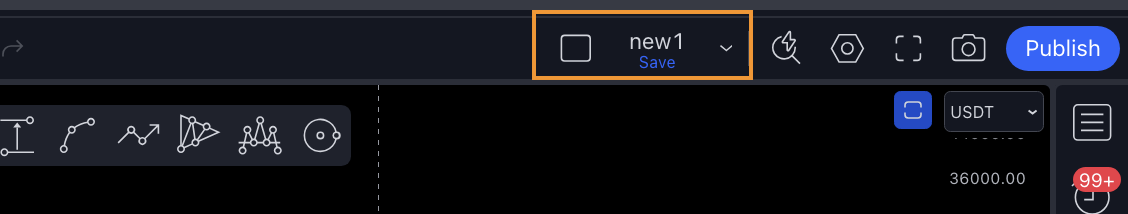
Save Layout
You need to save the layout of your current chart, otherwise you will need to re-add and configure the parameters each time you restart TradingView.
- Desktop
- Mobile
1. Click `Save` under your layout name on upper right corner of the chart, or
2. use keyboard shortcut:`Ctrl + S` 或 `⌘ + S`
1. Tap on the `···` button in the bottom right corner of the toolbar then swipe down
2. Find and tap on `Save`
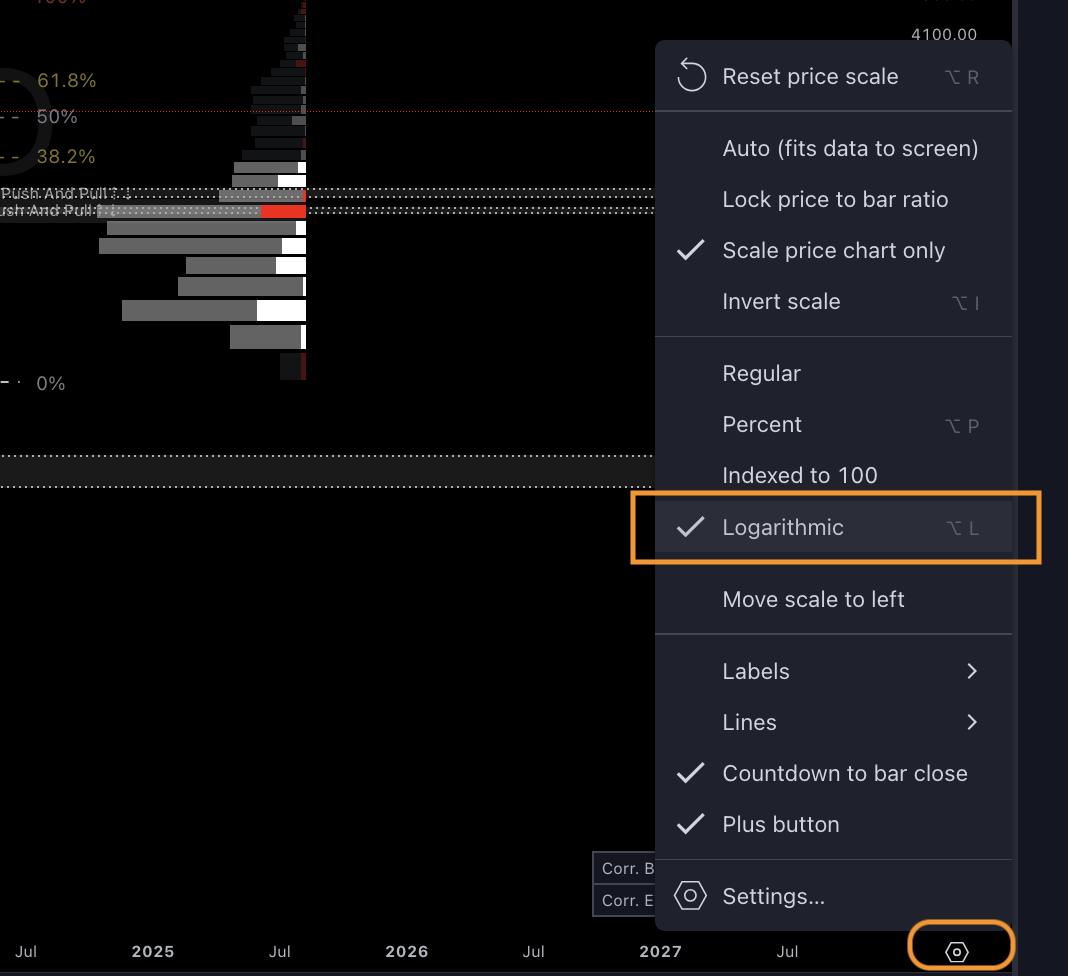
Log Mode
Most of our tools built inside of indicator support both logarithmic (log) and linear (linear is the default) charts.
Some features need to be manually enabled to support log mode in indicator setting (e.g., Swing Fibonacci), and some features can only be used in log mode (e.g., Pangolin Channel).
To enable log mode for a chart, open the ⚙️ option in the price bar and enable the "Logarithmic" option:
Next Steps
Now that you have added the indicators to your chart and saved the layout, let's learn about the specific functions of the indicators:
Anything unclear or buggy in this tutorial? Please report it to our discord Staff!