RedEye Raven
Concept
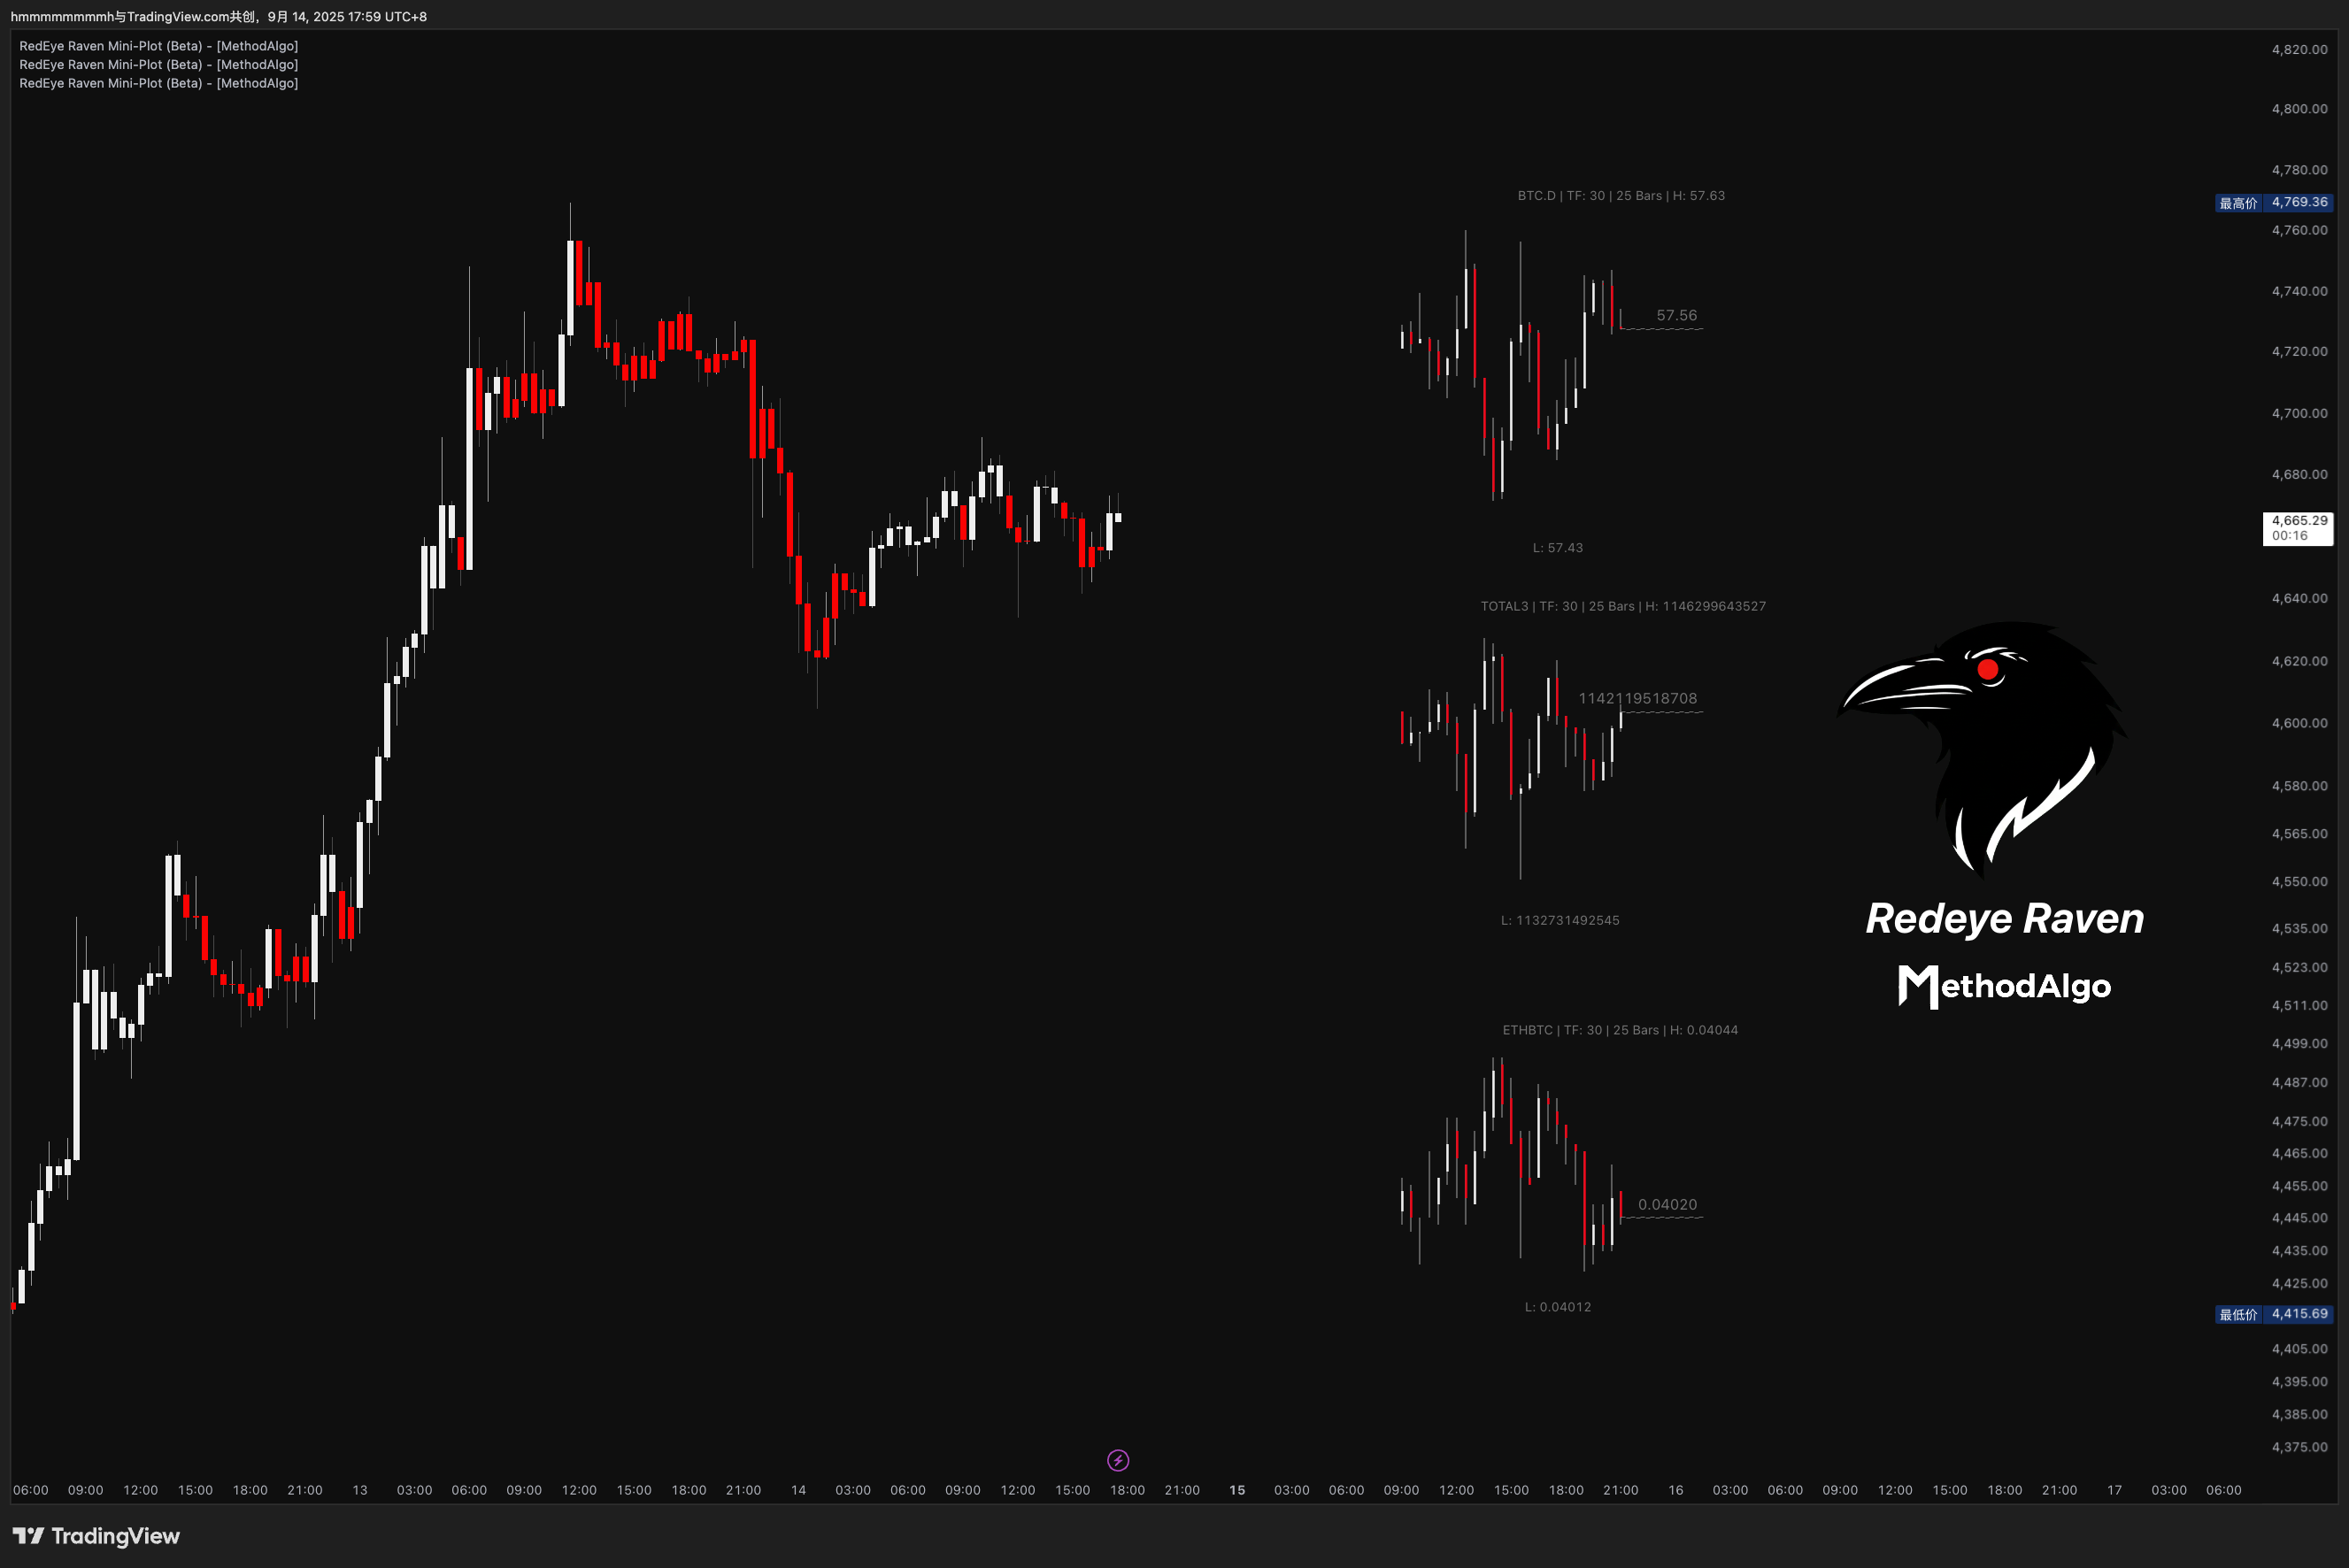
RedEye Raven is a powerful chart assistance tool that displays as "mini-charts" on the right side of your main chart, used for real-time monitoring of any assets and timeframes you customize.
In the fast-paced cryptocurrency market, asset prices are often closely related to specific indices (like BTC.D, TOTAL3) and macro assets (like BTC, ETH). Traditionally, traders need to switch between multiple charts or use multiple screens to perform cross-analysis, which is both inconvenient and inefficient. Hence "RedEye Raven" come to the rescue,it allows monitor multiple assets simultaneously within a single chart interface. Provides a more intuitive grasp of macro market dynamics, enhancing your market intuition as well the quality of your decisions.
What You Can Do With It
- Cross-Analysis: Track any asset supported by TradingView for cross-analysis, such as market indices (BTC.D, TOTAL3, SPX), macro assets (XAU, BTC, ETH), or relative pairs (ETHBTC, SOLBTC).
- Quadrant Analysis: By comparing the trends of the main chart asset with the monitored assets, you can discover potential leading or lagging relationships, providing multi-dimensional data support for your trading strategies.
- Enhancing Efficiency: Integrate multiple mini-charts (up to 3) on one screen, reducing the frequency of switching between different tabs. This is especially useful for users with a single screen or a laptop.
- Cross-Market Versatility: Whether you trade cryptocurrencies, forex, metals, or stocks, as long as the asset is available on TradingView, RedEye Raven can assist with your monitoring needs.
Layers
- Mini K-line Chart: A candlestick chart drawn based on your customized asset and timeframe.
- Text Information: Displays symbol name, its timeframe, and the number of candles.
- Price Highs and Lows: H (High) represents the highest price within the selected range, and L (Low) represents the lowest price.
- Real-time Price Line: A horizontal line that displays the current latest price in real-time.
Classic Monitoring Strategies
Cross-analysis is typically applied in two ways: analyzing the performance of the same asset across different timeframes (trend confirmation), or predicting market direction by comparing different assets (usually indices).
1. Monitor the Same Asset, Different Timeframes
- Main Chart on a Lower Timeframe, Raven on a Higher Timeframe (HTF): Used to observe key candle patterns and reversal signals on a High Timeframe, helping you avoid getting lost in the noise of lower timeframes.
- Main Chart on a Higher Timeframe, Raven on a Lower Timeframe (Intraday): Used to observe intraday candle and price action, helping you pinpoint entry and exit points more accurately.
2. Monitor Different Assets for Cross-Analysis
Core Market Indices
The vast majority of assets in the crypto market are highly sensitive to the following indices and assets. Here, the price movement of an individual altcoin is classified as micro, while indices are macro. The individual altcoin is just one component of the index's movement. While some tokens may have independent rallies, most altcoins follow the market cap indices. An increase in these indices leads to an overall market lift. What we often call "Altseason" is precisely the combination of drop from BTC.D and surge of TOTAL3.
| Data Source | Asset Name | Description | Applicable to | Interpretation |
|---|---|---|---|---|
| CRYPTOCAP | BTC.D | The percentage of Bitcoin's market cap relative to the total crypto market cap | All altcoins | See Enumeration of Index Interpretations |
| CRYPTOCAP | TOTAL | Total cryptocurrency market cap (dominated by BTC) | BTC | Usually move in tandem |
| CRYPTOCAP | TOTAL2 | Total crypto market cap excluding BTC (dominated by ETH) | ETH | Reflects the overall trend of ETH and altcoins |
| CRYPTOCAP | TOTAL3 | Total crypto market cap excluding BTC and ETH (i.e., total altcoin market cap) | All altcoins | A "barometer" for the overall altcoin market |
Macro and Forex-Type Assets
| Category | Asset Name | Applicable to | Interpretation |
|---|---|---|---|
| Macro Asset | BTC | ETH | Analyzing it with BTC and BTC.D can provide early trend insights. |
| Macro Asset | BTC | Individual altcoins linked to BTC's performance | Usually move in tandem. |
| Forex-Type Asset | ETH | ETH Ecosystem | Analyze alongside altcoins in the ETH ecosystem; they usually move in tandem. |
| Forex-Type Asset | ETH BTC | ETH and Ethereum ecosystem altcoins | Analyze alongside ETH and altcoins. Rise: ETH and ecosystem rise. Fall: ETH and ecosystem fall. |
| Forex-Type Asset | SOL LBT C | SOL and Solana ecosystem altcoins | Analyze alongside SOL and assets in the SOLANA ecosystem. Rise: SOL and ecosystem rise. Fall: SOL ecosystem falls. |
Cross-Analysis Strategies*
The following strategies are provided by MethodAlgo and contain the author's personal understanding and biases of the market. They are for reference only and should be used with caution. RedEye Raven itself does not provide any algorithmic signals. You need to interpret the information in the mini-charts in conjunction with your own trading system and analysis methods.
Recommended Strategy Combinations
Altcoins
For altcoin traders, we generally recommend the combination of BTC.D + TOTAL3 + BTC, as the trends of almost all altcoins are closely related to these three indicators. The choice of timeframe depends on your personal trading style (e.g., short-term traders might choose 1m or 5m, while swing traders might choose a timeframe consistent with the main chart).
ETH
ETH is sensitive to its market dominance and heavily relies on cross-analysis. Cross-analyzing BTC.D and BTC can provide predictive insights for scalpers.
- For swing traders, we typically recommend the combination of BTC.D + ETHBTC + TOTAL2.
- For scalpers, we suggest the combination of BTC.D + ETHBTC + BTC.
Enumeration of Index Interpretations
TOTAL3
TOTAL3 is the total market cap of altcoins and is used for chart analysis of all altcoins other than BTC and ETH. Most of the time, altcoins rise and fall with it, except during periods of independent rallies for specific tokens. Notably, when BTC and TOTAL3 rise synchronously while BTC.D is falling, it signifies an overall increase in market risk appetite, which is what we commonly refer to as "Altseason."
ETHBTC
ETH/BTC represents the price of Ethereum denominated in Bitcoin. It directly measures the relative strength of Ethereum against Bitcoin, independent of their USD valuations, making it an excellent leading indicator for ETH's trend. As the two largest and most liquid crypto assets, capital flow between them is a powerful indicator of broader market sentiment. Ethereum, with its vast DeFi and smart contract ecosystem, is often considered the leader of the altcoin market. Therefore, the ETH/BTC ratio is frequently used as a leading indicator. When it rises, it also means ETH is outperforming BTC.
ETH/BTC and ETH Price Analysis
| ETH/BTC | BTC Price | Interpretation | ETH Price |
|---|---|---|---|
| Up | Down or Stable | ETH has an independent rally. | Up |
| Down | Up or Stable | ETH is weaker than the market. | Down |
| Down | Down | ETH leads the decline. | Crashes |
| Stable | Up | ETH follows the rise, but is weaker than BTC. | Up |
| Stable | Down | ETH follows the fall. | Down |
BTC.D
Bitcoin Dominance (BTC.D) is an analytical index applicable to all assets. Below is an exhaustive enumeration of the combined analysis of BTC.D and BTC:
| BTC.D | BTC Price | Interpretation | Altcoin Price |
|---|---|---|---|
| Up | Up | Capital flows back to BTC; market fear or risk-aversion | Down |
| Up | Down | BTC "sucks" liquidity; extreme market panic | Crashes |
| Up | Stable | Capital flows from altcoins to BTC | Stable/Down |
| Stable | Up | Healthy market rotation, BTC leads the rally | Up |
| Stable | Down | Weak market sentiment | Down |
| Stable | Stable | Weak market sentiment | Stable/Down |
| Down | Up | Altcoin season, capital overflows | Surges |
| Down | Down | Overall market decline, but BTC falls more significantly | Stable/Down |
| Down | Stable | Capital flows into altcoins, optimistic market sentiment | Up |
Further Reading: Cross-Analysis and Quadrant Analysis
In the ever-changing cryptocurrency market, understanding the flow of capital is key to navigating its cyclical fluctuations and making informed decisions. Merely observing the price changes of a single asset is like seeing the trees but not the forest. A more macroscopic and profound perspective requires us to use a series of key market indices to paint a complete picture of capital flow. This extended reading will delve into the Bitcoin Dominance Index (BTC.D) and the Total Market Cap (TOTAL) series of indices, and on this basis, construct a practical four-quadrant analysis framework to help traders identify the current market stage and adopt corresponding strategies.
Bitcoin Dominance Index (BTC.D): The Core "Wind Vane" of Market Sentiment
The Bitcoin Dominance Index (BTC.D) measures the percentage of Bitcoin's market capitalization in the total cryptocurrency market capitalization. It is widely recognized as the single most important indicator for understanding the relative strength of Bitcoin against the broader altcoin market. Its trend changes directly reflect the overall risk appetite of the market:
- BTC.D Up: Usually signifies a "risk-off" sentiment. During market pullbacks, high uncertainty, or the early stages of a bear market, capital flows from more volatile altcoins into the relatively "safe" Bitcoin, causing BTC.D to rise. This indicates that investors are prioritizing capital stability over the potential excess returns from altcoins.
- BTC.D Down: Signifies a "risk-on" sentiment. This indicates that investors' risk appetite is increasing, and capital is beginning to rotate from Bitcoin to altcoins in search of higher potential returns. A sustained decline in BTC.D is a key prerequisite for the arrival of an "altcoin season."
- BTC.D Stable: Indicates that the market is in a temporary state of equilibrium, with Bitcoin and altcoin prices moving up or down at a similar rate.
However, a deeper analysis reveals the role of BTC.D as a measure of "capital saturation." After Bitcoin experiences a strong rally, a prolonged period of high and stable BTC.D is not a bearish signal for altcoins but may be a leading indicator of an impending capital rotation. The logic is that the first stop for capital entering the crypto market is usually Bitcoin, which has the highest recognition and liquidity, pushing up its price and dominance.
When Bitcoin's rally plateaus or slows down, its risk-reward appeal to new capital diminishes. At this point, investors who have profited from Bitcoin's rise have an increased risk tolerance and begin to look for exponential growth opportunities in smaller-cap altcoins. This process triggers a cascade of capital rotation: profits move from Bitcoin to large-cap altcoins like Ethereum, then to mid-caps, and finally to small-cap projects. The most direct manifestation of this rotation on the chart is the decline of BTC.D. Therefore, after a major Bitcoin rally, closely monitoring whether BTC.D is peaking or breaking key support is a crucial strategy for timing the altcoin market.
The TOTAL Index Family and the Capital Flow Confirmation Framework
While BTC.D is crucial, relying on it alone for decision-making is flawed. a truly robust analysis requires a multi-index framework that confirms both relative performance (via BTC.D) and absolute capital inflow. This is where the TOTAL index family comes in.
- TOTAL: Represents the total market capitalization of all cryptocurrencies, serving as the broadest measure of the health and scale of the entire digital asset space.
- TOTAL2: Represents the total market capitalization of all cryptocurrencies excluding Bitcoin. This is a vital index because Bitcoin's massive size can sometimes distort the TOTAL chart, masking the true health of the altcoin market.
- TOTAL3: Represents the total market capitalization of all cryptocurrencies excluding Bitcoin and Ethereum. This index provides the most granular view of the more volatile and speculative small-cap altcoin market.
Capital Flow Confirmation Framework
The core logic of this framework is to answer a fundamental question for altcoin investors: "Is now a good time to increase my altcoin exposure?"
-
A falling BTC.D chart answers part of the question: "Altcoins are getting stronger relative to Bitcoin." But this can be misleading. For example, if Bitcoin falls by 50% and altcoins only fall by 40%, BTC.D will also fall, but this is by no means a bullish scenario.
-
A rising TOTAL2 chart answers another key question: "Is new, real money flowing into the altcoin market, causing its absolute value to rise?".
-
Therefore, the highest probability scenario for entering an "altcoin season" is the confluence of two conditions:
- (1) a clear downtrend in BTC.D, and simultaneously
- (2) a clear uptrend in TOTAL2 or TOTAL3.
This framework effectively filters out false signals. The fall in BTC.D confirms that capital is undergoing a relative rotation, while the rise in TOTAL2 confirms that this rotation is positive and driven by absolute incremental capital, not just Bitcoin's relative weakness in a bear market.
The Four Quadrants: A Clear Strategic Response Model
By combining Bitcoin's price trend with the BTC.D trend, we can map complex market dynamics into four unique stages, each requiring a different strategic response. By identifying which quadrant the market is currently in, traders can make more informed decisions about whether to overweight Bitcoin, altcoins, or stablecoins.
- Quadrant 1 (BTC Price Rising, BTC.D Rising): A Bitcoin-led rally. Capital is flowing into the crypto market, but it is primarily concentrated in Bitcoin. Altcoins may also rise, but they will underperform Bitcoin. Strategy: Increase Bitcoin exposure.
- Quadrant 2 (BTC Price Rising/Stable, BTC.D Falling): The ideal "altcoin season." Bitcoin's price provides a solid foundation for the market, while capital is actively rotating into altcoins, causing them to significantly outperform Bitcoin. Strategy: Increase Altcoins exposure.
- Quadrant 3 (BTC Price Falling, BTC.D Rising): "Risk-off behavior" in a bear market. The entire market is falling, but investors are selling altcoins at a faster rate and moving into the relative safety of Bitcoin. Altcoins will depreciate significantly against both USD and Bitcoin. Strategy: Increase stablecoins/cash Exposure; if you must hold crypto, prefer Bitcoin.
- Quadrant 4 (BTC Price Falling, BTC.D Falling): A catastrophic market crash. Bitcoin is falling, but altcoins are falling even faster. This often happens at the end of an altcoin season when a bubble bursts. Strategy: Exit all risk assets and hold stablecoins/cash.
The table above distills this complex interplay of market forces into a simple, actionable reference tool, helping traders avoid making the wrong asset allocation decisions in the wrong market phase. By combining the use of BTC.D, the TOTAL index family, and this four-quadrant framework, traders can build a multi-dimensional, high-confidence market analysis system to more effectively navigate the ebbs and flows of the crypto world.
Multiple Raven Charts
You can add up to 3 "RedEye Raven" indicators on a single chart to monitor multiple assets simultaneously (requires a TradingView subscription).
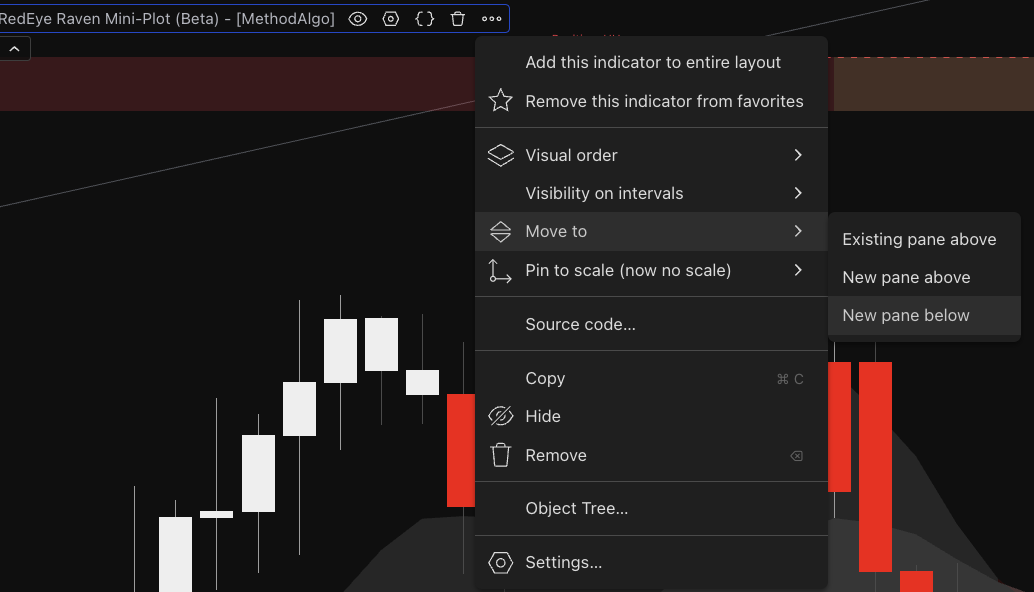
Due to the indicator loading mechanism, newly added Ravens may sometimes not appear immediately. This might be a bug in TradingView. Please follow these steps once to fix it.
-
In the indicator list, click the "..." next to the Raven's name, select "Move to" -> "New pane below".
-
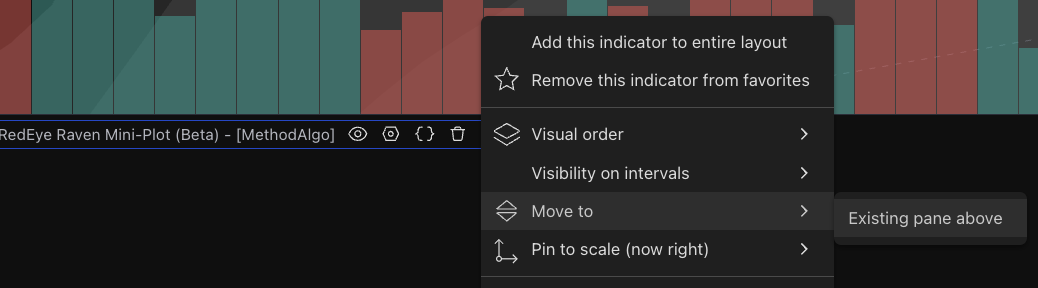
The Raven will now appear in a new pane below the chart. Click "..." again, and select "Move to" -> "Existing pane above".
-
The Raven will now be successfully displayed on the right side of the main chart. This action is only needed when adding a new indicator and will be permanent afterward.
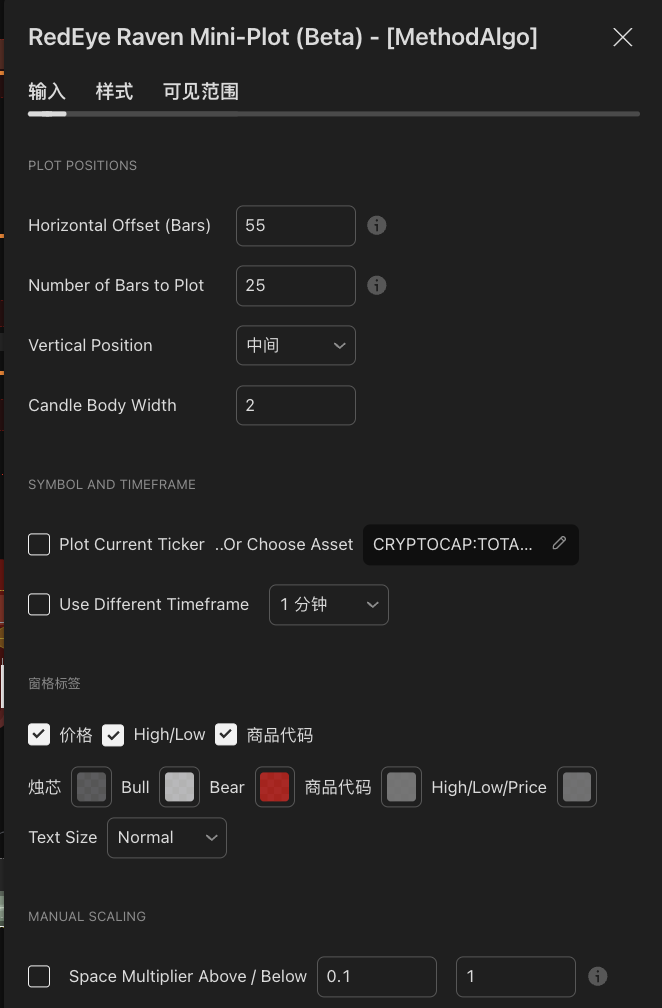
Parameter Settings
-
Plot Positions
- Horizontal offset: The horizontal distance between the mini-chart and the rightmost candle of the main chart.
- Number of bars to plot: The number of candles displayed in the mini-chart.
- Vertical position: The vertical position of the mini-chart.
- Candle body width: The width of the mini-candlesticks.
-
Symbol and Timeframe
- Plot current ticker: If checked, the mini-chart will automatically sync with the main chart's asset.
- Asset picker: Manually select the asset to monitor (only effective when the previous option is unchecked).
- Use different timeframe: If checked, you can set a fixed timeframe for the mini-chart; otherwise, it will sync with the main chart.
- Timeframe picker: Select a fixed timeframe (only effective when the previous option is checked).
-
Labels
- Price: Whether to display the real-time price line.
- High/Low: Whether to display the highest/lowest price in the range.
- Symbol: Whether to display the asset ticker and information.
-
Manual Scaling
- Switch: If checked, you can manually adjust the vertical scaling of the mini-chart. -** Space multiplier above**: Zoom in/out upwards.
- Space multiplier below: Zoom in/out downwards.
Solution Comparison
Whenever cross-asset analysis is involved, traders almost always need to observe multiple charts. Here is a comparison of workstation layouts:
| Name | Method | Syncs with main chart’s timeframe & asset | Extra assets observable | Requires TV membership | Advantages | Disadvantages |
|---|---|---|---|---|---|---|
| Redeye Raven | Indicator tool | Yes | 3 | Yes | Clean; can be combined with layout split-screen for more charts; customizable candle count | None |
| Layout Split-Screen | TradingView’s layout function to split screen into multiple charts | Yes | Up to 16 (typically 3, as more fills the screen) | Yes | Professional and powerful | Takes up significant screen space; not suitable for small screens |
| Overlay Chart | TradingView’s overlay chart function | No | 1 | No | Free | Chart becomes messy; only supports line charts; poor readability |
| Multiple Physical Screens | Multiple monitors connected together | Yes | Depends on number of screens | Yes | Intuitive, no switching needed | Expensive, not portable, no automatic sync |
Frequently Asked Questions (FAQ)
Q1: Why doesn't anything show up on the chart after I add the indicator?
A: This is a known issue with TradingView. Please follow the steps in the Fix: Raven Not Displaying section of the documentation to resolve it.
Q2: Can this indicator only be used for cryptocurrencies?
A: No. It can be used for any asset supported on the TradingView platform, including stocks, forex, indices, precious metals, etc.
Q3: How many Raven mini-charts can I add at most?
A: You can add up to 3. If you have chart layouts enabled, you can add 3 to each chart. Please note that loading more than one indicator on the same chart requires a paid TradingView subscription plan.
Q4: Does RedEye Raven provide specific buy/sell signals?
A: No. It is purely a chart assistance and cross-analysis tool designed to provide you with more dimensions for analysis. It does not have any predictive algorithms or trading signals. You need to use it in conjunction with your own trading strategy.
The engineers at MethodAlgo are proud of their work, but it's essential for you to understand that no indicator / algorithm can guarantee perfect success. Trading profits and losses are greatly influenced by the trader's psychology, knowledge, experience, and risk management.
The algorithmic interfaces we provide are all part of T.A.T.A. When trading in reality, traders should make their decision like T.A.T.A, considering various factors and signals from other tools to establish confluence system.
Any unclear explanations or errors in this tutorial? Please contact MethodAlgo's @Staff on the Discord Trading Terminal for corrections.