Volume Profile
Concept
Volume Profile is an incredibly technical analysis tool widely used by traders globally. Volume Profile data is indisputable. This tool allows traders to discover new opportunities and provides an intuitive perspective on market behavior.
The Volume Profile indicator displays the distribution of trading volume at different price levels over a fixed time range. With this, traders can understand the volume within specific price ranges, analyze the speed of price movement, and identify potential support and resistance levels. The Volume Profile reveals the price ranges that the market favors and those it overlooks, providing traders with clues about the recent price trends.
The primary task when using the Volume Profile is to identify support and resistance levels. Unlike leading indicators like the Stop Hunt tool and Fibonacci tool, which predict future trends based on price action, the Volume Profile is a lagging indicator. It assigns support and resistance biases to price levels already touched by the market based on historical price and volume data.
MethodAlgo's Volume Profile is consistent with the indicators used by institutions, but it has been optimized visually to be more compact and refined. We’ve reduced visual clutter and enhanced a traditional weakness of the Volume Profile— the buy/sell Delta data.
You Can Use It For
- Identifying resistance and support
- Analyzing speed of price movement
- Providing an alternative perspective on market trends
- Identifying buying and selling opportunities
Interface
The PowerRanger Volume Profile interface has been optimized to highlight its strengths. Below is a detailed introduction to each part:
Volume Nodes- HVN (Long Nodes): Represent high trading volume at that price level.
- LVN (Short Nodes): Represent low trading volume at that price level.
- Displayed in gray.
Point of Control (POC)- Location: The price level with the highest trading volume and also the longest HVN node within the selected time range.
- Length: Extends from the start of the time period, indicating the range of the current distribution.
- The POC represents a fair and reasonable price level within the current range, where most traders are likely to trade. It can serve as support/resistance.
- Displayed in semi-transparent white.
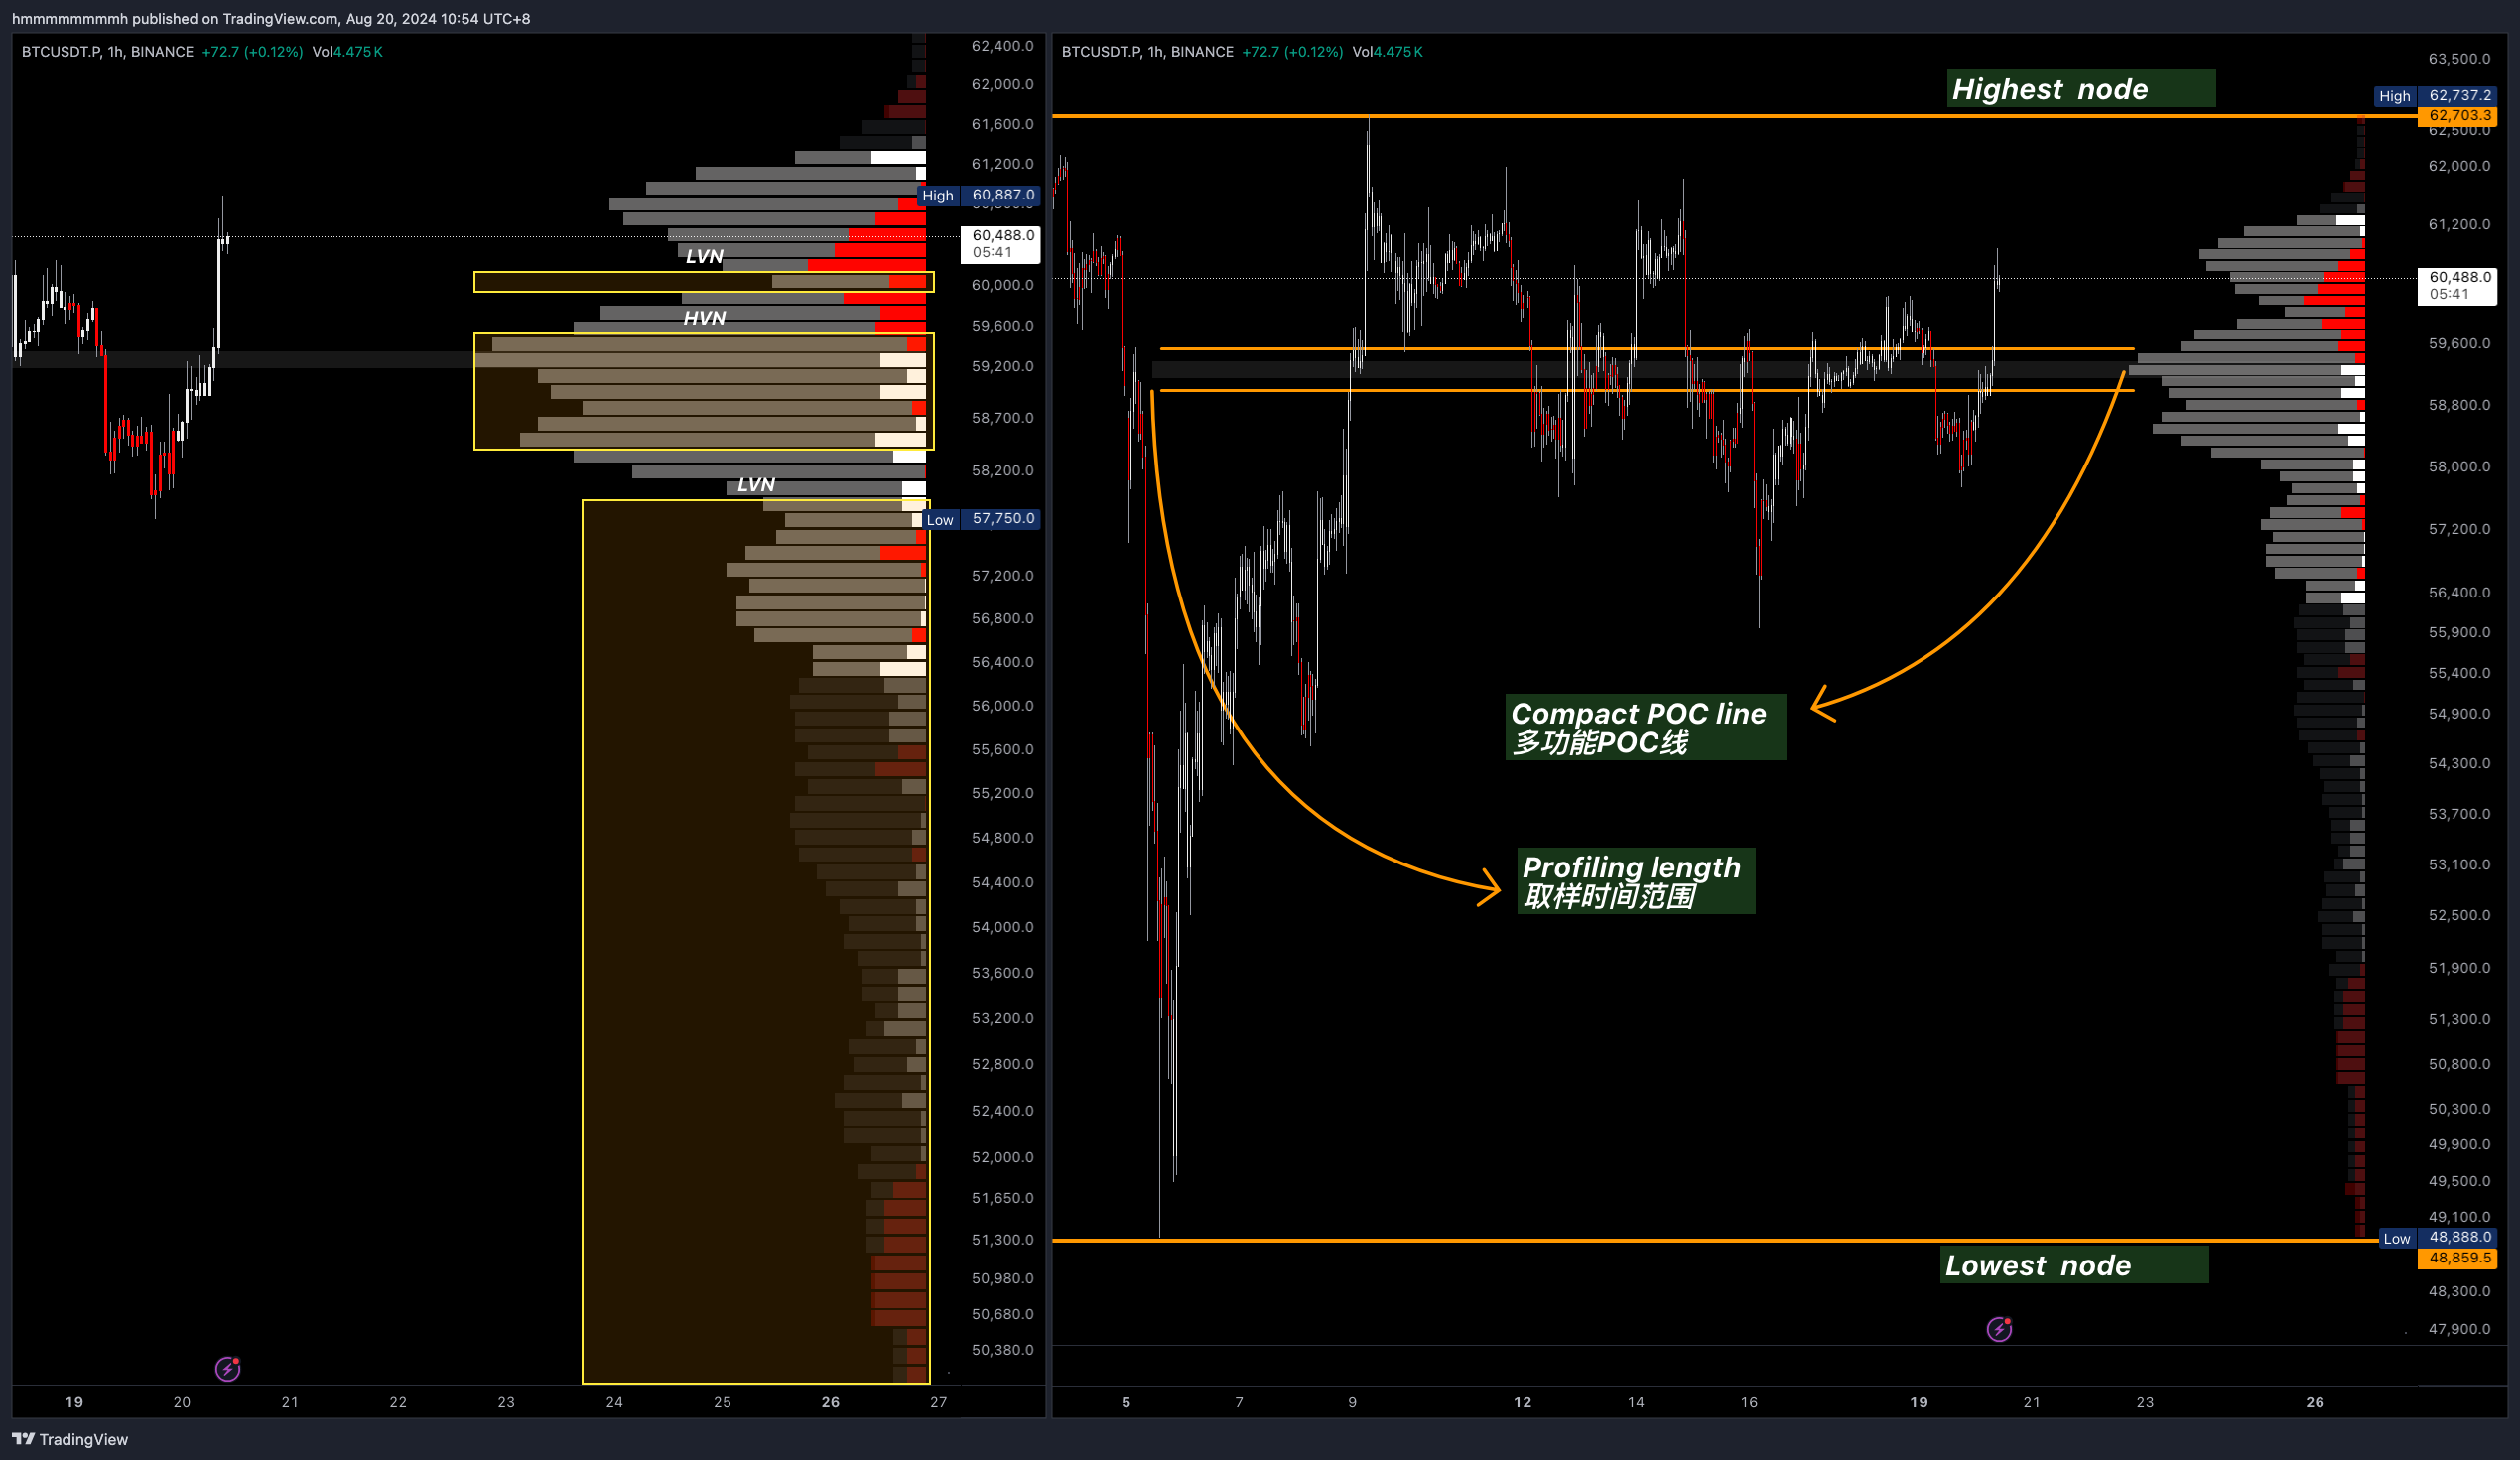 Left: Volume Nodes, Right: POC Line
-
Value Area (VA)- The highlighted area.
- Contains 70% of the total trading volume from the range.
-
Value Area High (VAH)and High-Price Area- VAH is the highest price level of the VA.
- The area above VAH is the high-price area (dark area).
-
Value Area Low (VAL)and Low-Price Area- VAL is the lowest price level of the VA.
- The area below VAL is the low-price area (dark area).
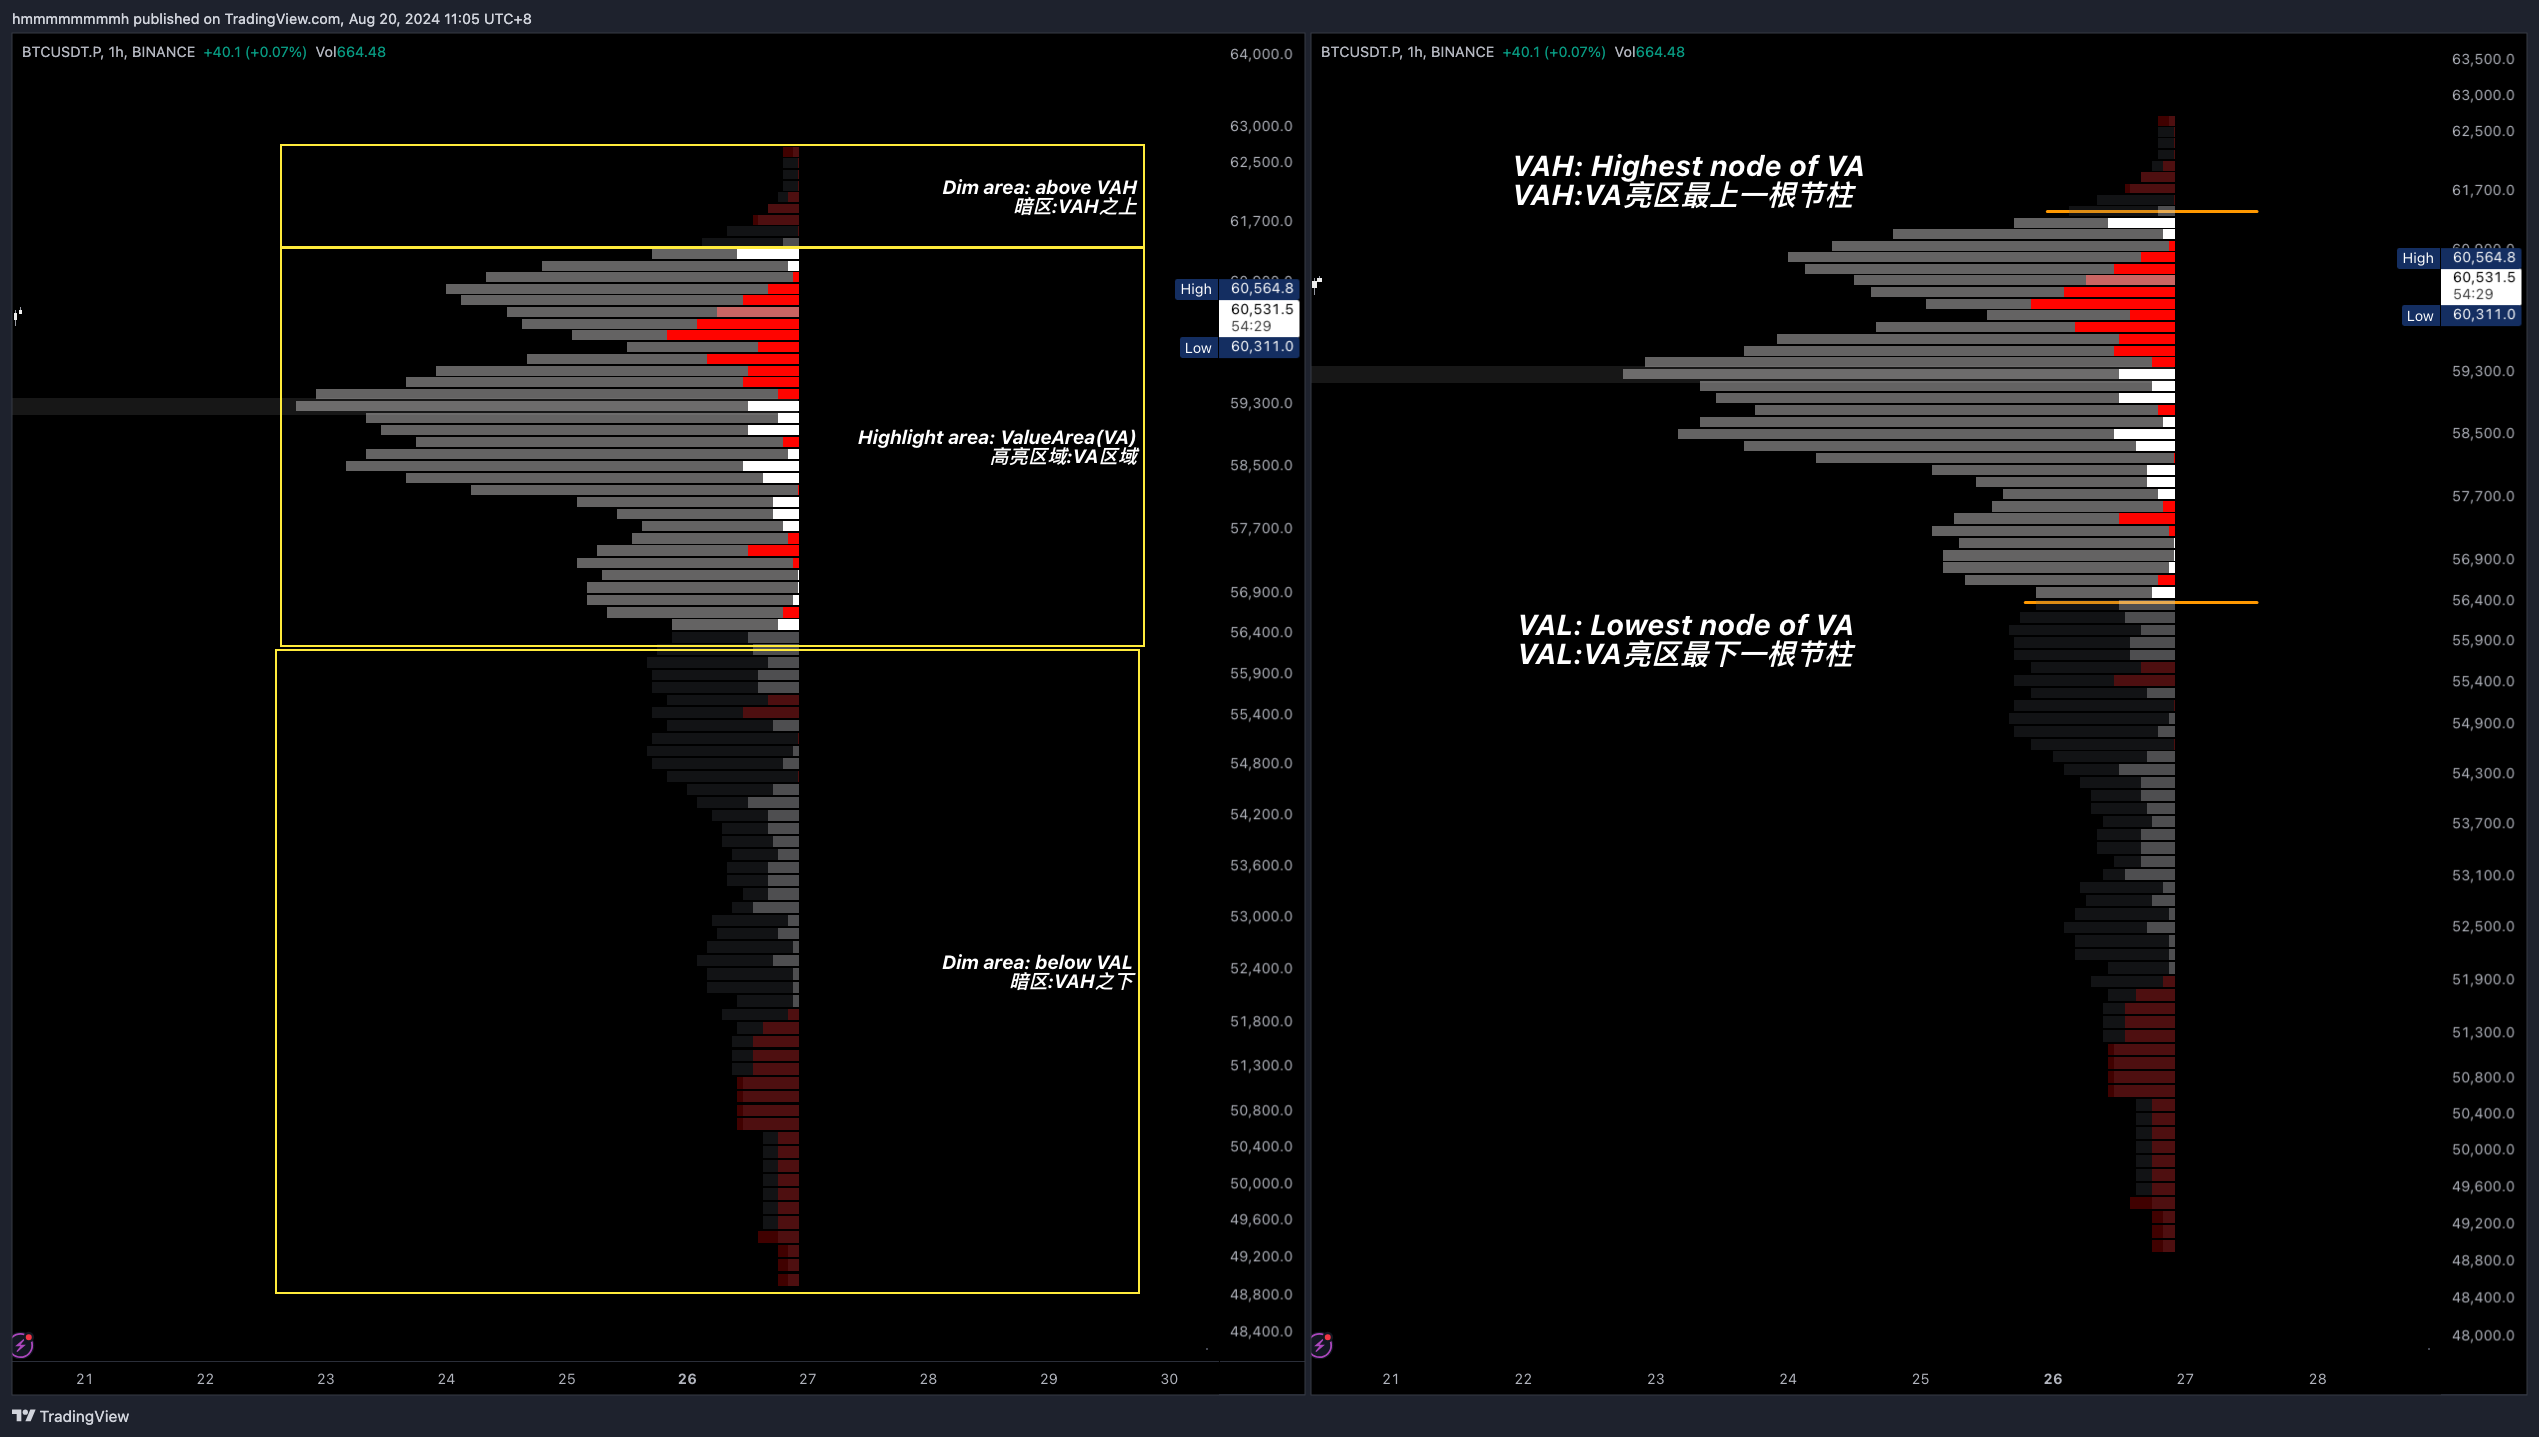 Left: Value Area, High-Price Area, Low-Price Area. Right: VAH and VAL
Internal Nodes (Delta Volume)- The net difference in volume between buyers and sellers.
- Red for sellers, white for buyers.
- The length of the color bars represents the relative proportion, with a longer bar indicating higher volume for one side, and a shorter bar indicating relatively equal buy/sell volume within the node.
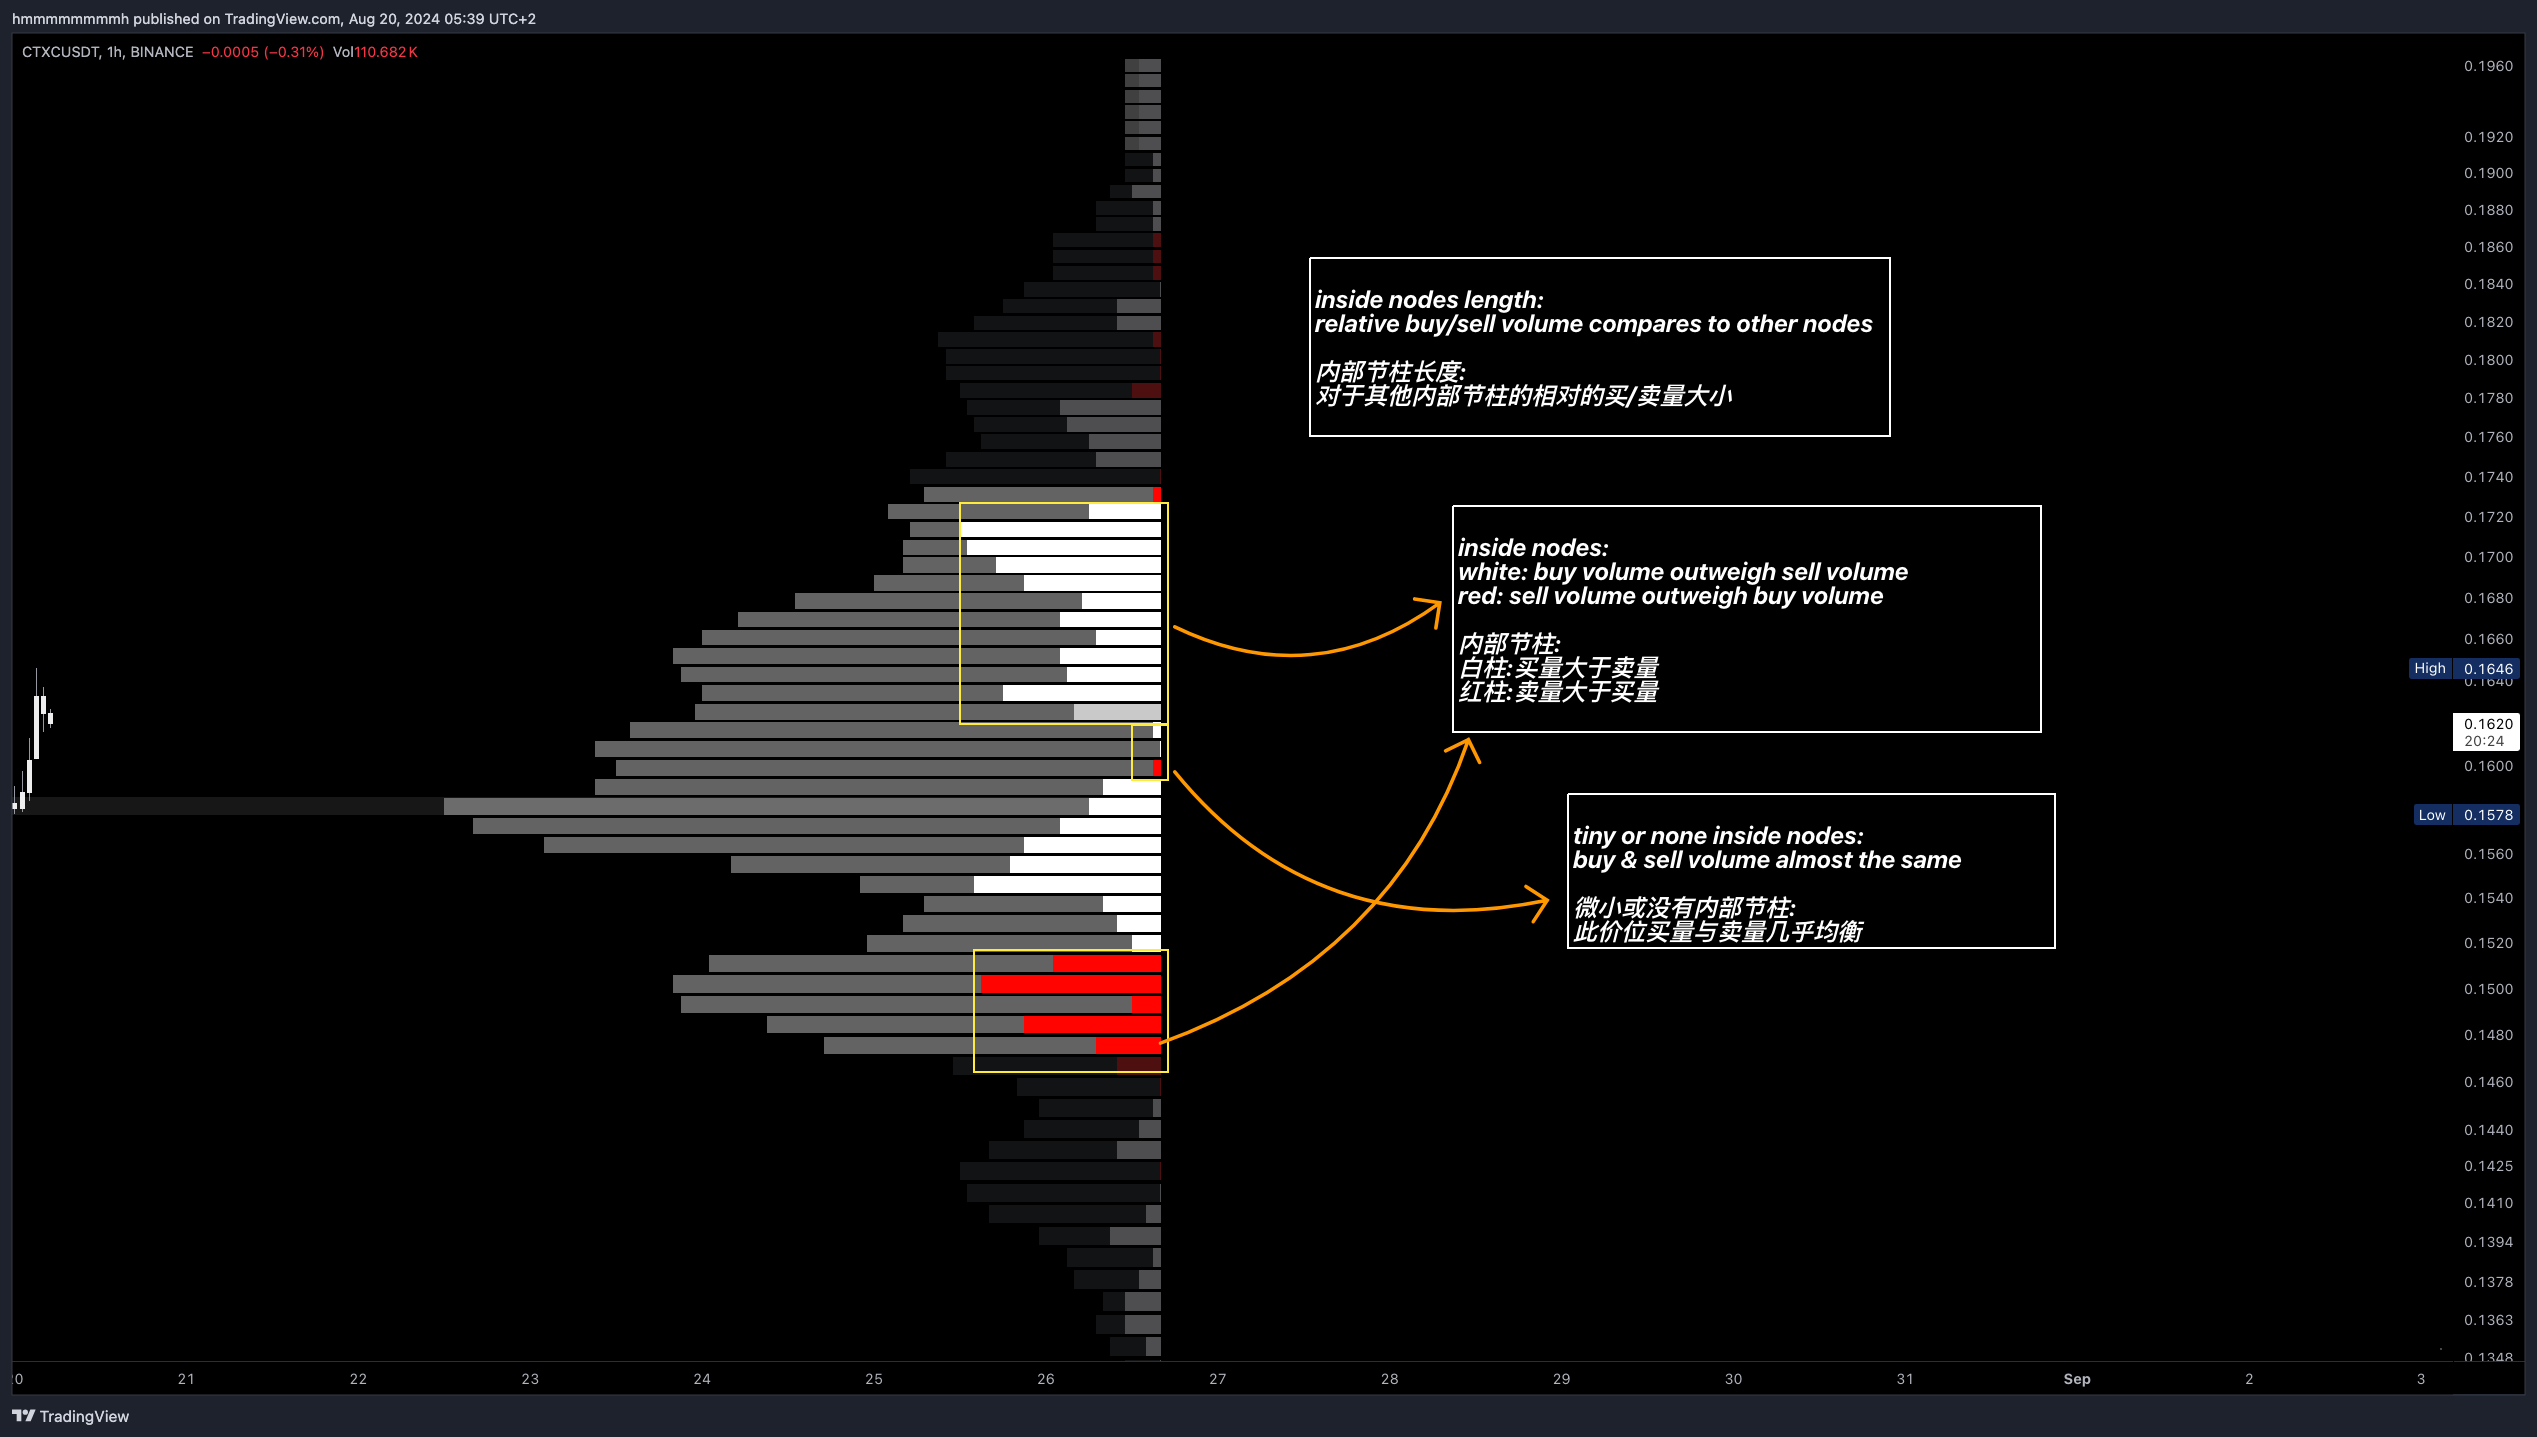 In the chart of
 CTXCUSDT, the trading volume at the 0.17 level is mostly buying volume, while at 0.16 the buying and selling are balanced, and from 0.16 to 0.15, the volume is mostly strong buying. At the 0.14 level, it is mostly selling volume. Below 0.14, although the volume is low, it is mostly buying, indicating that the market tends to chase the price when it rises, but sells off when it declines, accumulating at lower prices. This is a typical example of short-term trading.
Identification
Each time a candle is updated, the Volume Profile data (POC, VA, HVN, LVN, etc.) is also updated in real time. These data reflect changes in market participants' interests, providing traders with new trading opportunities.
Identifying Key Price Areas
Preferred Prices: Large HVNs within the VA indicate price levels with concentrated trading volume, reflecting the most popular price levels in the market. These areas have strong gravitational pull, as 70% of trading tends to occur within this area, making prices likely to be attracted to these levels regardless of whether they rise or fall.Ignored Prices: Low-volume nodes indicate price levels ignored by the market. Prices typically do not stay long at these levels, and after breaking through, they are likely to return to other key areas.
Quick Moves in Low-Volume Areas
When the price enters a low-volume area but fails to accumulate significant volume, it usually quickly returns to an area with higher volume. This is because both the market and market makers prefer high-volume areas.
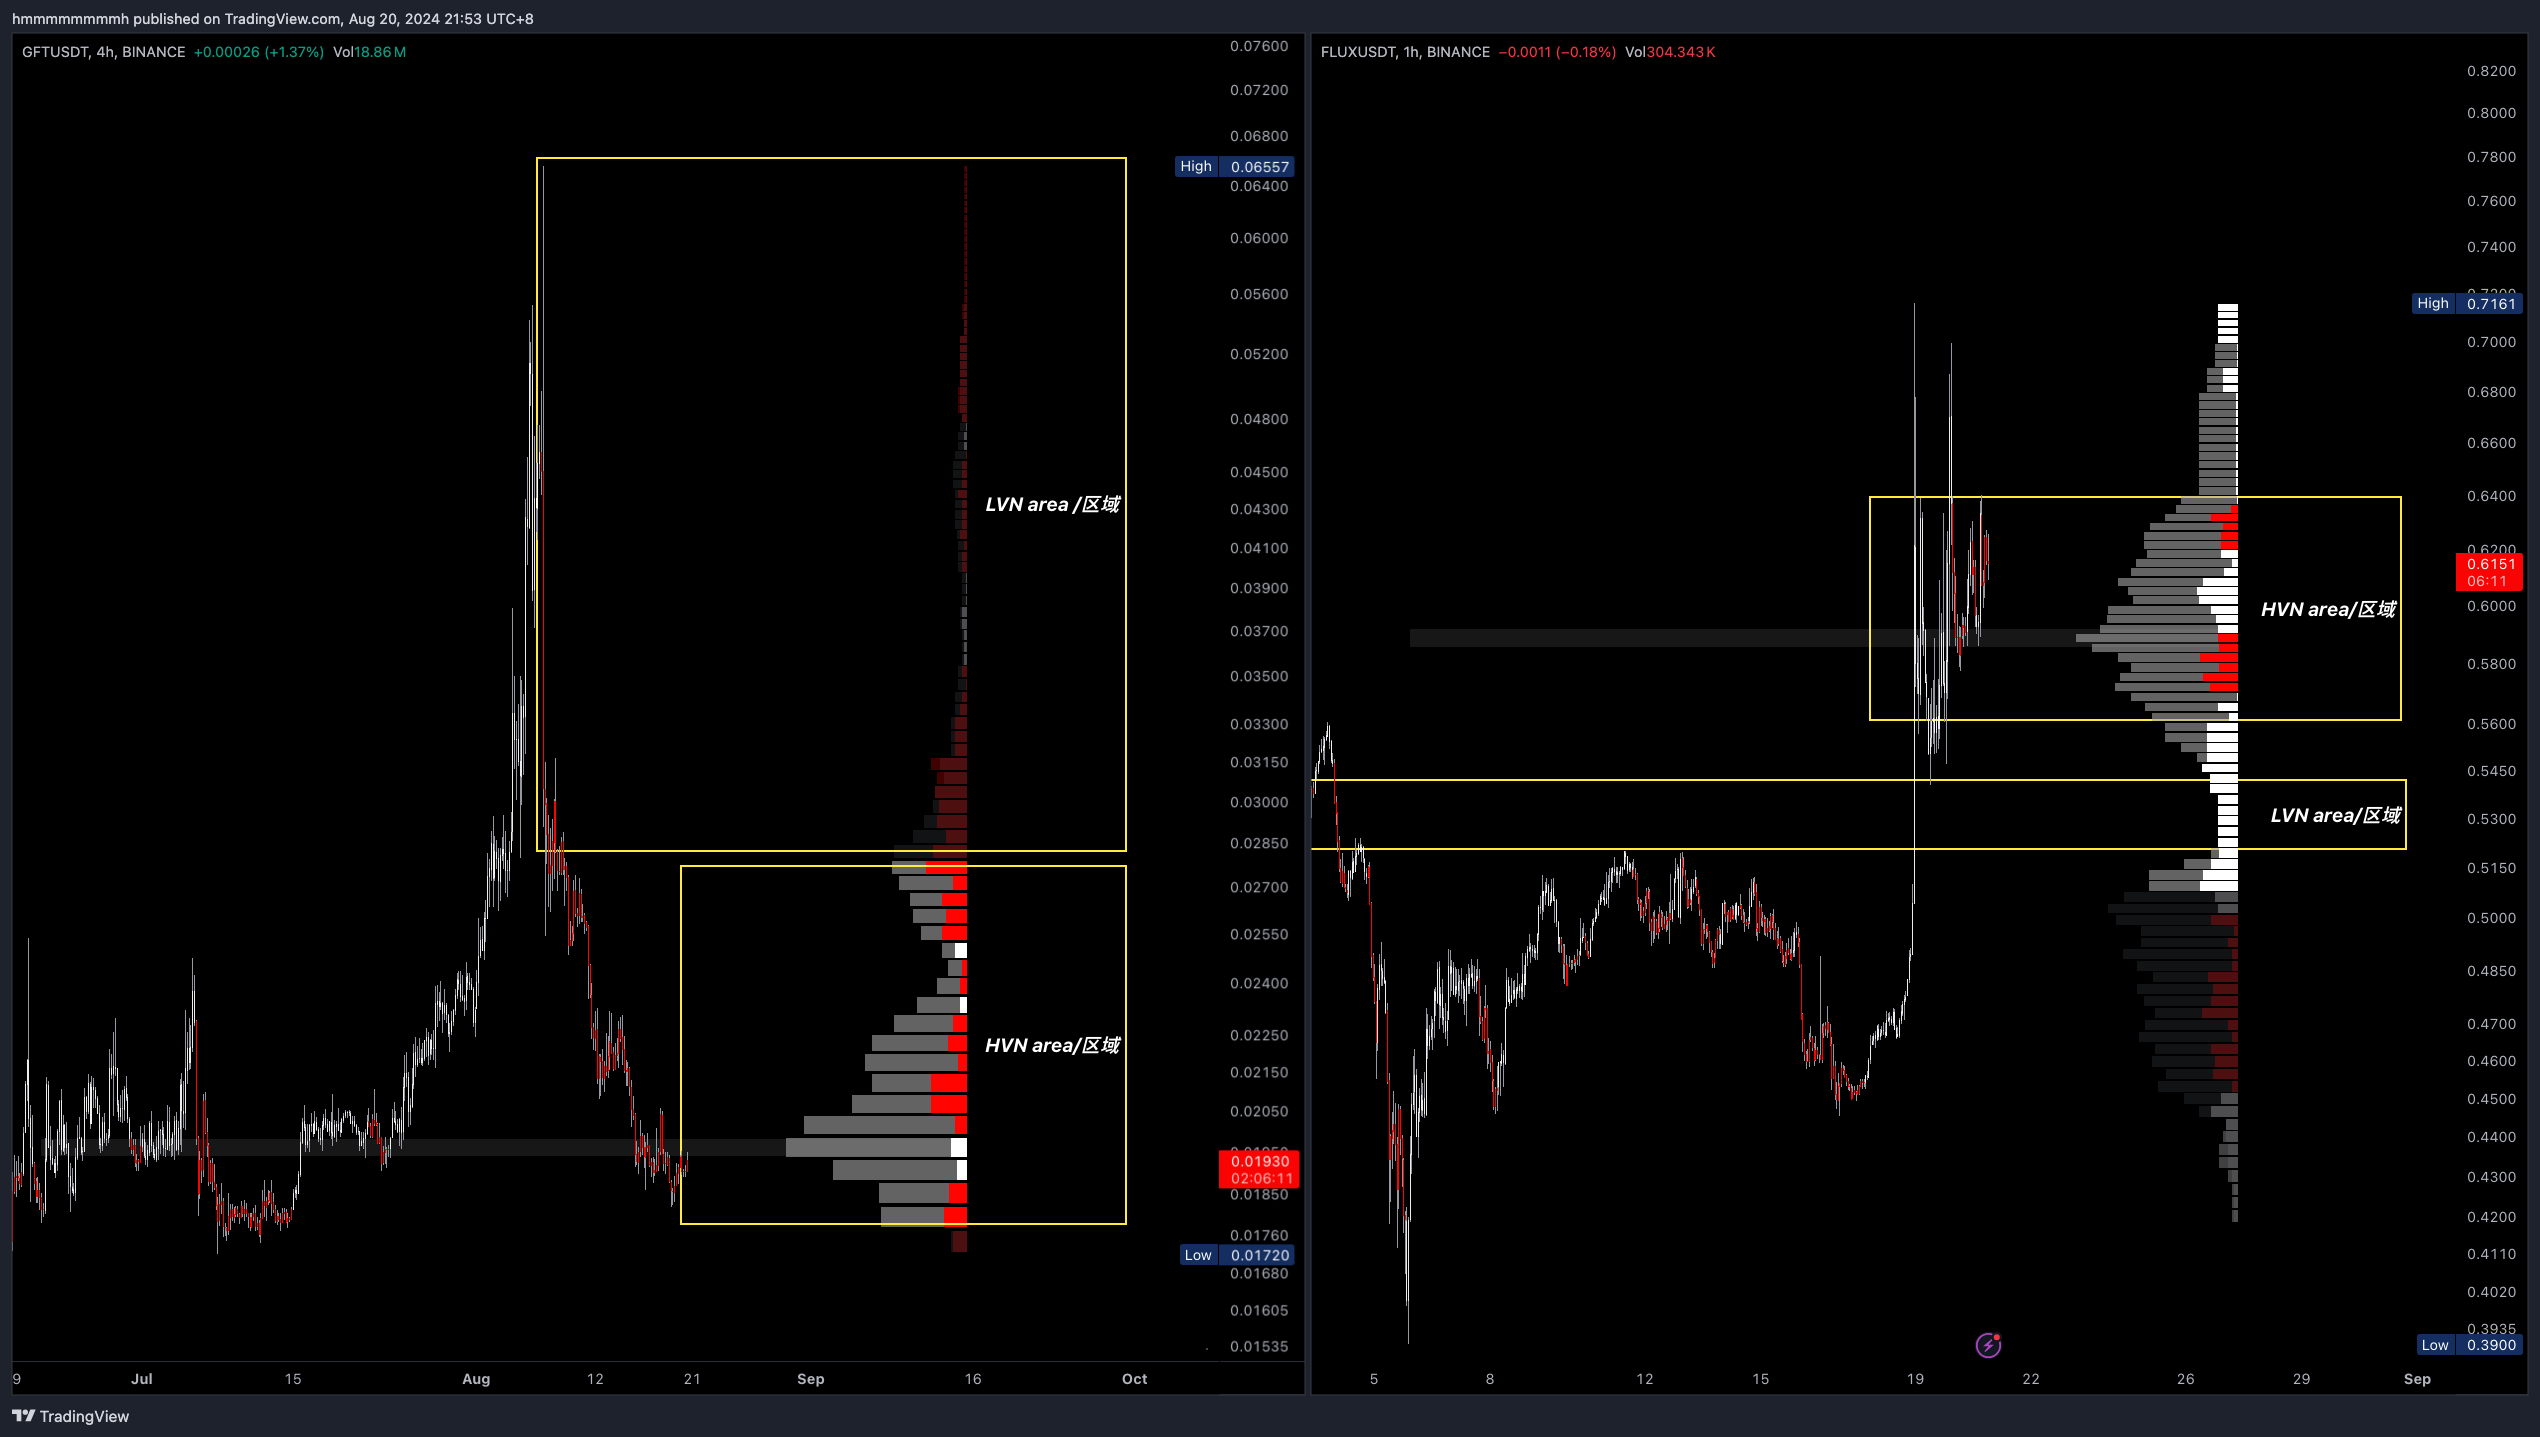 Example: Left:
 GFTUSDT fails to accumulate sufficient volume after breaking through the LVN and returns to the VA POC. Right: FLUXUSDT accumulates new volume after breaking through the LVN, forming a new VA and POC, predicting that it will not return to the low level like GFT.
Support and Resistance
Support refers to a price level that prevents prices from falling further, while resistance is a price level that prevents prices from rising. When prices fall back to support, long traders typically start buying, while short traders usually close their positions (short covering involves buying) to lock in profits. Traders tend to congregate at these support and resistance levels, and the trading volume at these levels reinforces the accumulation of support and resistance in the Volume Profile indicator.
-
Internal Node Support and Resistance:
- High buying volume internal nodes near undervalued areas act as support.
- High selling volume internal nodes near overvalued areas act as resistance.
-
Value Area and Point of Control (POC): When prices are above the VA and POC, the POC acts as support; when below, it acts as resistance.
-
High-Volume Nodes (HVN Clusters): High-volume areas usually mark key support and resistance levels.
-
Confirmation Signals: In the Volume Profile chart, price levels like
POC,VAL,VAH,HVN, etc., are reliable references for support and resistance. When price fluctuations align with these key levels, they can be considered confirmation signals.
Strategy
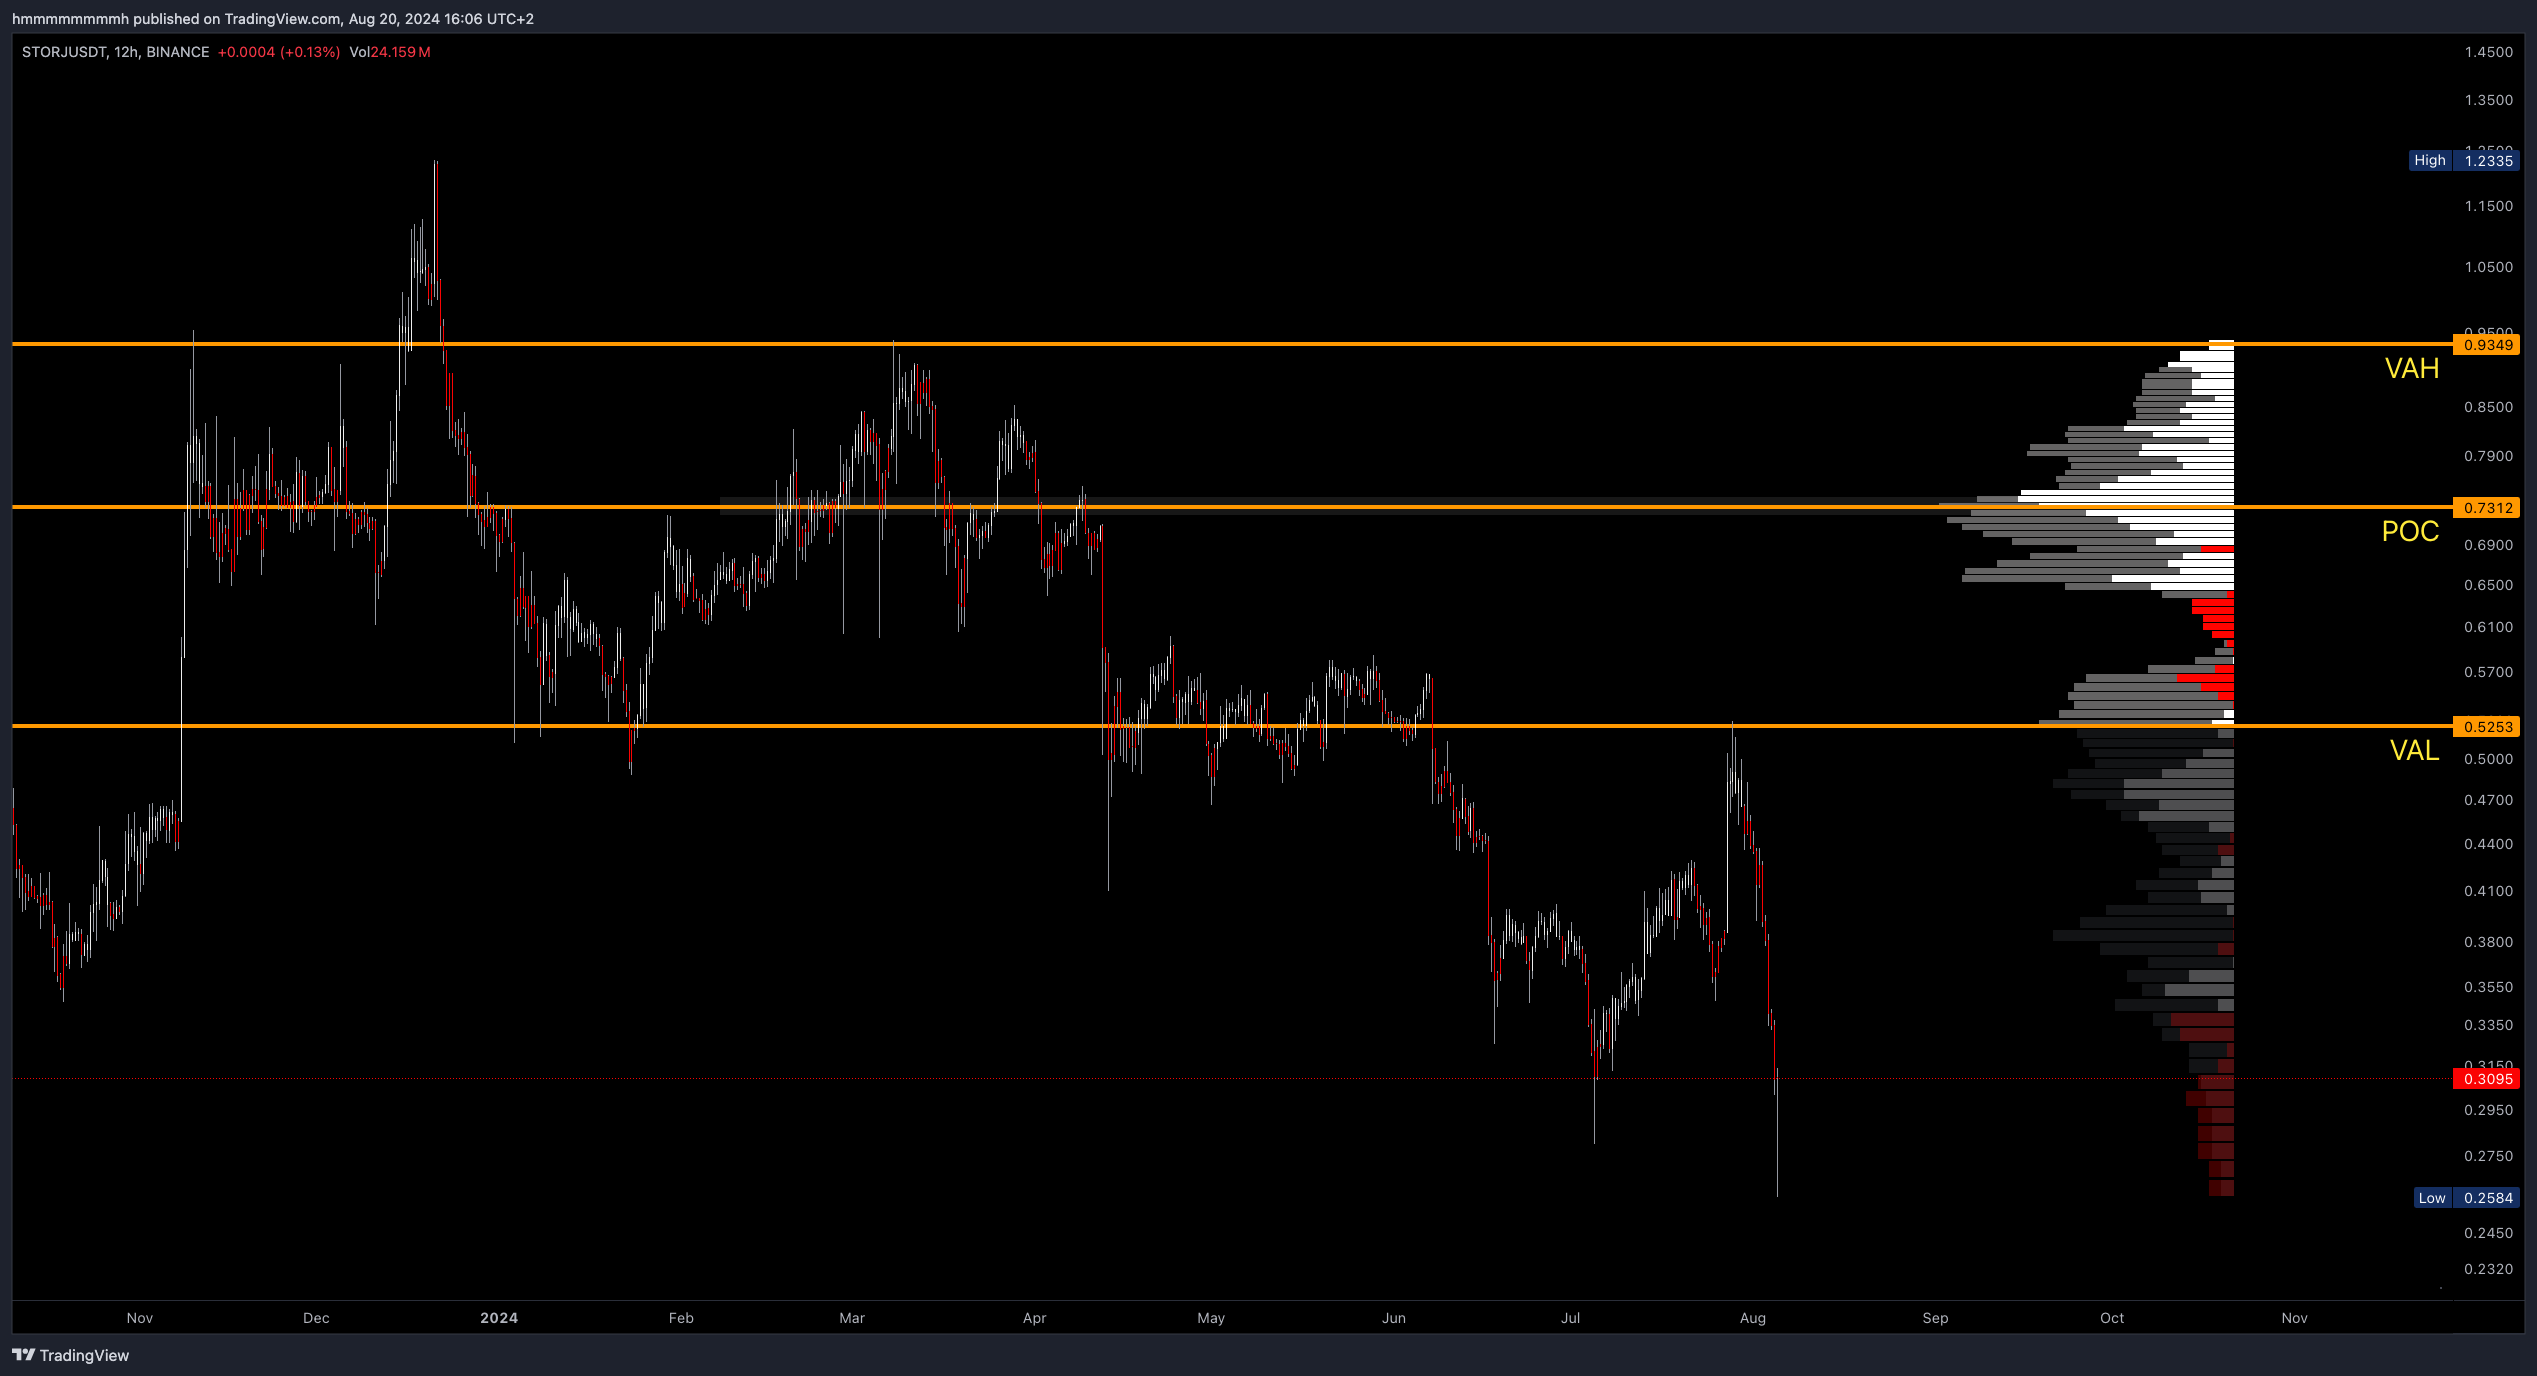
VA and POC Strategy
The Volume Profile is dynamic, and by subjectively observing the position of price, POC, and the VA, traders can predict potential future trends. Since the VA and POC represent high-volume areas, if the current price is outside these areas, there may be trading opportunities that aim the price to return these price levels/areas.
LVN No Volume Strategy
Low volume during a decline or rise is an ideal entry opportunity. The GFTUSDT example in our Quick Moves in Low-Volume Areas section perfectly demonstrates this strategy. Since the volume does not support the continued rise or fall in price, and subsequent moves do not accumulate new trading volume in the new LVN area, the price usually ends up returning to the HVN, VA, or POC area.
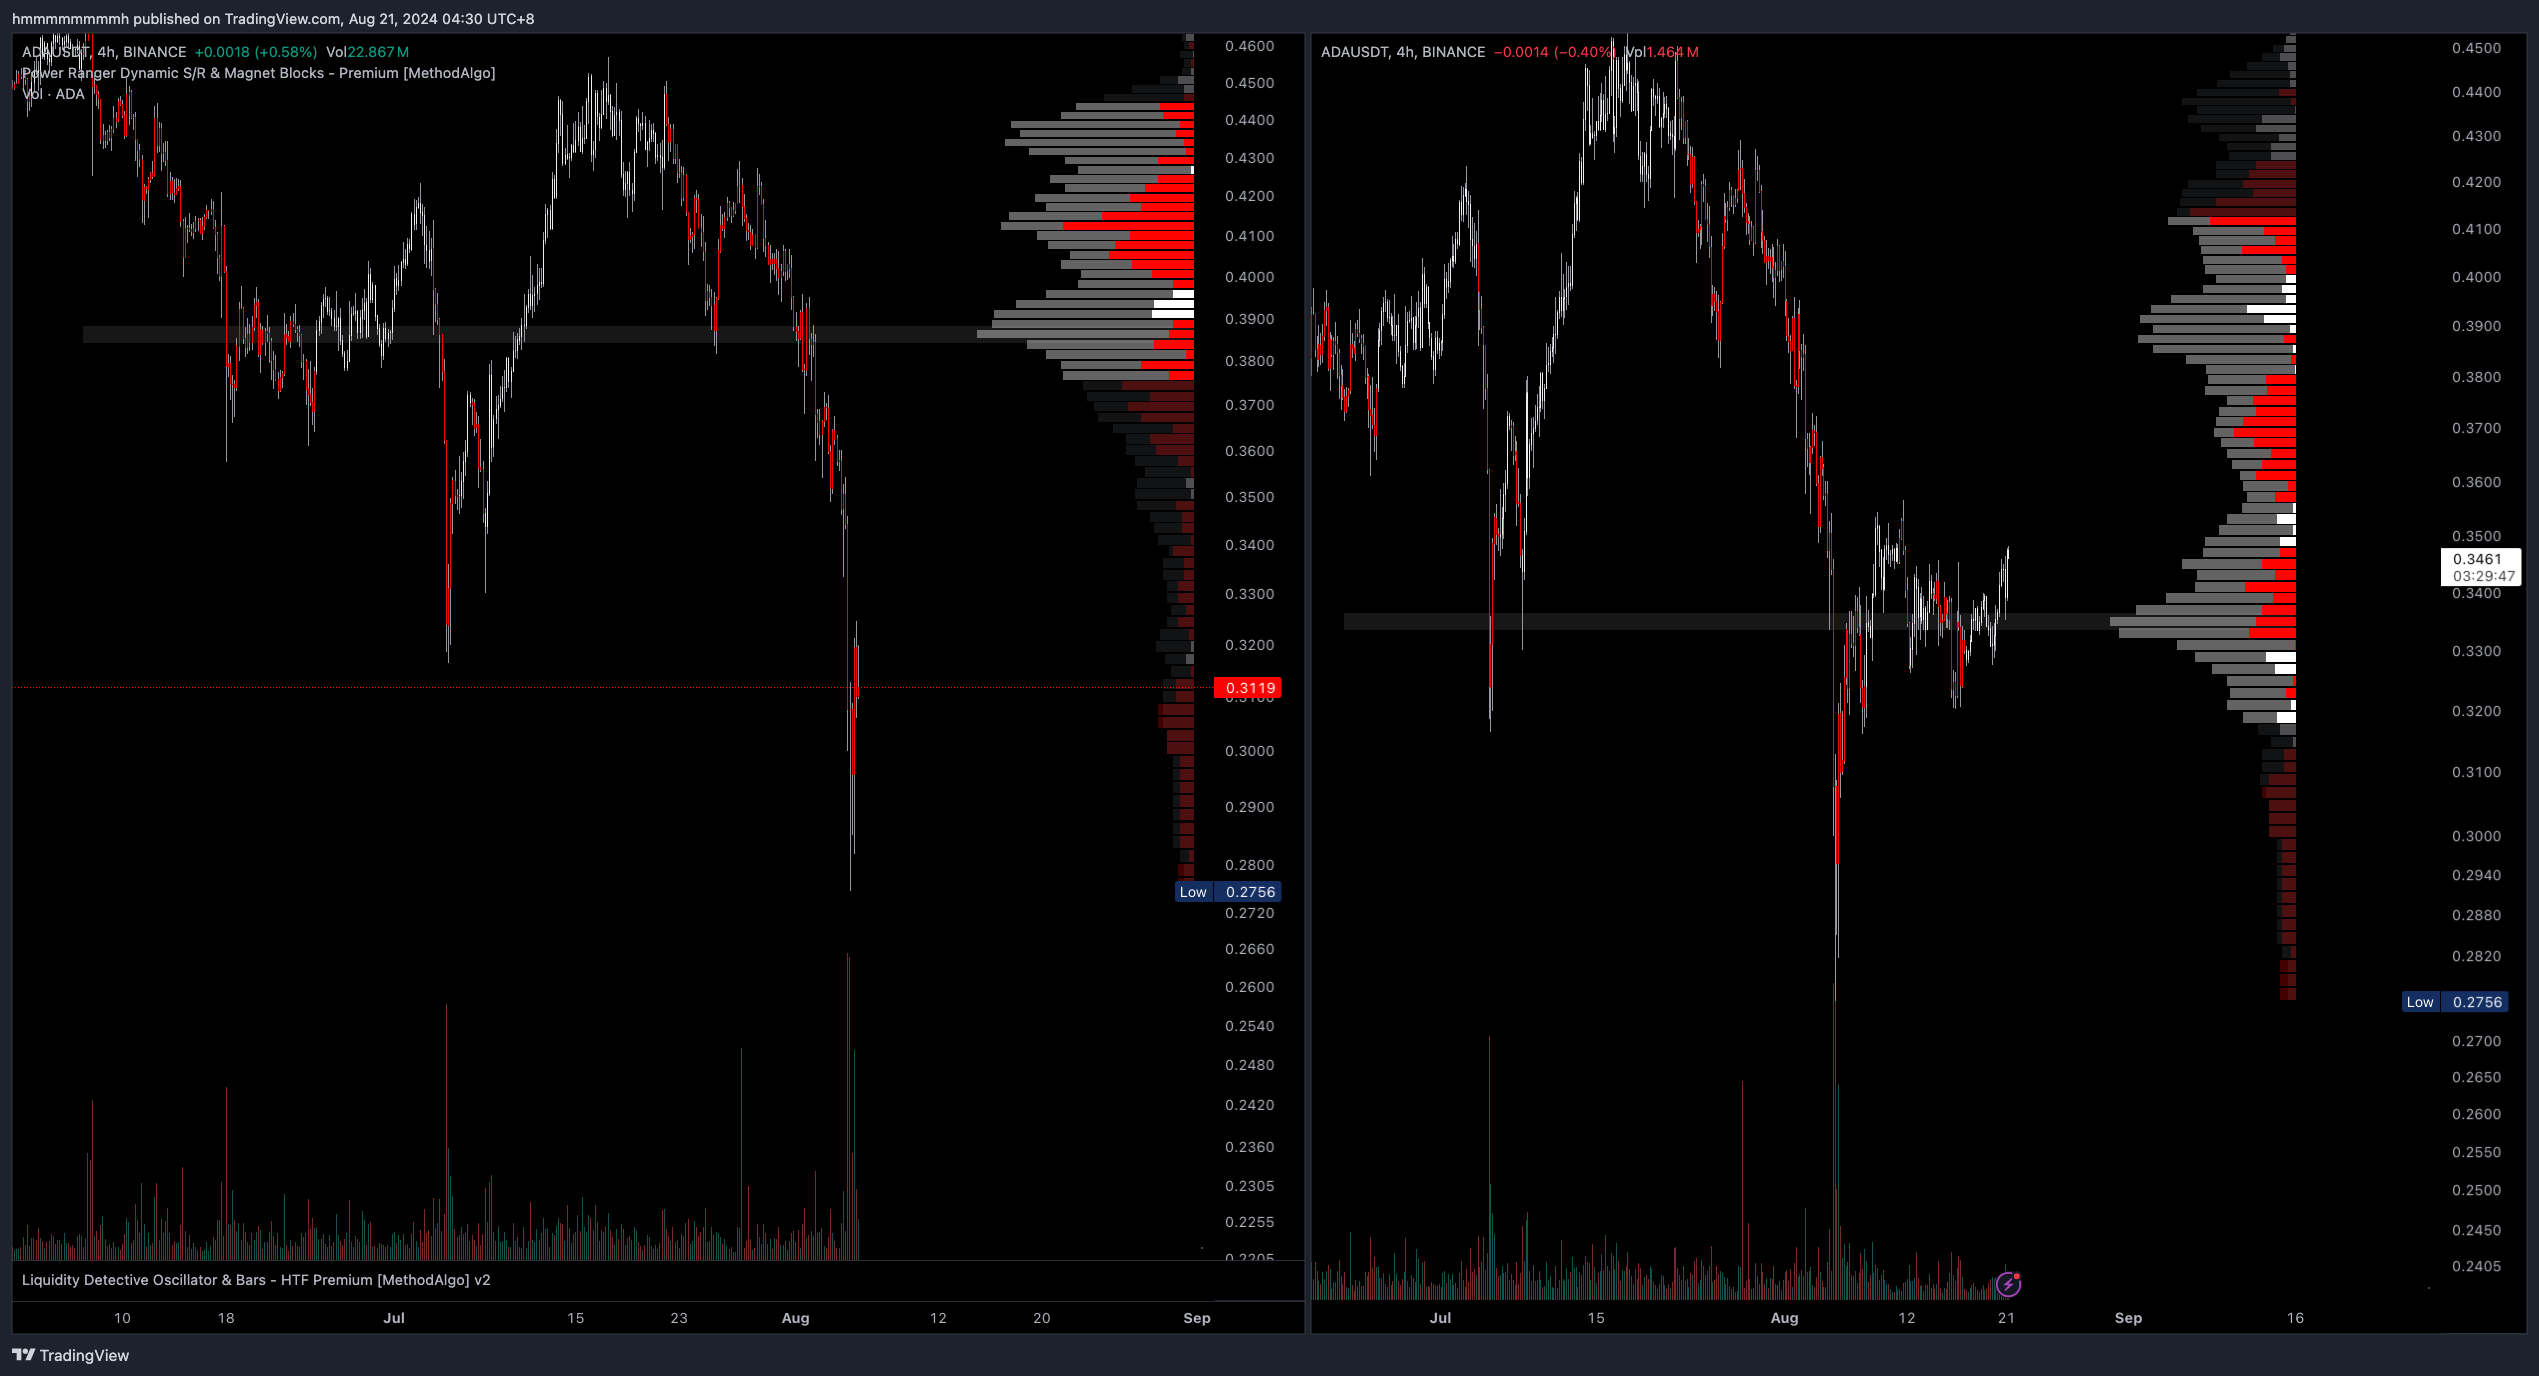
The chart below explains another variation of the LVN strategy, using the example of FLUXUSDT from the Quick Moves in Low-Volume Areas section.
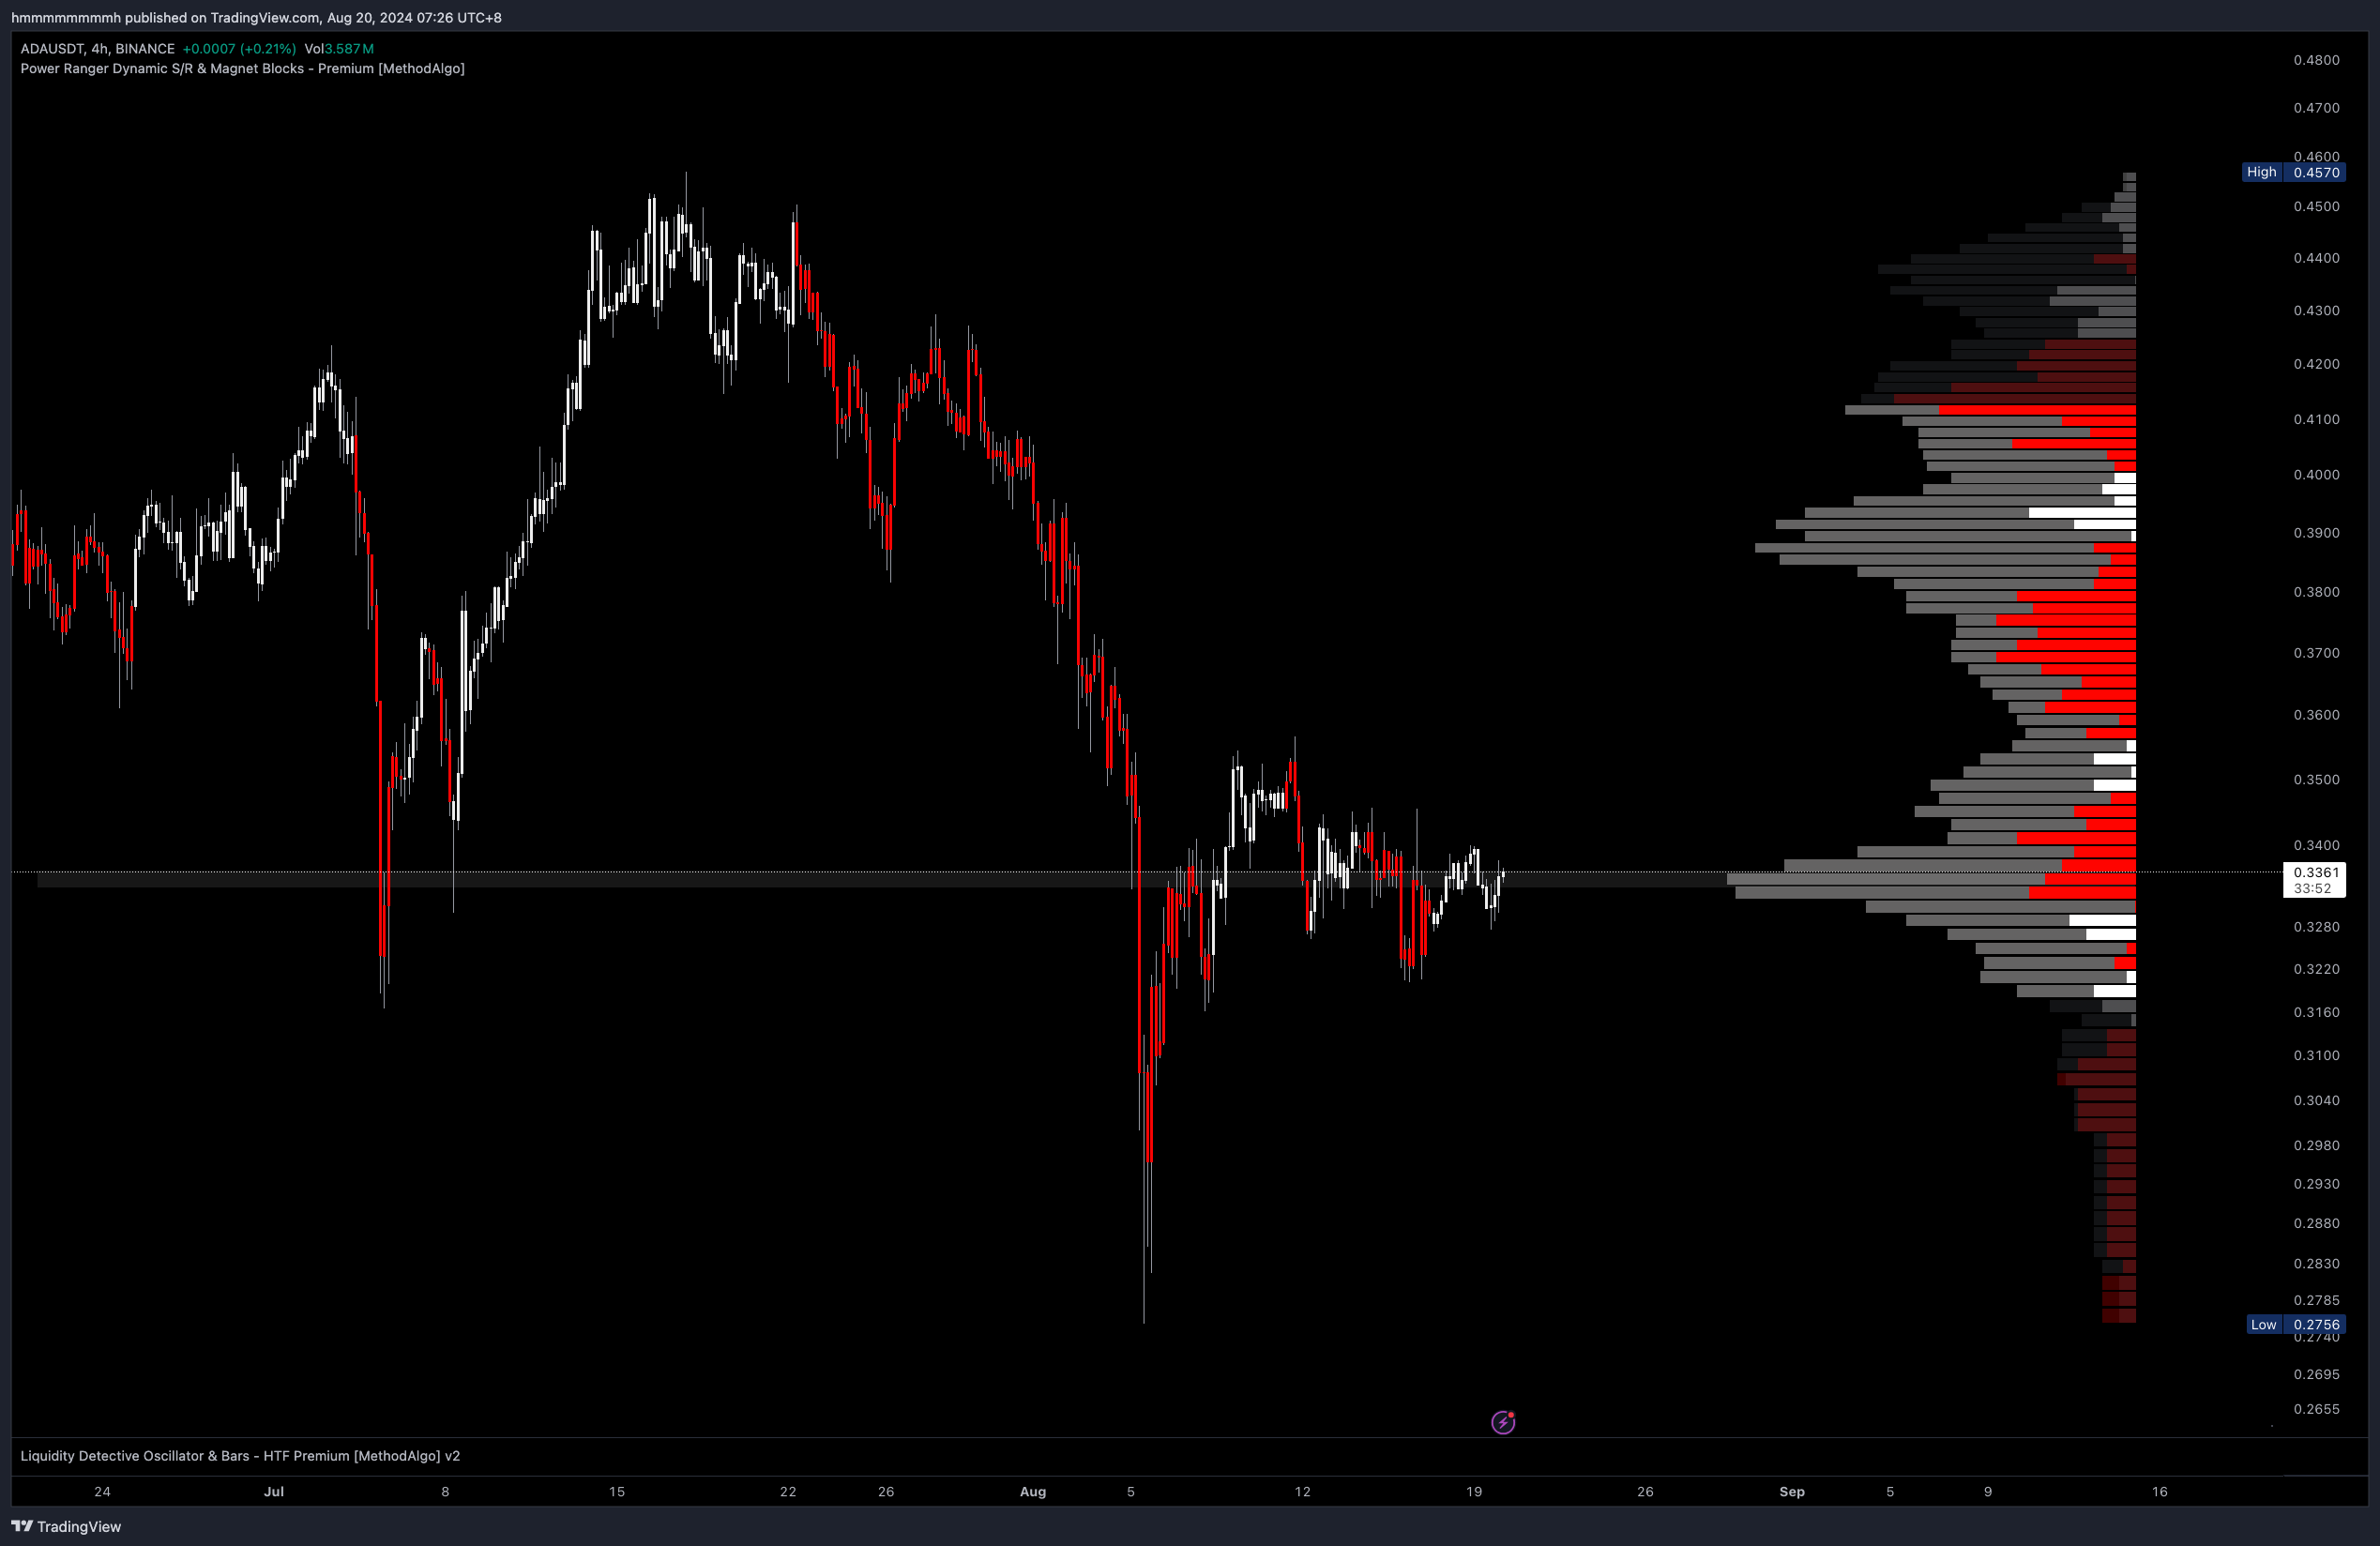
In the chart of ADAUSDT, the left side shows a capitulation candle, and the right side shows the subsequent price movement after capitulation:
- The price drops rapidly in the LVN area with low volume, and it is expected to return to the POC.
- After a pullback, the price consolidates to create a new VA and POC, forming a bear flag pattern, indicating that the price will likely continue to fall.
Retest Strategy
As described in Support and Resistance, the POC, VAH, VAL, and HVN are all reference points for support and resistance. When the price pulls back to these levels and gets rejected, it signals a potential trade entry, especially when pulling back to the POC.
The POC is the area with the highest trading volume, where both bulls and bears have accumulated significant positions. By analyzing the internal nodes, one can assess the strength of buying and selling at this level. When the price pulls back to the POC, previous buyers may intensify their buying efforts, driving the price away from this area to continue trapping the bears, and vice versa.
Parameter Settings
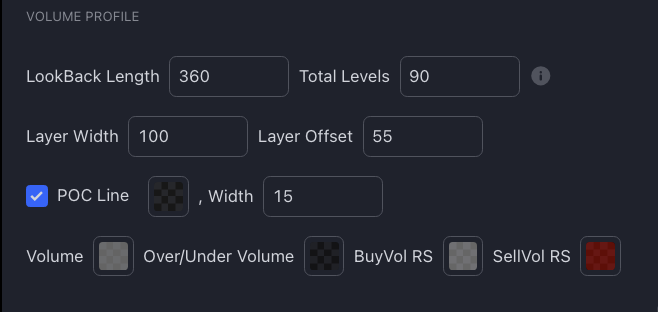
- Lookback Range: The number of candles length for profiling, default is 360 candles. can be adjusted based on your needs and the time frame you are operating in.
- Total Levels: The total number of volume nodes, default is 100. The larger the number, the finer the detail and the slower the calculation; the smaller the number, the larger the price range covered by each node and the faster the calculation.
- Layer Width: The maximum width of the indicator.
- Layer Offset: The distance of the indicator from the last candle.
- POC line / Color / Width: Options to toggle the POC line, adjust its color, and its width.
Default Profiling Range
The default Lookback range is set to 360 candles. This corresponds to the following Profiling ranges for different time frames:
| Time Frame | Approximate Analysis Range |
|---|---|
| 3D | About 3 years |
| 1D | About 1 year |
| 4H | 60 days |
| 1H | 15 days (about 2 weeks) |
| 30m | 5 days |
| 15m | About 4 days |
| 10m | 60 hours |
| 5m | 30 hours (about 1.25 days) |
The fixed-range approach has an advantage over TV’s VPVR, which adjusts the range based on the visible screen area. By using a fixed variable, the data remains consistent when zooming in and out of the chart, ensuring uniform analysis. You can manually recalculate and adjust this parameter as needed.
Remarks
- The POC will change over time as new trading volumes accumulate, so what you see is an analysis result based on a fixed range period from last bar to the length of your choice in the parameter "lookback range" setting. The choice of range depends on your trading goals — whether you prefer long-term or short-term trades.
- The Volume Profile is a factual indicator, a tool that displays horizontal trading volume data. Using it in combination with other tools from PowerRanger can lead to more accurate biases. For more strategies involving the Volume Profile, you can search online.
- It is recommended to use the support and resistance levels identified by the Volume Profile as an auxiliary bias since it provides a range rather than precise pinpoint levels. For more accurate pinpoint-level take-profit and stop-loss levels, consider using the Grim Reaper Indicator or Fibonacci.
The engineers at MethodAlgo are proud of their work, but it's essential for you to understand that no indicator / algorithm can guarantee perfect success. Trading profits and losses are greatly influenced by the trader's psychology, knowledge, experience, and risk management.
The algorithmic interfaces we provide are all part of T.A.T.A. When trading in reality, traders should make their decision like T.A.T.A, considering various factors and signals from other tools to establish confluence system.
Any unclear explanations or errors in this tutorial? Please contact MethodAlgo's @Staff on the Discord Trading Terminal for corrections.