Swing & Fibonacci
Concept
Swing
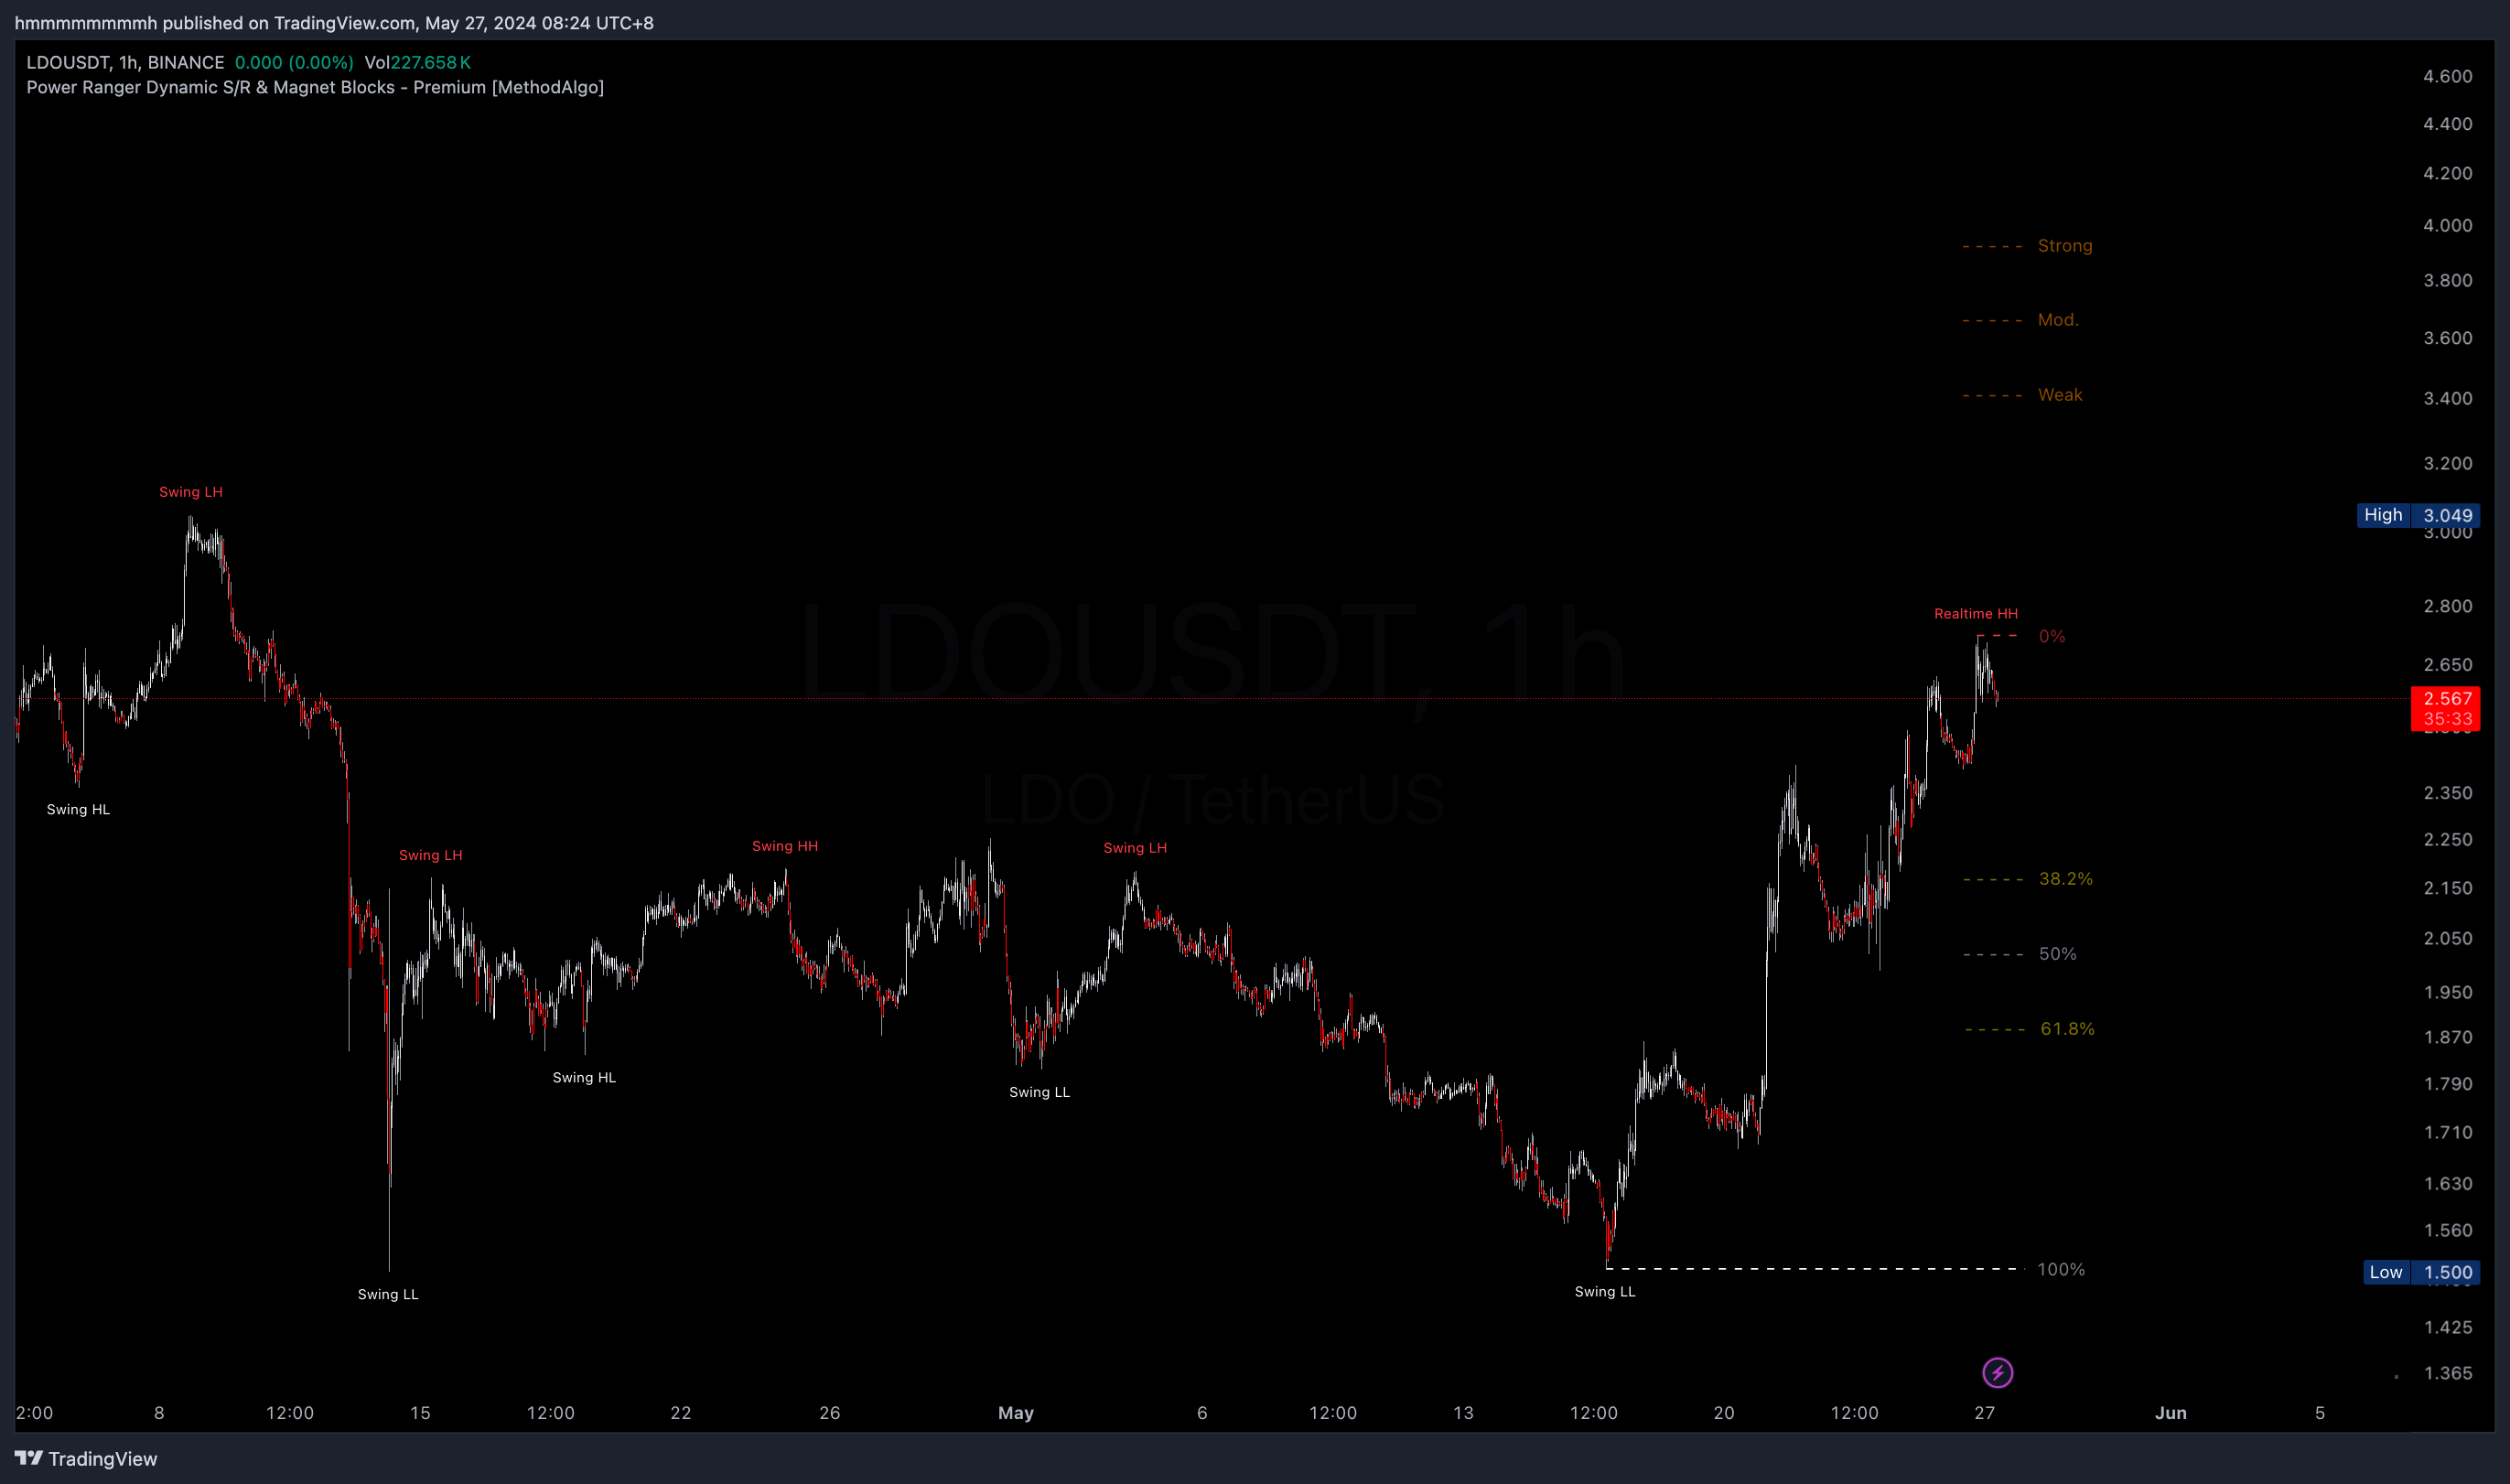
Swing High/Low is a commonly used price structure in trading. PowerRanger automatically identifies swing structures and visualizes the latest swing highs and lows with extended dotted lines. Swing highs and lows can act as important resistance and support levels, and can also be used in range-bound strategies. Additionally, the tool marks Swing HH (Higher High), HL (Higher Low), LH (Lower High), LL (Lower Low), helping traders further analyze swing trends.
Fibonacci
Fibonacci is a technical analysis tool based on a mathematical sequence. It draws retracement and extension levels (such as 0%, 38.2%, 50%, 61.8%, and 100%) according to Fibonacci ratios to identify potential retracement or extension areas. Fibonacci is widely used by market makers and investment institutions to predict hidden resistance and support lines in specific areas. For detailed basic usage of Fibonacci, you can search for related information on Google or watch the Fibonacci Basics Video at the bottom of this page.
Combining Swing and Fibonacci
PowerRanger combines swing highs and lows with Fibonacci to help users quickly identify the volatility of the current asset and accurately determine entry and stop-loss areas. Swing highs and lows are calculated in real-time based on price swings, while Fibonacci levels are automatically adjusted according to swing highs and lows.
Using the Swing Fibonacci feature, traders can obtain institutional-grade support and resistance levels. The combination of both enriches the depth of horizontal resistance and support visualization in PowerRanger. Whether in long-term, medium-term, or ultra-short-term trading, the application of swings and Fibonacci provides very valuable confidence levels, allowing traders to easily develop dozens of trading strategies.
Confluence
- Reference for retracement entry levels
- Reference for stop-loss and take-profit levels
- Support and resistance
- Long / Short trends bias
Interface
The default parameter settings only display real-time swings and swing Fibonacci. To display historical swing labels, enable historical labels in the Swing Settings.
- Swing Labels: Marked as
Swing + (HH/HL/LH/LL)likeSwing HL, swing highs are red, swing lows are white. - Real-time Swing Labels: When the price breaks the current swing high or low, PowerRanger adopts the new position as the new swing level, marked as
Realtime HH/HL/LH/LL. - Swing Extension Lines: The last pair of swings high/low have extended dotted lines, with the top red and the bottom white. They also serve as the 0% and 100% levels of Swing Fibonacci.
- Fibonacci: PowerRanger uses percentages instead of decimal to label Fibonacci levels. Swing Fibonacci identifies 0% and 100% through the swing extension lines mentioned above and automatically extends to 38.2%, 50%, and 61.8% for strong levels, with weaker levels like 23.6% available in the Fibonacci Settings.
- Fibonacci Extension Levels: We simplify the labeling of Fibonacci extension levels according to the Fibonacci Extension Video:
Weak: Corresponding to138.2%and-38.2%Mod: Corresponding to150%and-50%Strong: Corresponding to161.8%and-61.8%Full: Corresponding to200%and-100%
If your chart uses Log Mode, you need to enable Use Log Mode in the Fibonacci Settings to display correct Fibonacci levels.
Strategies
Swing Trends
- Structural Trends: Swing labels use HH (Higher High)/HL (Higher Low)/LH (Lower High)/LL (Lower Low). For example, HH+HL indicates an uptrend, and continued HH or HL suggests trend continuation. LH+LL indicates a downtrend, and continued LH and LL suggest trend continuation. Otherwise (if HH/HL appears in a downtrend or LH/LL appears in an uptrend), it might indicate a swing structure reversal.
- Support and Resistance Trends: Use drawing tools to connect swing highs and swing lows to get reference bias for trend support and resistance.
Swing Breakout
- Entry: When price breaks
swing high/loworsupport/resistance line drawn by connecting swing highs and lows, increase breakout bias (companion strategy should in place to avoid fakeout or reverse trade). - Take Profit: When entering in the middle or lower part of a swing, set TP at the current or historical swing high (short position for swing low).
- Stop Loss: Use swing highs and lows as stop-loss reference levels.
Swing Fibonacci Retracement
- Entry: Set entry orders at the retracement levels of swing Fibonacci (38.2%, 50%, or 61.8%) based on trend strength.
- Take Profit: For range trading, set TP1 before breaking out of the swing range, using 50% and 61.8% as take-profit reference targets. if price already breaks of 61.8%, target 100%.
- Stop Loss: 61.8% is commonly used stop-loss level within the swing range, as losing this level typically leads the price to 100% or further.
Swing Fibonacci Extension
- Take Profit: Observe the price retracement levels within the swing range, select a corresponding Fibonacci extension levels as expecting full TP target based on the trend strength. explained in Fibonacci Extension Video.
- Reversal Entry: Extension targets often serve as potential levels for reversal entries, as they are potential / hidden support and resistance.
- Stop Loss: Use these extension levels as stop-loss reference based on historical market respect for these levels.
Examples
The following examples use Log Mode charts with the Fibonacci Use Log Mode option enabled and the Swing Historical Labels option enabled, with all other PowerRanger tools turned off to only display tool in this specific tutorial.
The Fibonacci levels is displayed without extended lines to the left for clean aesthetics and practicality. Traders can manually extend the lines using TradingView’s Fibonacci tool as needed.
Swing Trends and Breakouts
The example below uses drawing tools to connect swing highs and swing lows to obtain trend support and resistance lines. Both the orange and blue lines are correctly drawn, demonstrating the breakout and subsequent price movement. Two sets of support and resistance are there to demonstrate:
When multiple S/R area found, lines drawn from the same trend swing labels (blue) is superior to mixed swing labels (orange). However, the breakout of orange resistance in this case also serves as a confirmation to the blue resistance breakout.
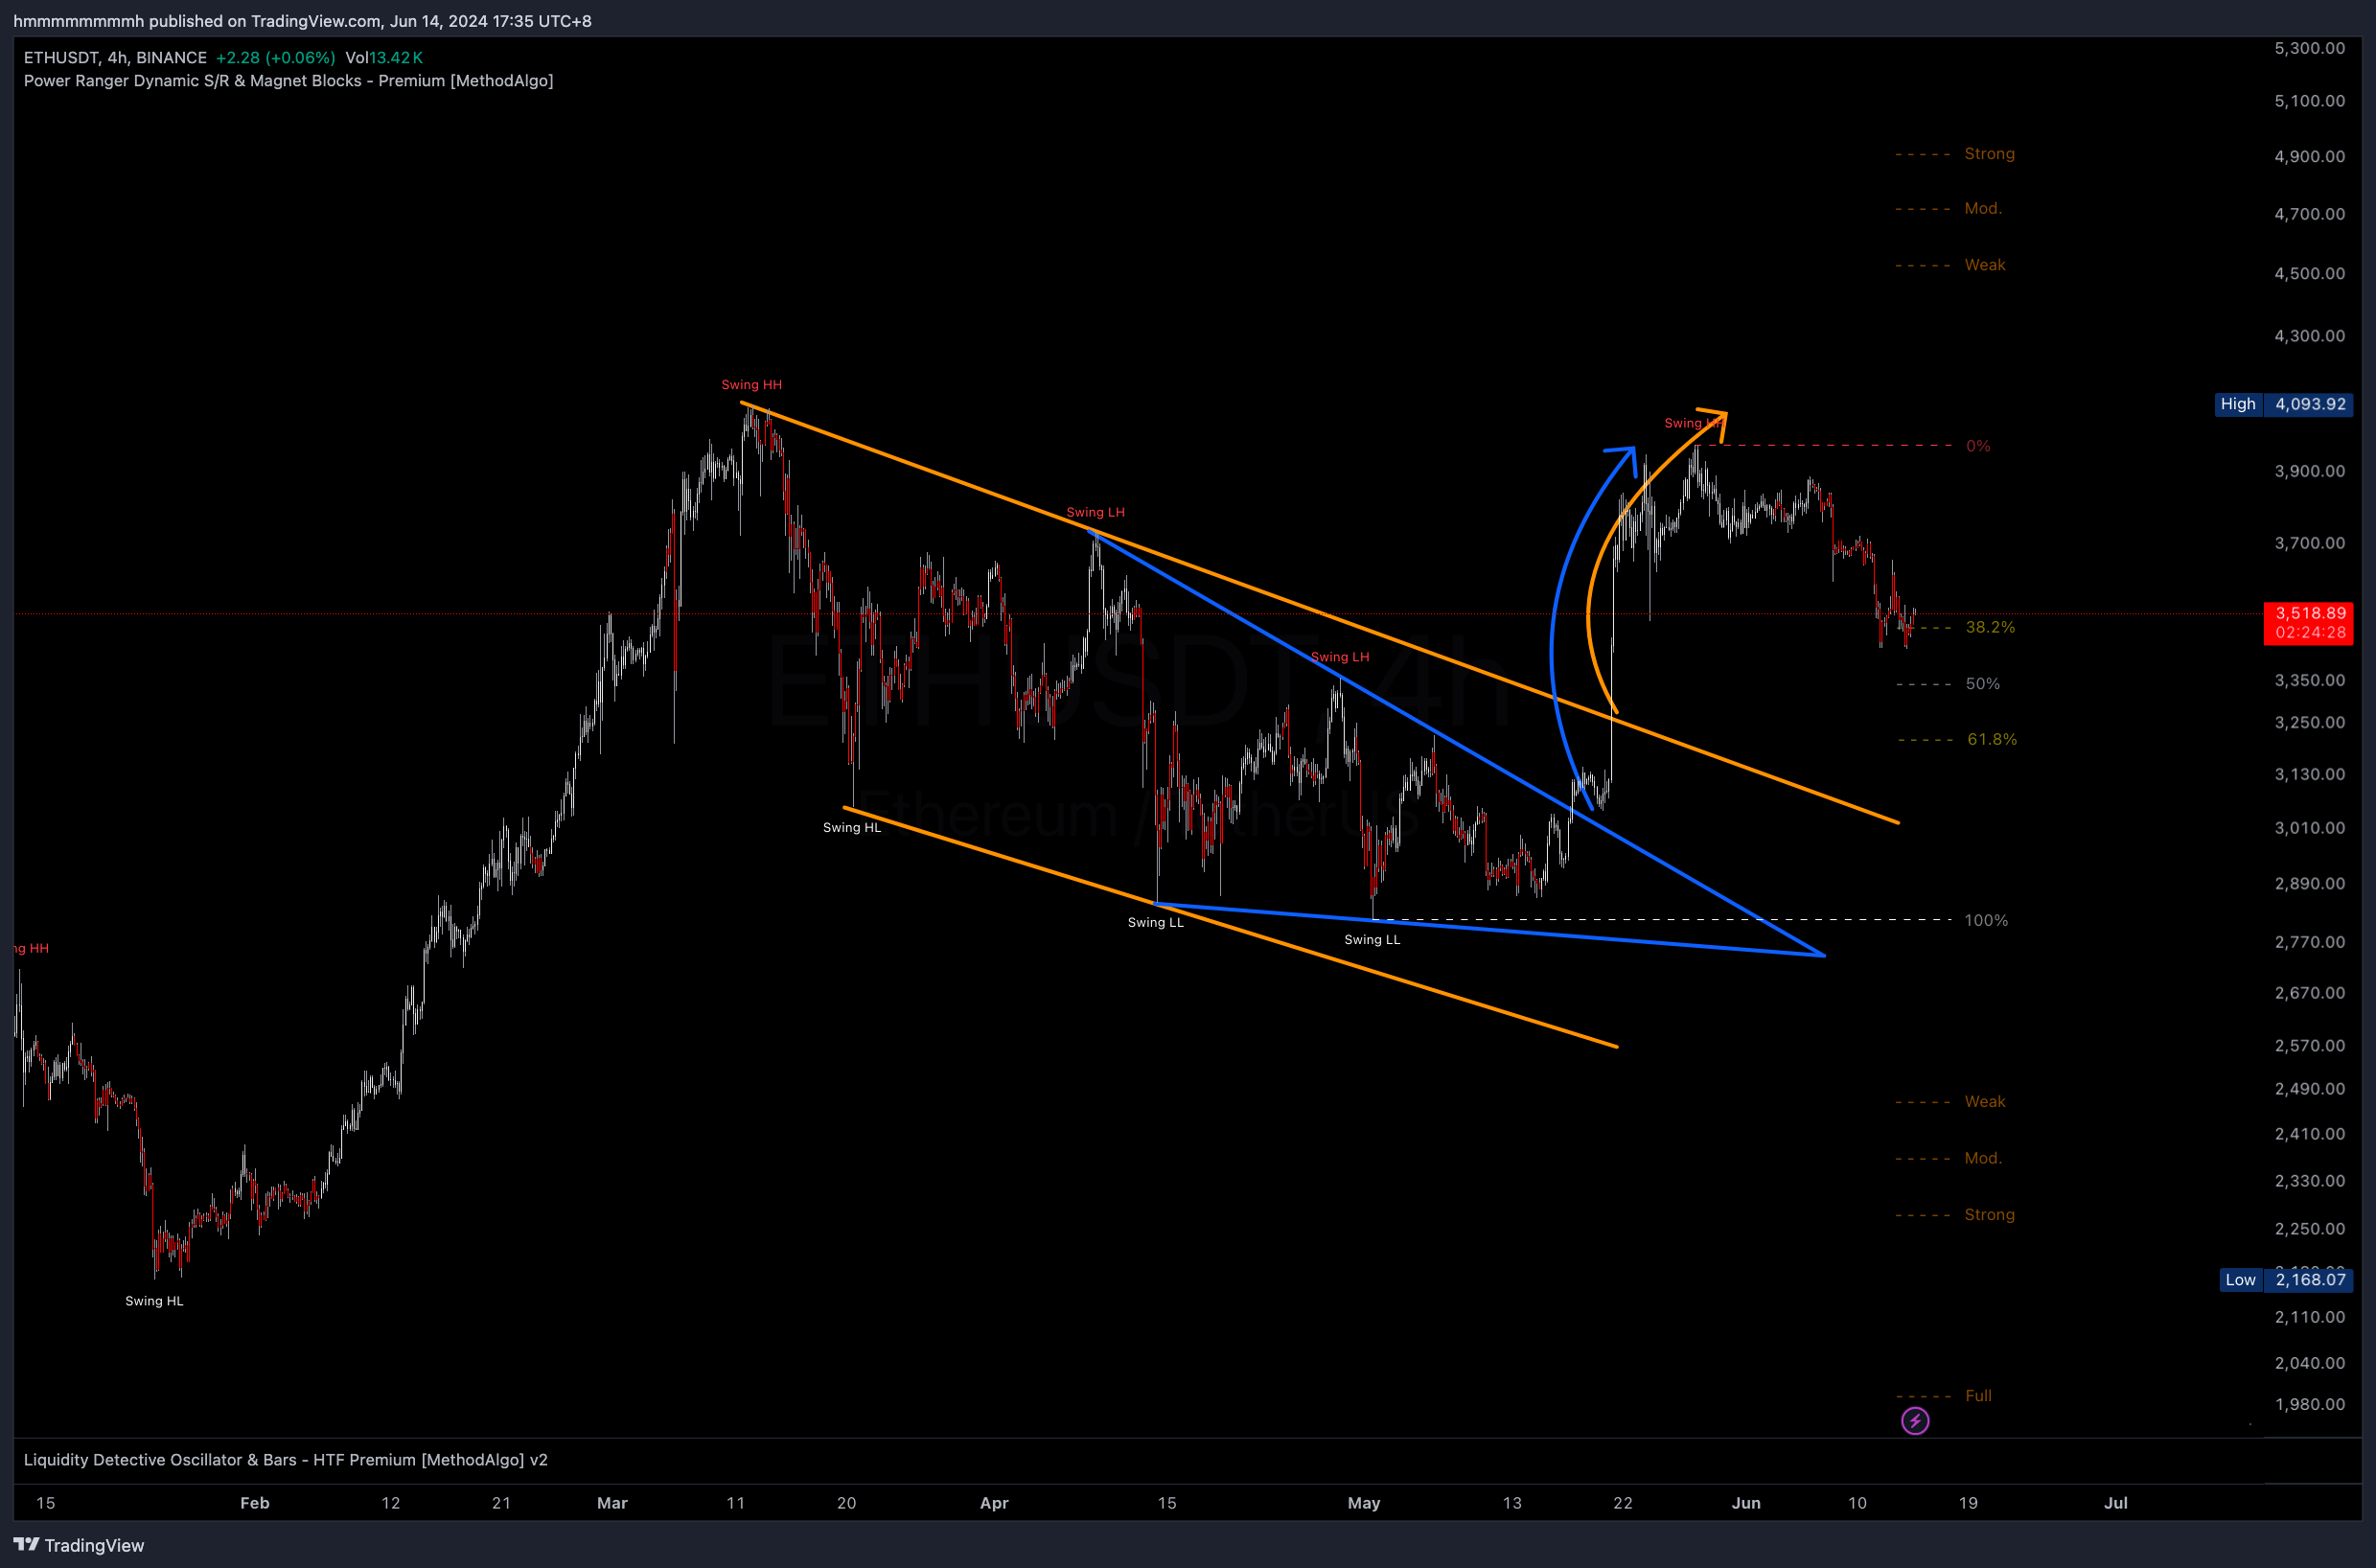 ETHUSDT 4h
Swing Structure Trend Lines
In the figure below, also two sets of trend lines are drawn, both of which are valid support and resistance.
This example demonstrates that support and resistance should be matched in structure. A common mistake is to pair orange resistance 1 with blue support 2, which is incorrect because the support and resistance aren't matched in structure.
Refer to the figure below where the orange actually forms a descending channel within the blue symmetrical triangle. After the price breaks the orange channel, we can predict resistance at blue resistance 2 to take profit there or start a short position based on individual trading strategies.
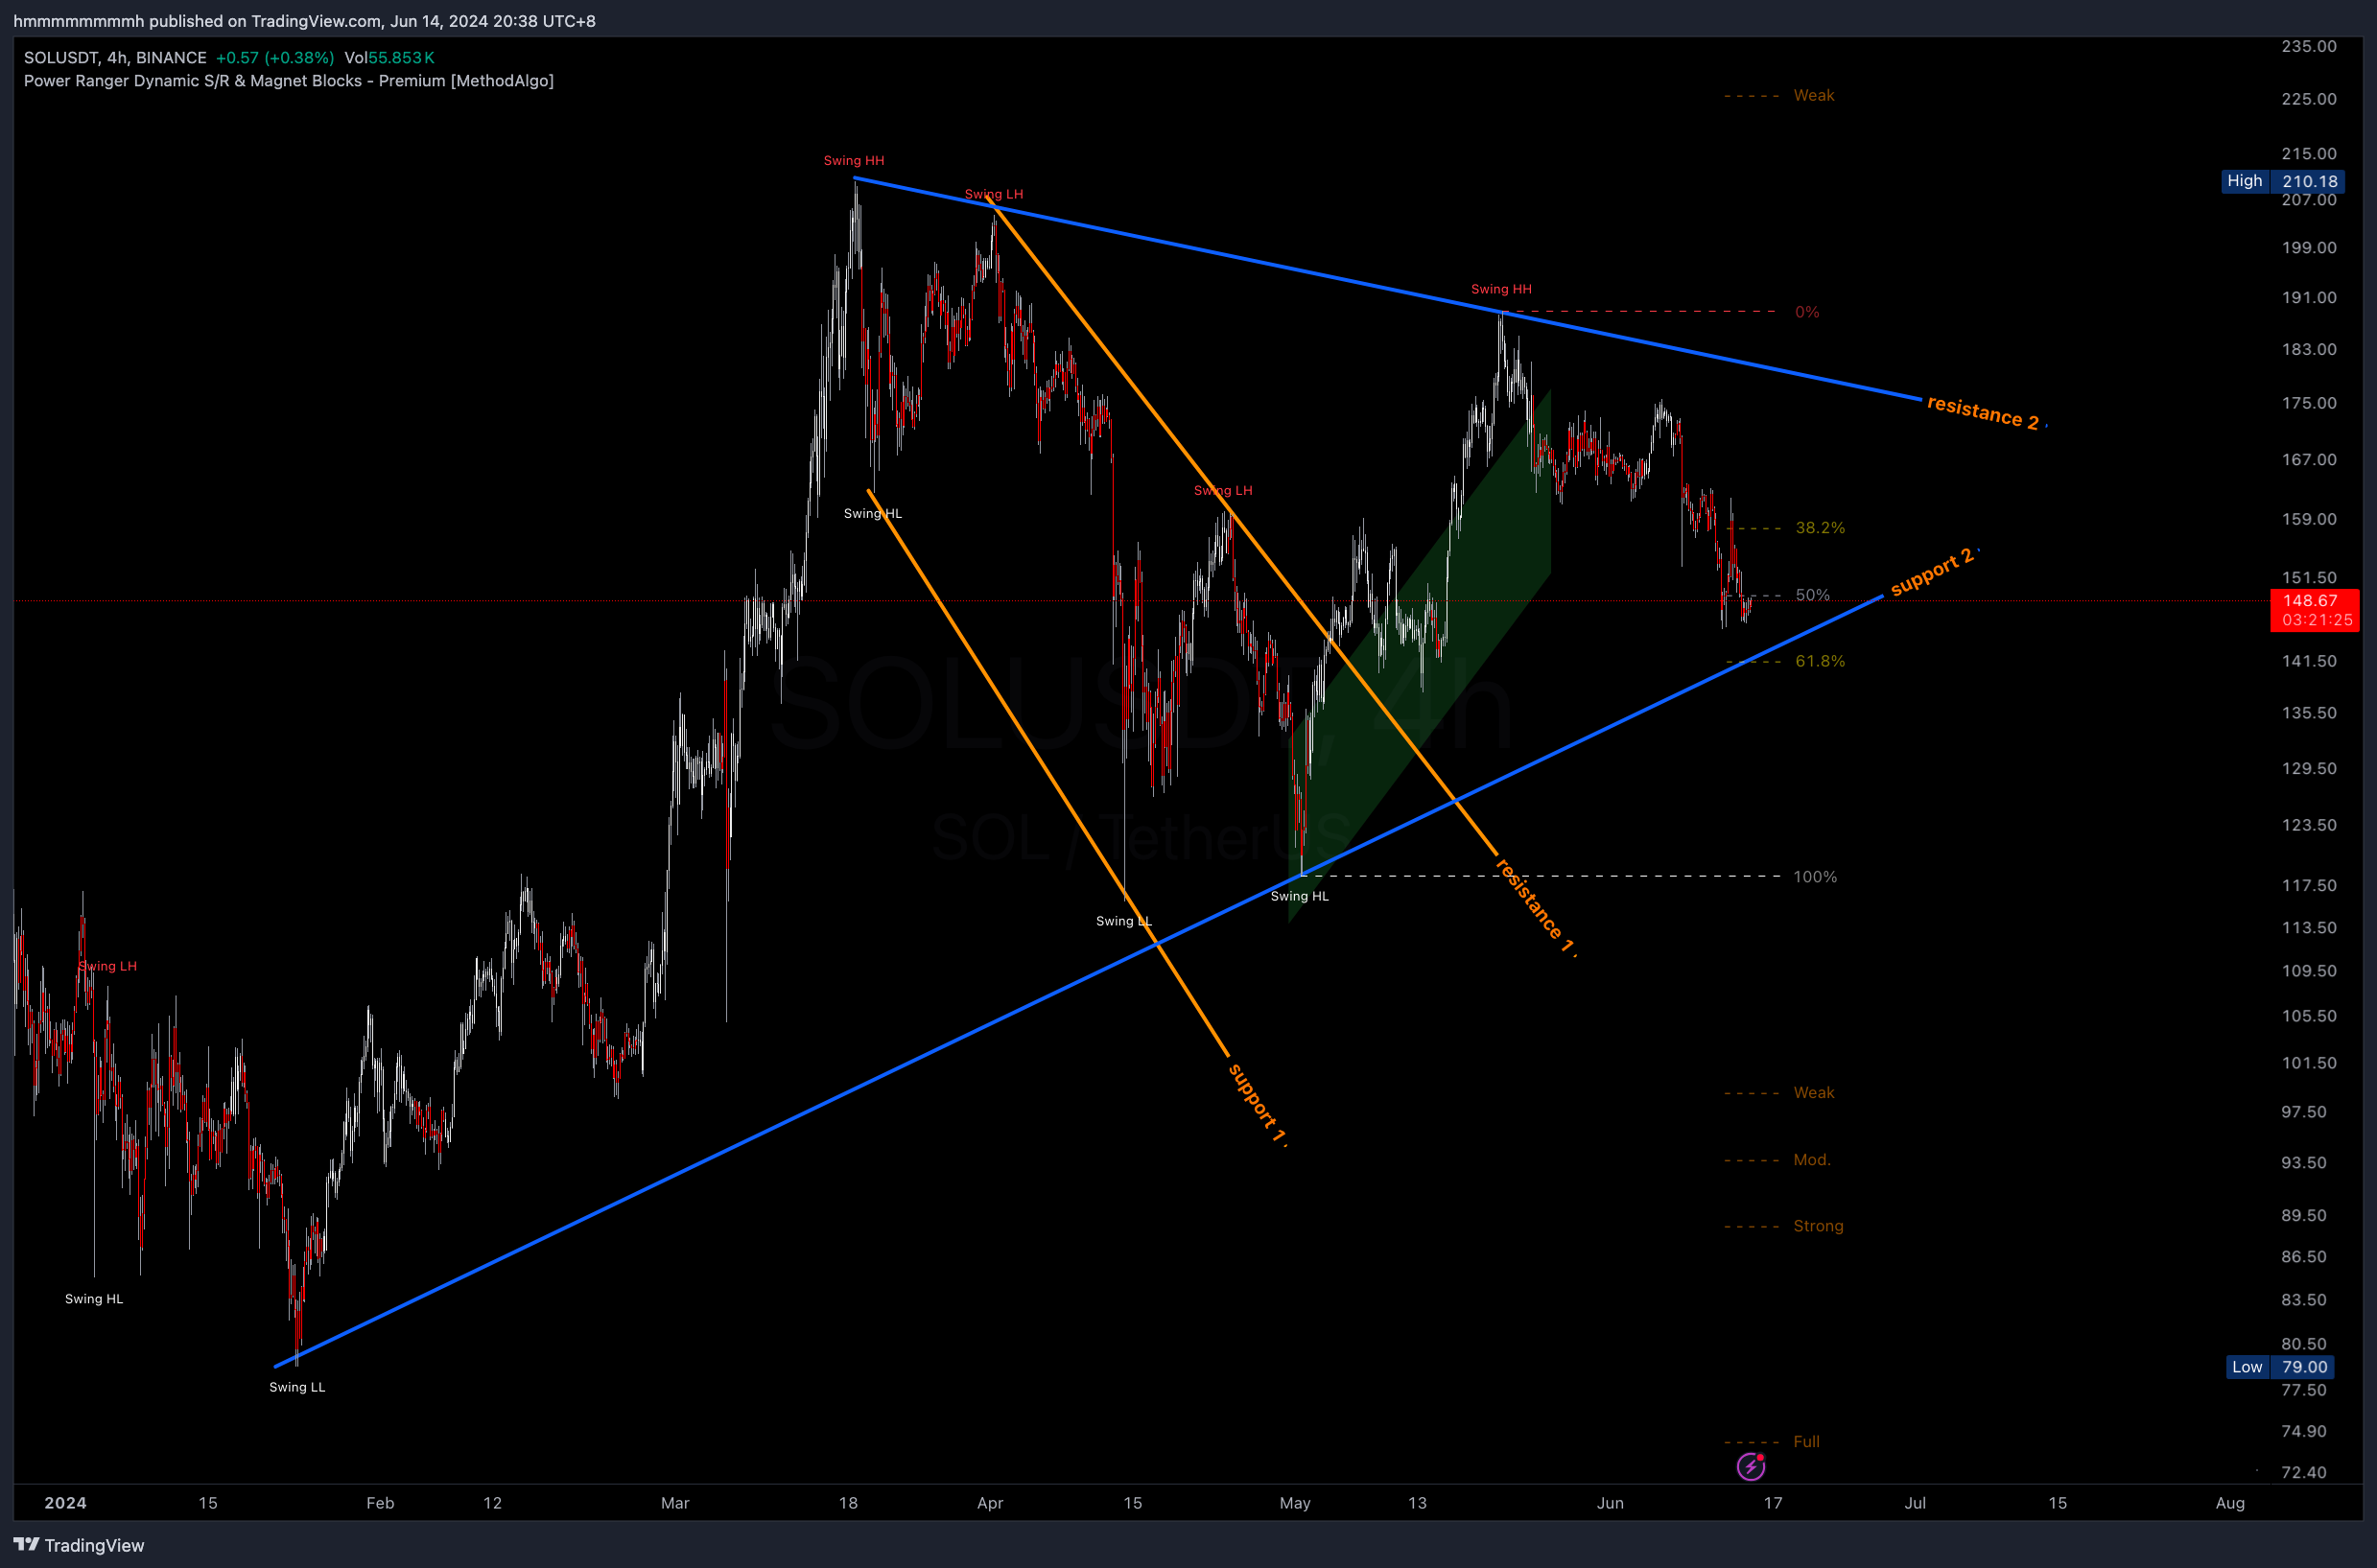 SOLUSDT 4h
Using Fibonacci Retracement
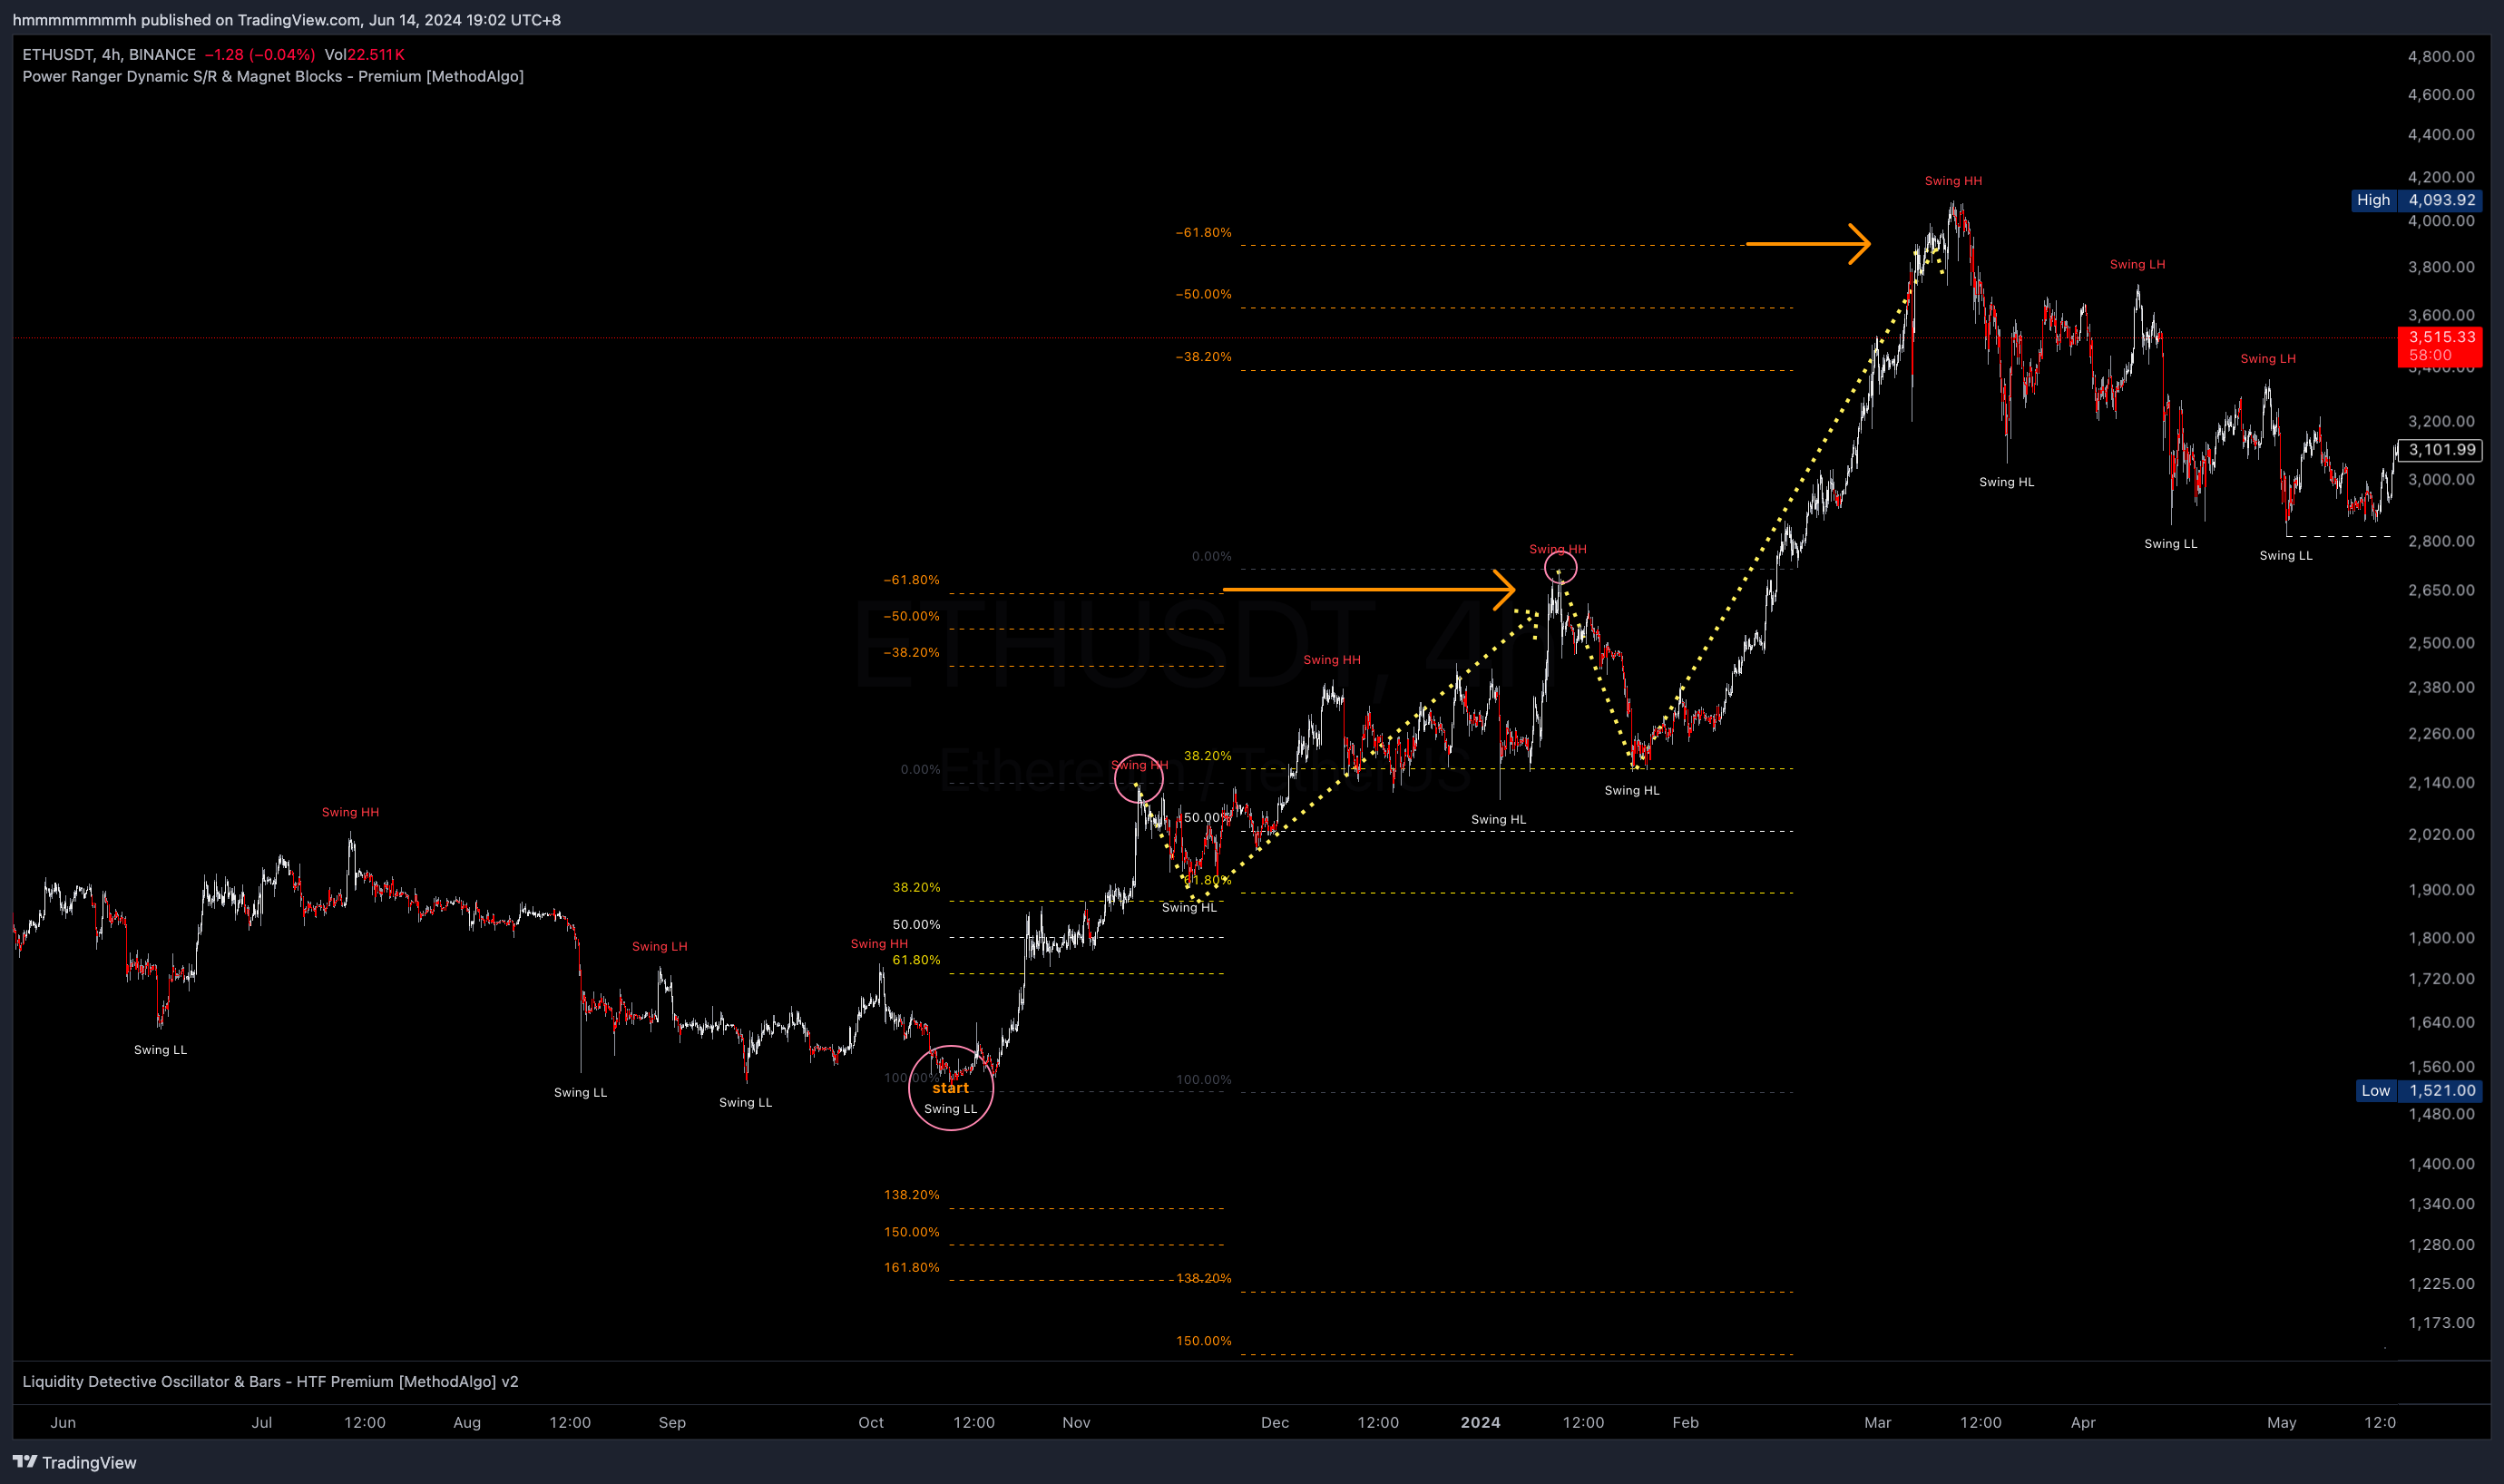
The example below shows after ETHUSDT made a new high, trader using the Swing Fibonacci Retracement strategy, setting an entry order at the 50% level and using below 61.8% as the stop-loss level.
How many TPs should placed and which level should be used depend on the trader’s trading strategy. In this setup, available TP targets includes:
- Internal swing highs
- Previous swing highs
- Extended Weak or Mod price levels.
With the swing high(4093) from left figure for final TP, you get yourself a setup with RR 3, or with the on-chart setup aim to Moderate extension level(5637), you get a setup with RR 7.
we see the pump on the right side of figure, price didn't fully kiss the previously swing high, so 1% or few ticks lower is always a good practice, or set some internal TPs to cap some of the profit before full TP target reached, again is all depends on traders strategy, HOLDL is also not the worst idea.
According to the Fibonacci Extension Video, when retracement is about 50% from range, the expect target based on the current data, assuming trend continuation and successful breakout, is at the -50% (Mod) level labeled by Swing Fibonacci(5637).
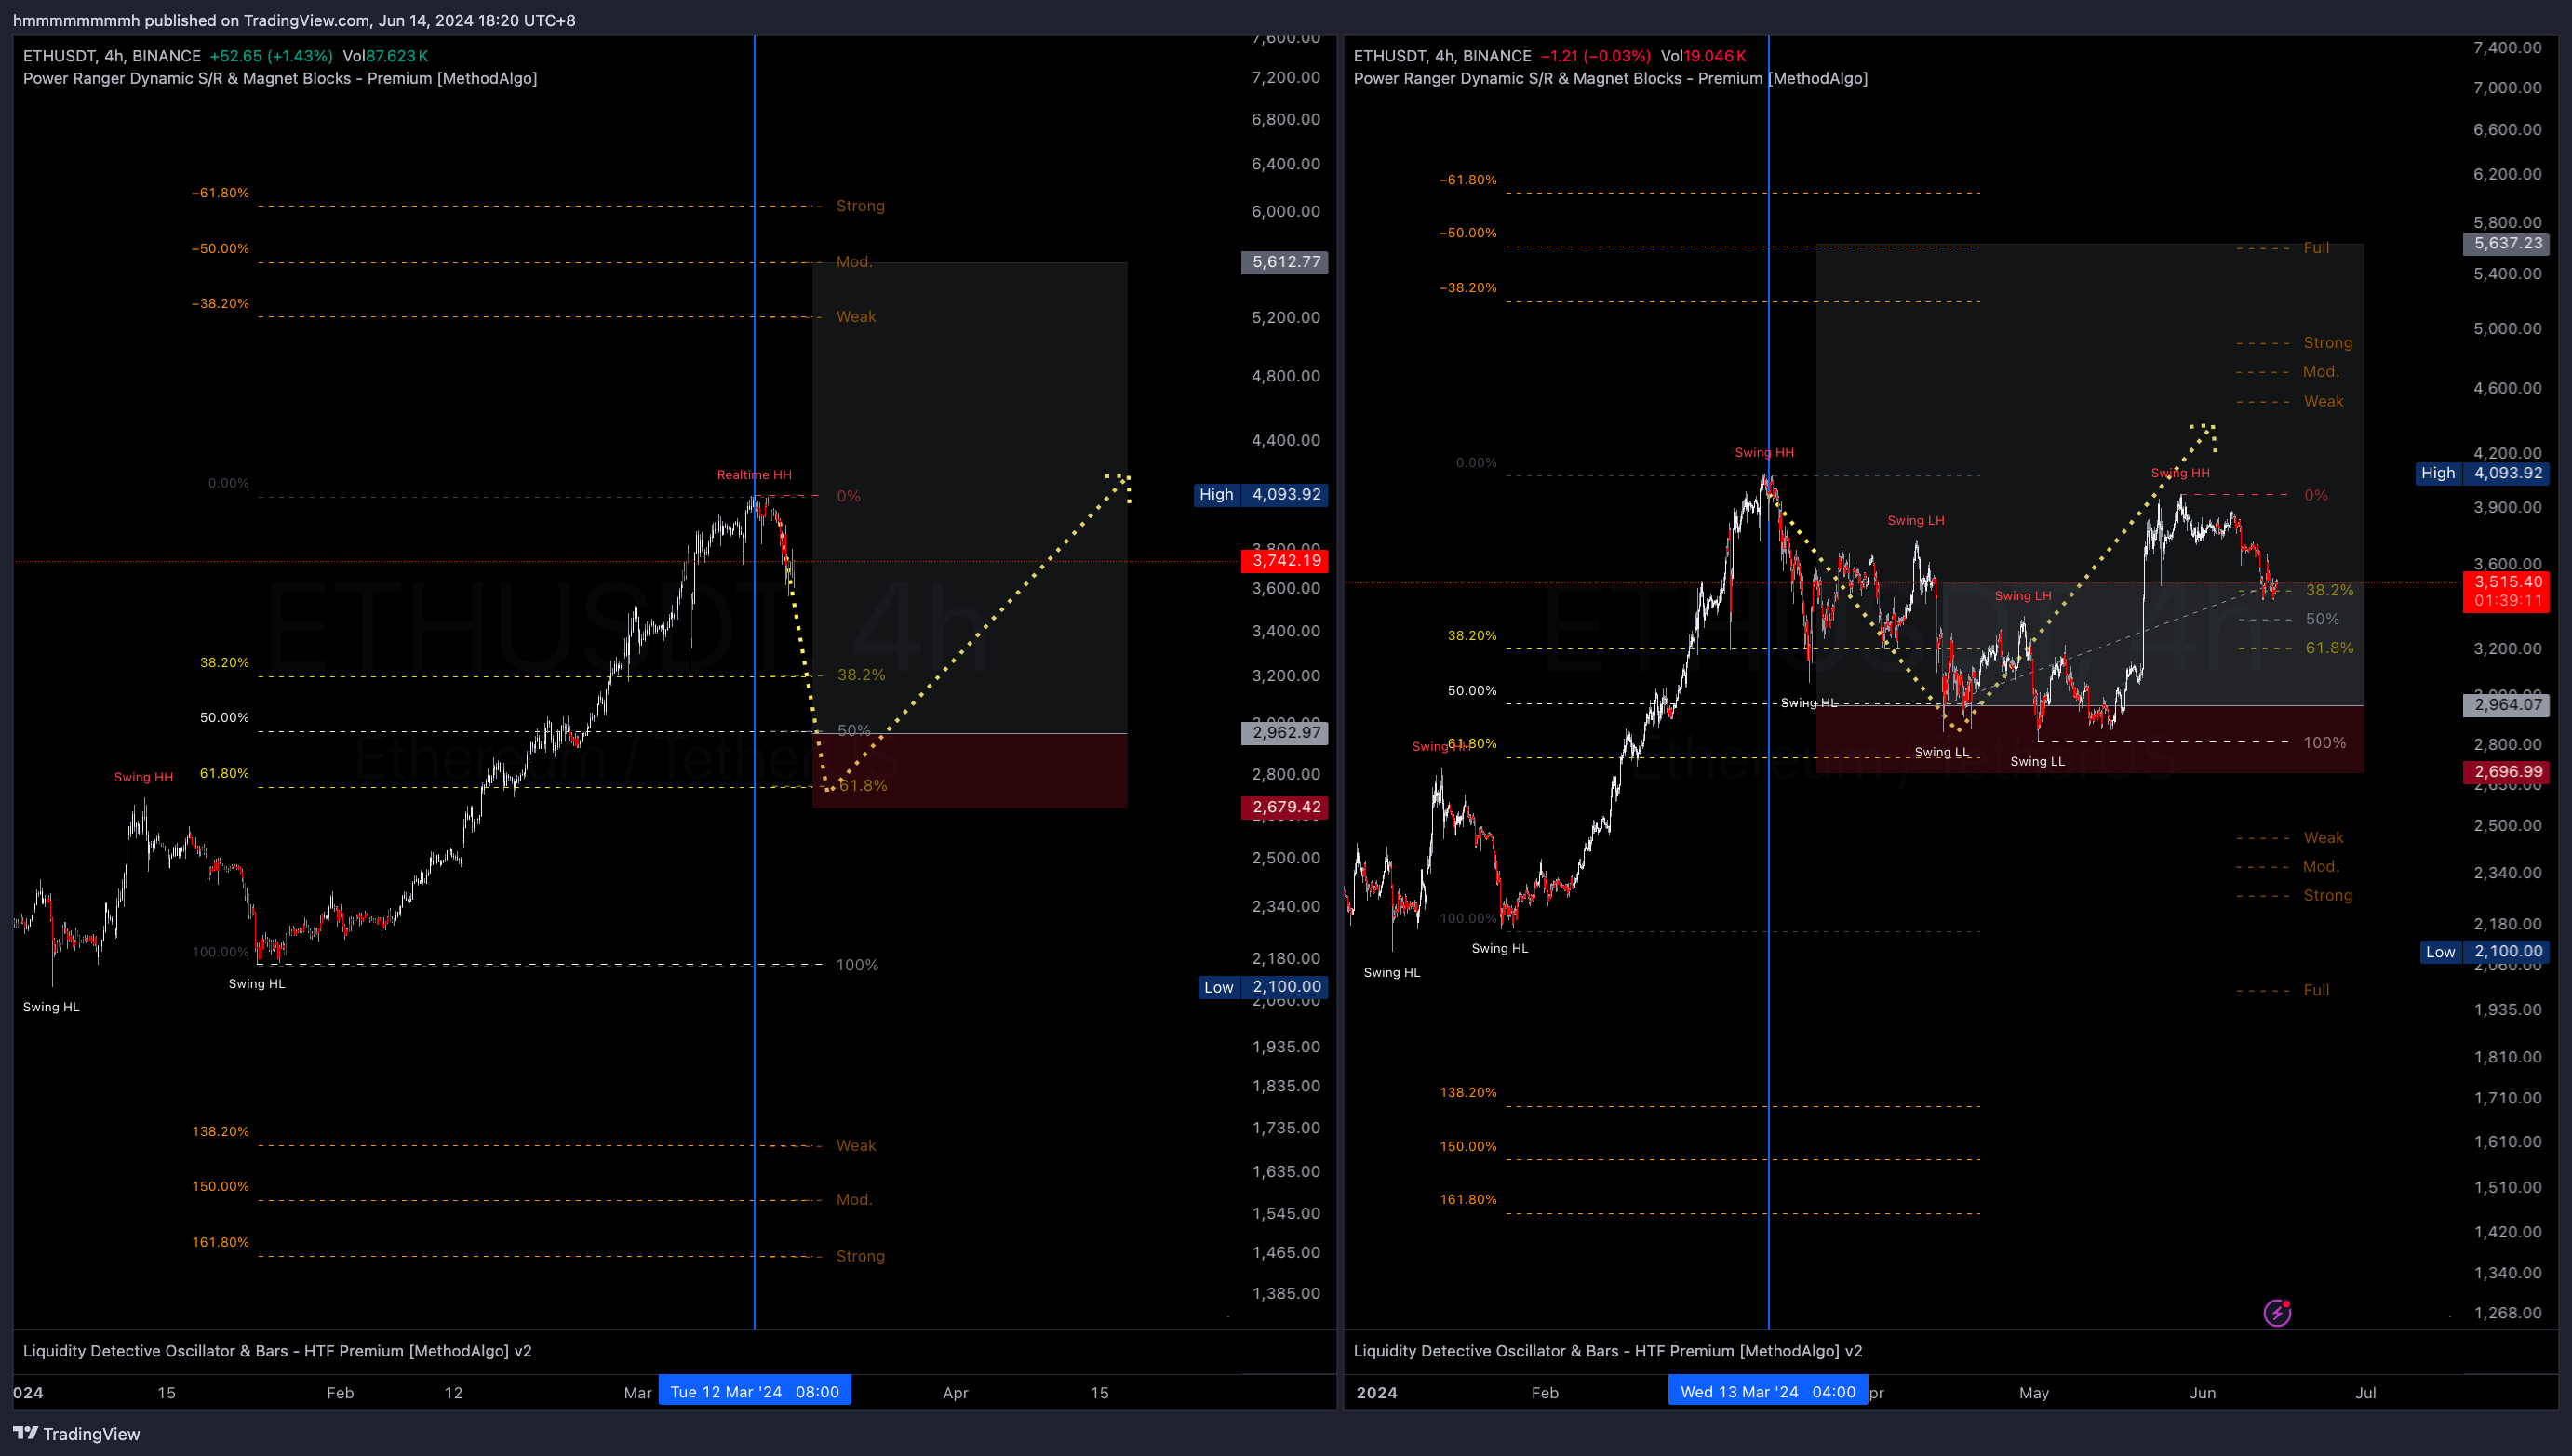 ETHUSDT 4h, left before prediction, right after prediction
Using Fibonacci Extensions for Take Profit
According to the Fibonacci Extension Video, assuming future breakout and trend continuation:
38.2% retracement: Full TP expectation is at Strong level (-61.8% / 161.8%)50% retracement: Full TP expectation is at Mod level (-50% / 150%)61.8% retracement: Full TP expectation is at Weak level (-38.2% / 138.2%)
In the example below, two Fibonacci levels are drawn from the same swing low. both retraced into 38.2%, and both hits the full target before next major retracement.
 ETHUSDT 4h
Fibonacci extension expectations are predictions based on the assumption of swing breakout and trend continuation. They do not guarantee the price will reach these levels. Traders should use strategies such as multiple TPs, early TPs, and trailing stops to mitigate situations where targets are not reached and handle scenarios of fakeout or trend reversal.
Verifying Fibonacci Level Effectiveness
Since the calculation range for swing highs and lows is a customizable parameter (default is the highest and lowest of the 100 candles before and after; this can be changed but the default is recommended), sometimes the Fibonacci levels within the swings might limit the trading perspective or be too broad to effectively calculate the fluctuations within them. In such cases, traders should manually draw a Fibonacci level with a larger or smaller swing range to assist in analysis.
In the example below, the trader manually drew two Fibonacci levels:
- Large Fibonacci: Selected a larger swing range than the current real-time swing Fibonacci.
- Small Fibonacci: Same as the current indicator's Swing Fibonacci, exist for extended the horizontal lines for better visualization.
The more important wicks that touches Fibonacci levels, the more effective they are, indicating stronger support and resistance. Conversely, levels that are less respected by price action indicate weaker support and resistance.
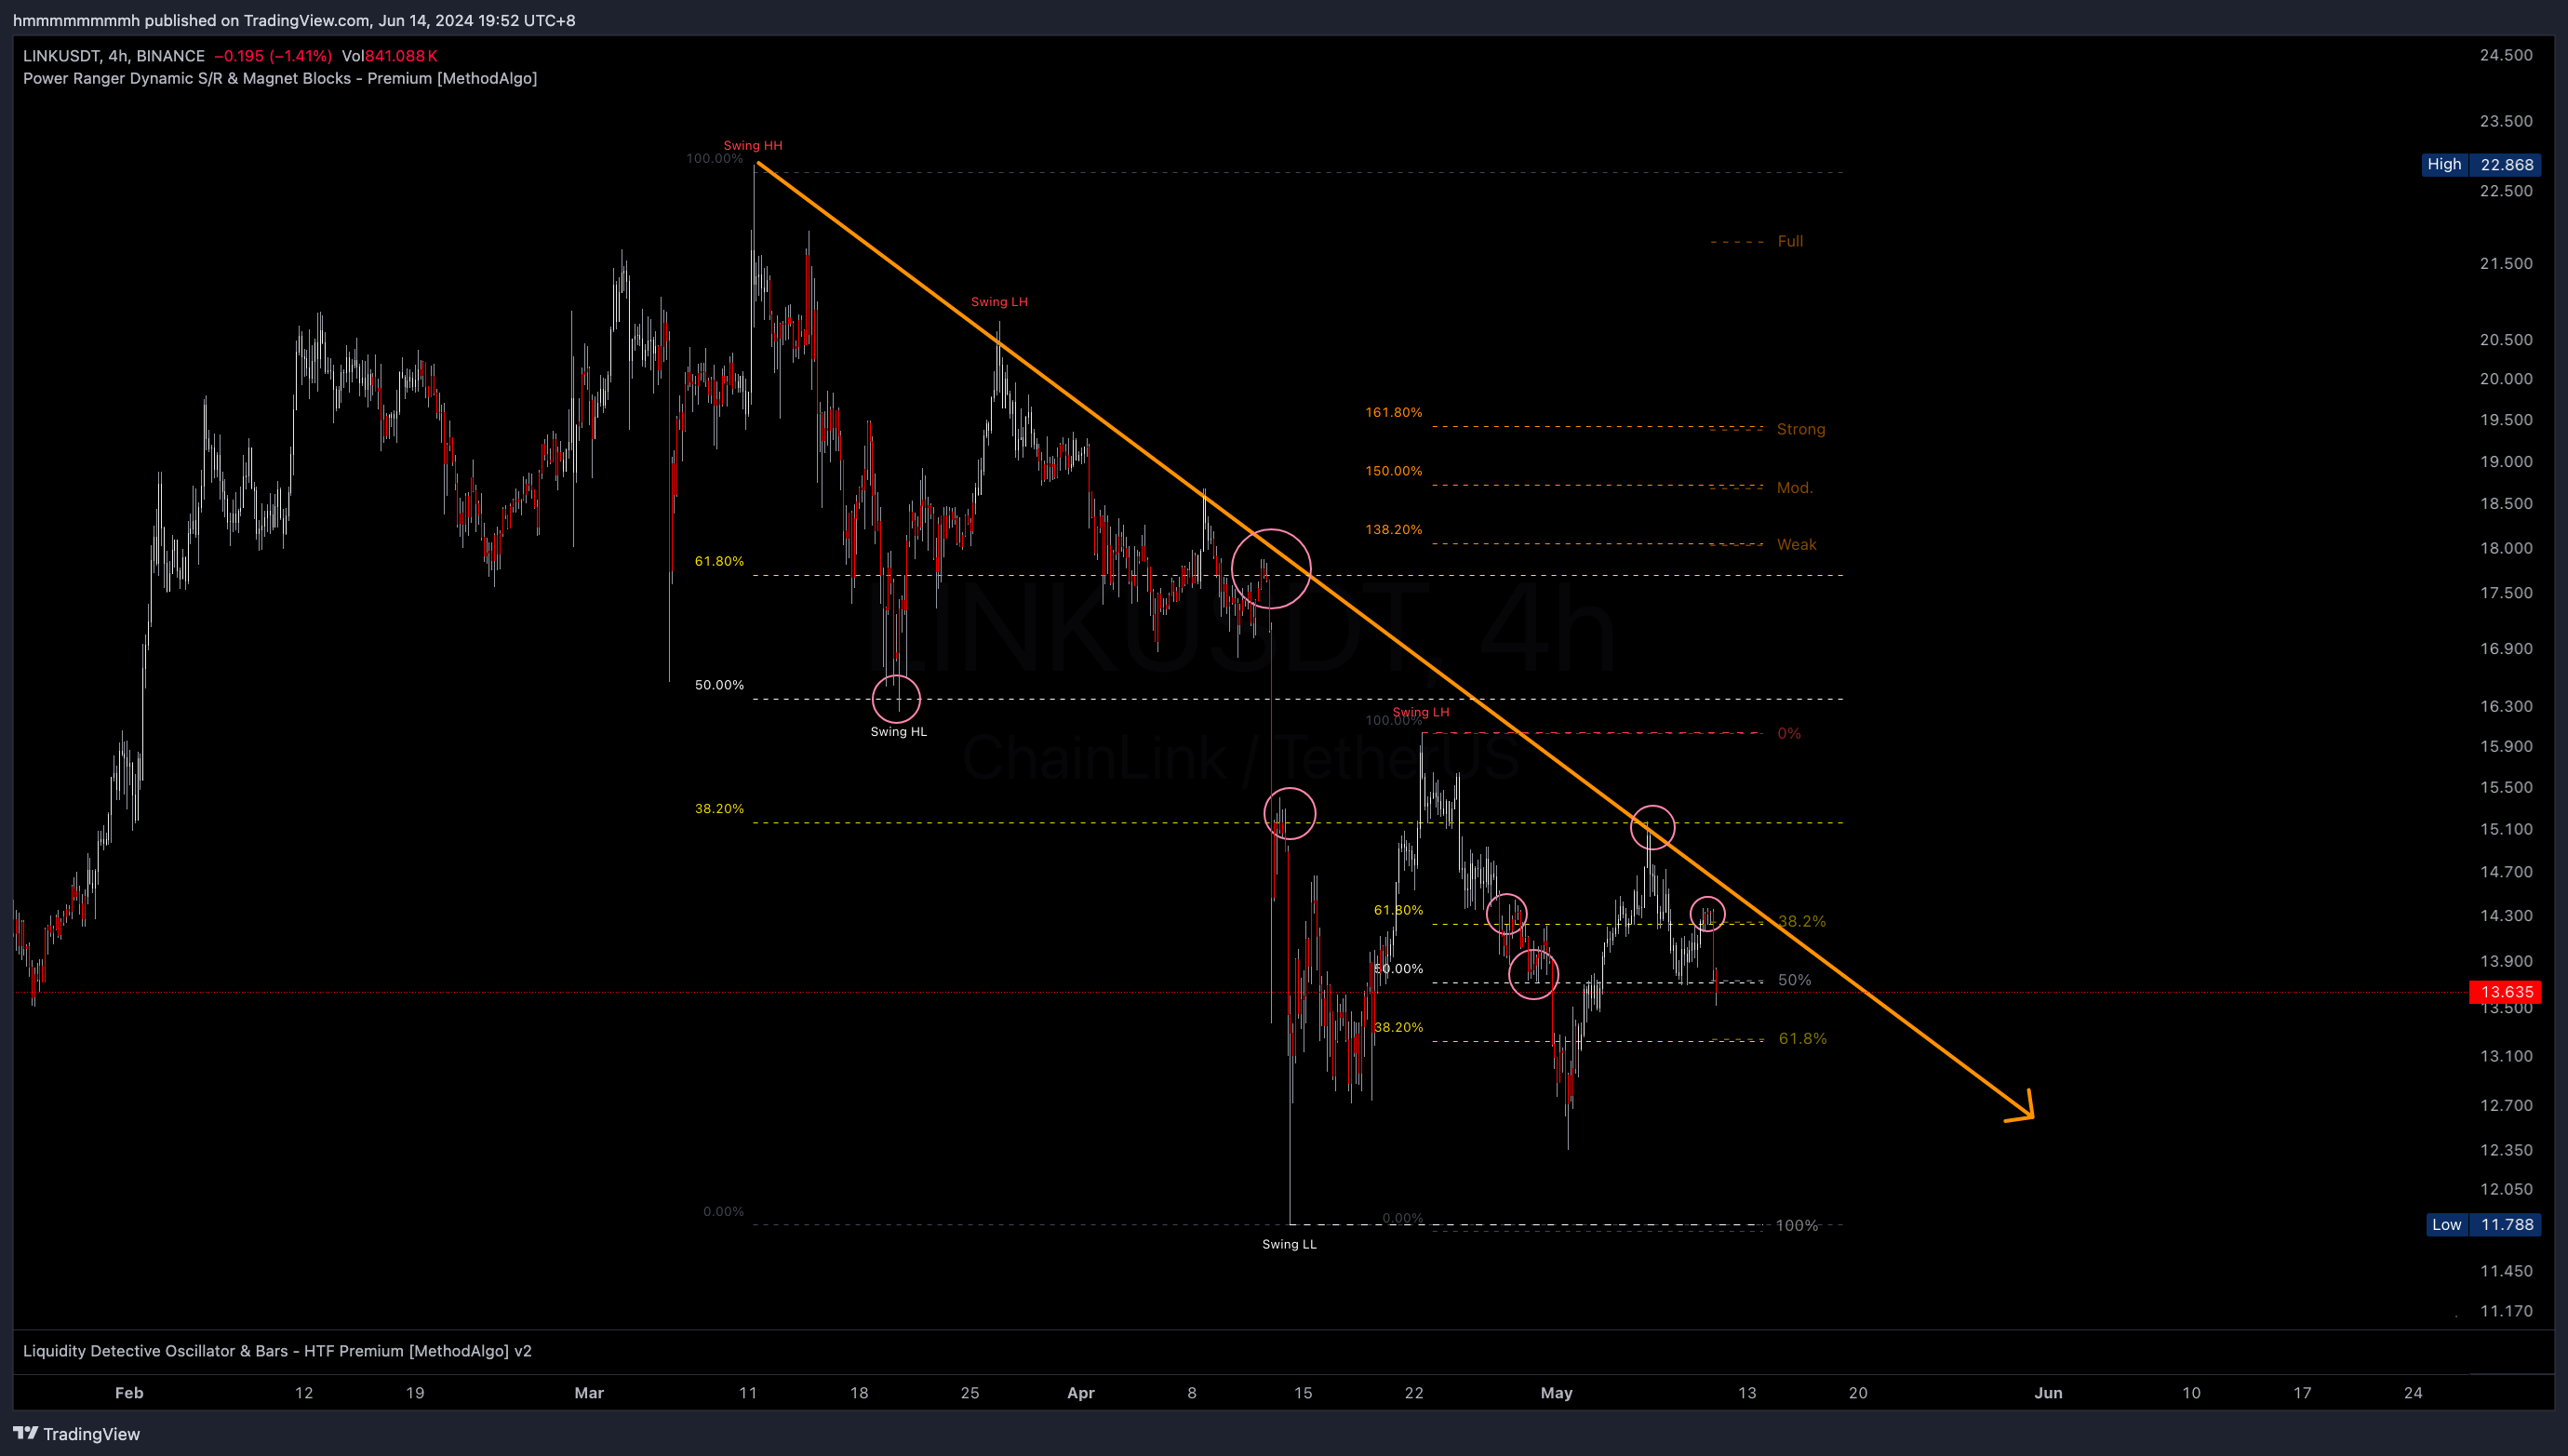 LINKUSDT 4h
In the subsequent price action (below chart), we observe that the 50% and 61.8% levels of the larger Fibonacci are good TP targets, and the smaller Fibonacci's extension levels hit two significant levels.
These levels are objective and observable before the breakout. again, the specific TP targets a trader chooses depend on their trading style and risk setup.
Take-profit levels can also be used as stop-loss levels. Different levels offer various stop-loss strategies. For instance, if a trader has not gone long and opts for a short position:
- A closer stop-loss can quickly confirm if the short bias is wrong, minimizing losses.
- A distant stop-loss (e.g., beyond the swing high or above the 161.8% (strong) extension) is suitable for short-term bullish but long-term bearish bias, avoiding SL hit from volatility.
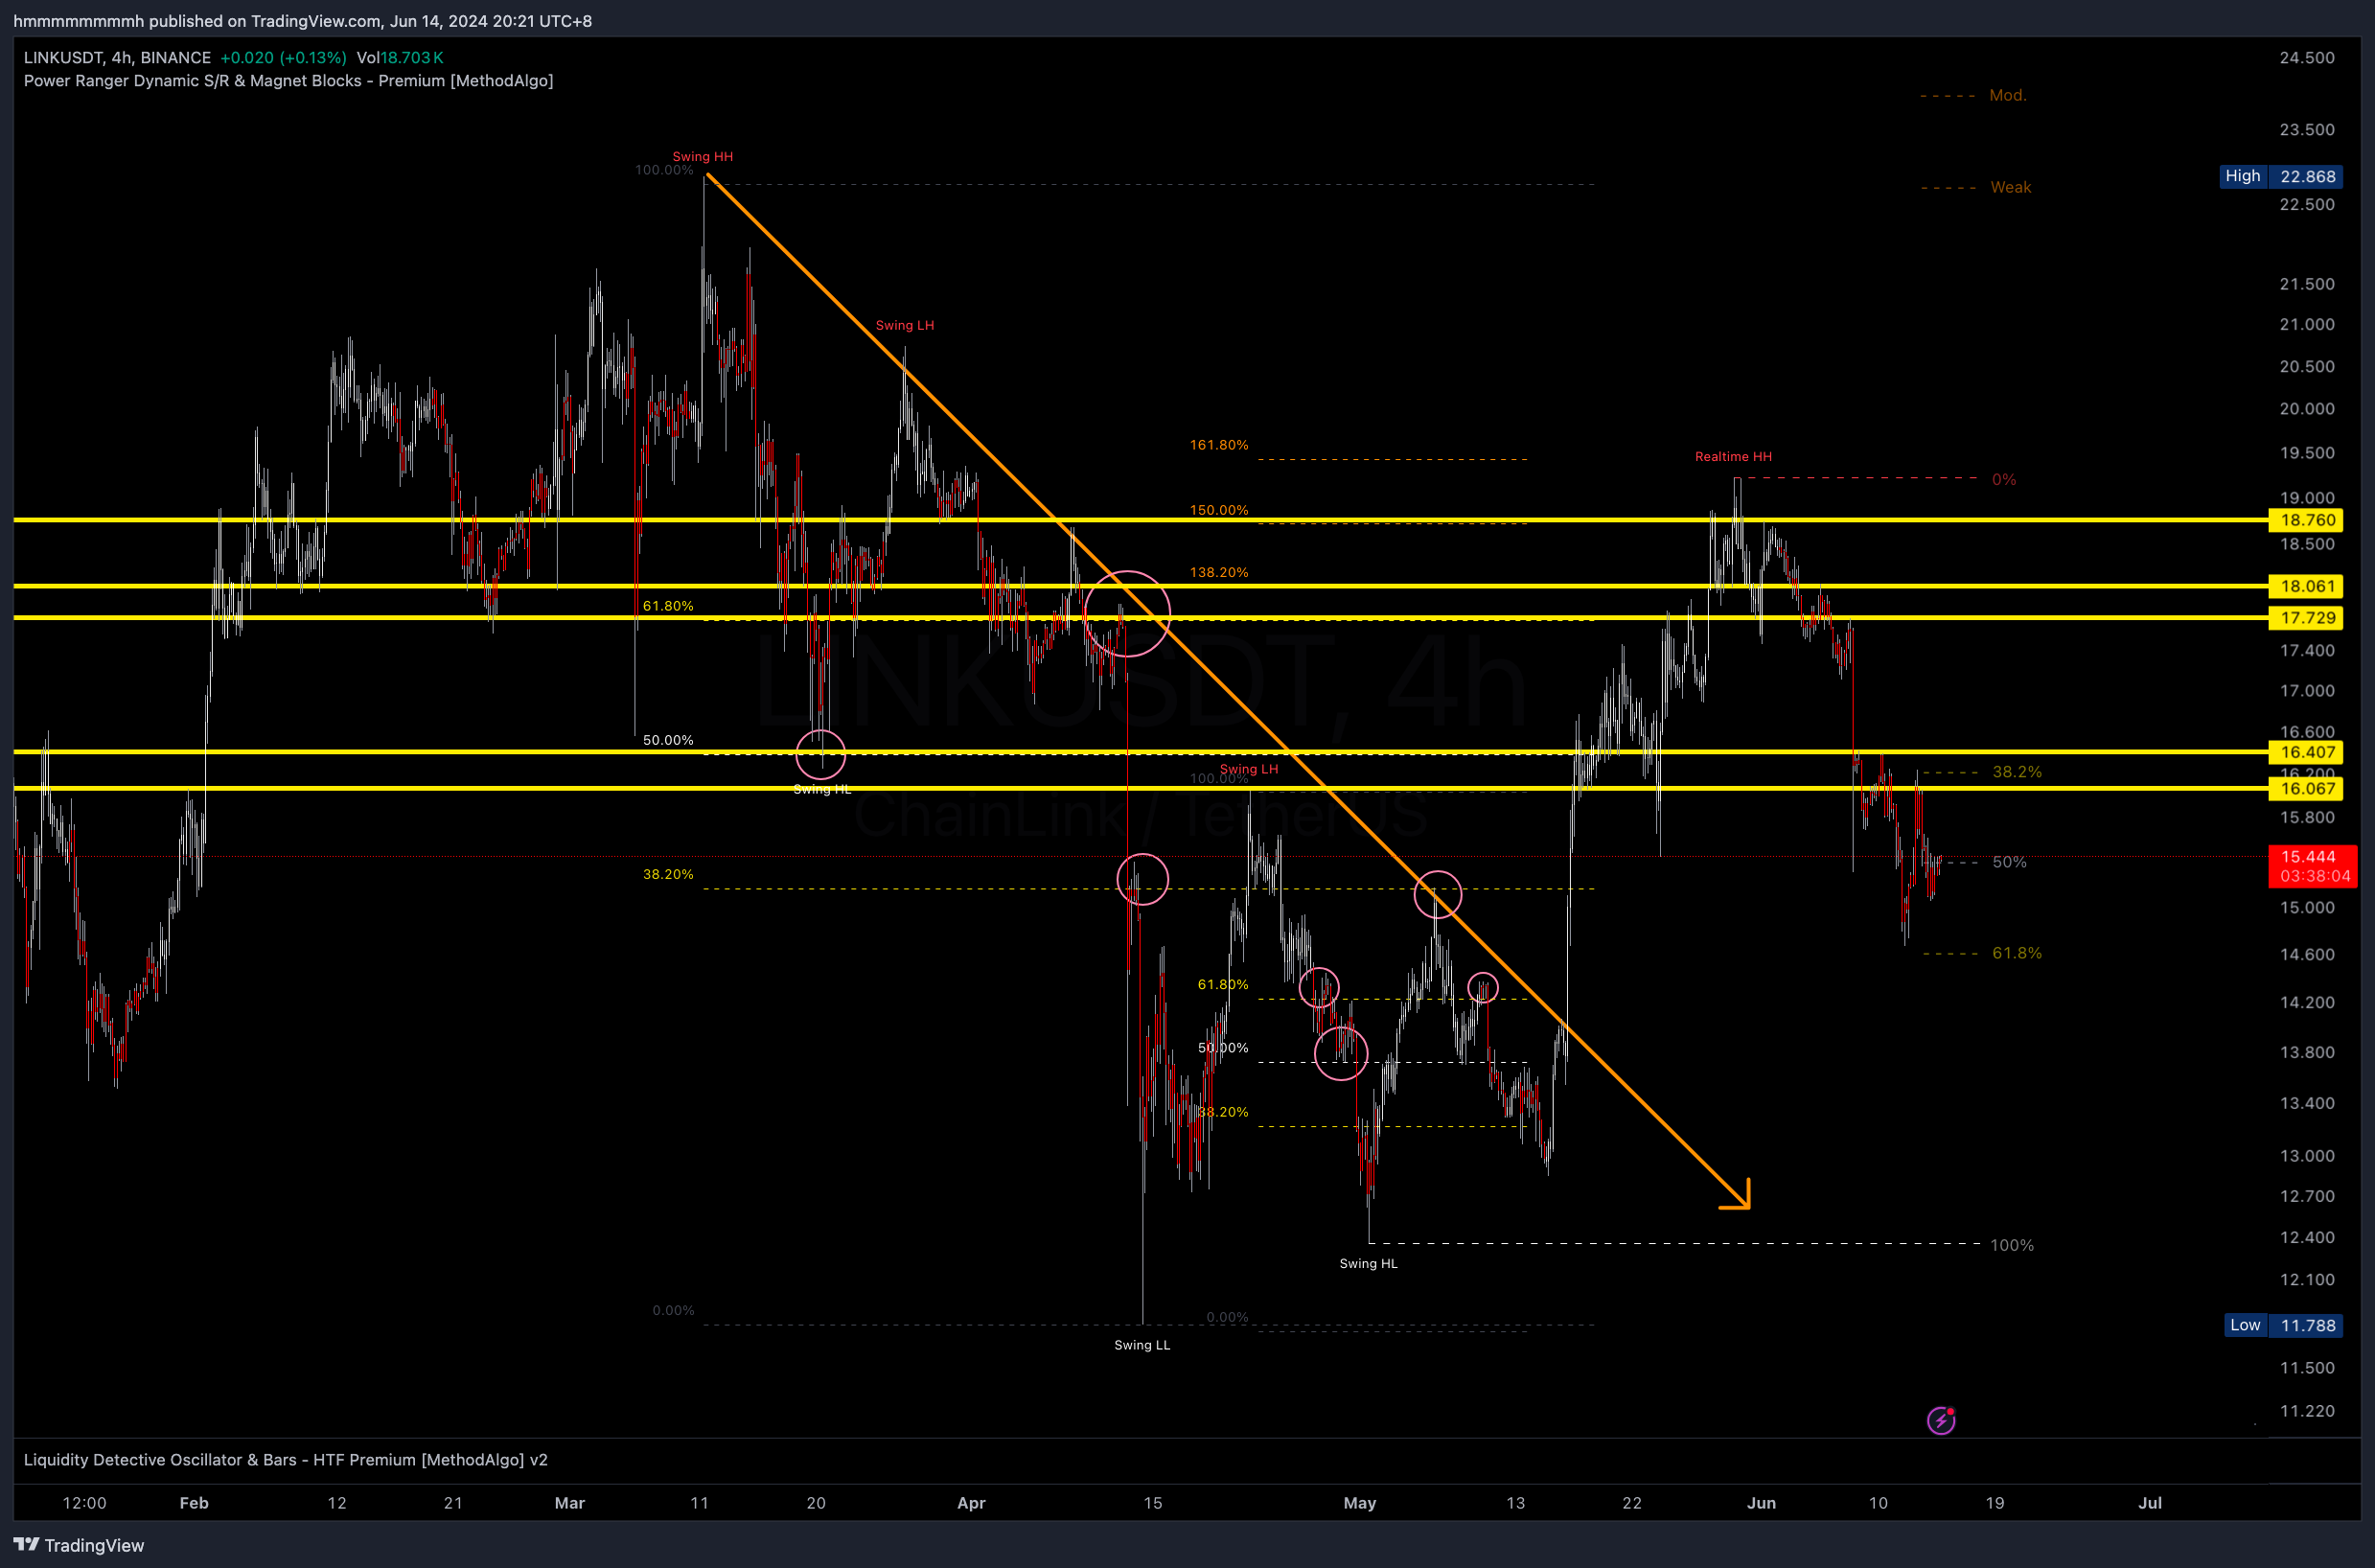 LINKUSDT 4h
Parameter Settings
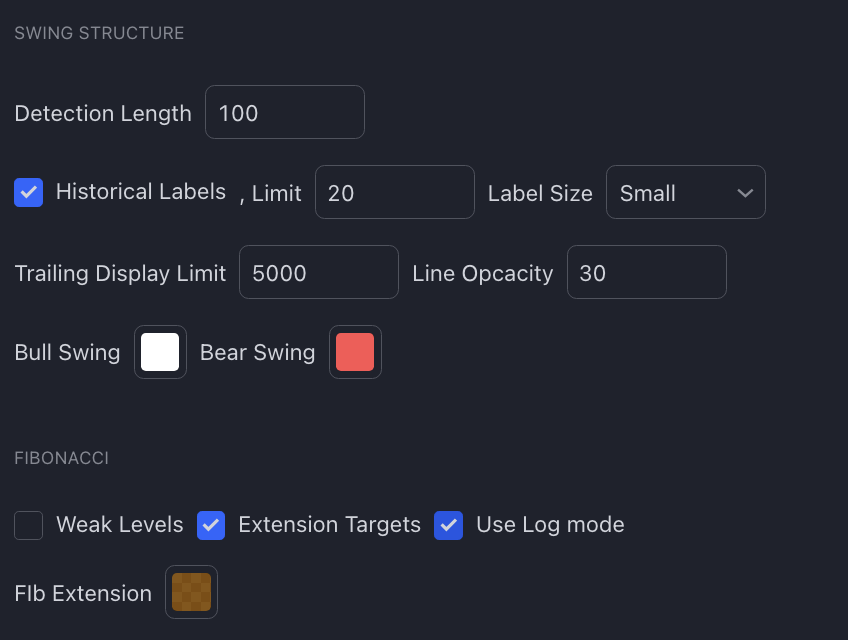
Swing Structure Settings
- Detection Length: Length for detecting swing highs and lows (default is 100 candles).
- Historical Labels: Display historical swing labels on the chart.
- Historical Labels Limit: Limit the number of historical labels displayed (default: 20).
- Label Size: Size of the swing labels.
- Line Opacity: Opacity of the lines (e.g., 30).
- Bull Swing Color: Color for swing low (support).
- Bear Swing Color: Color for swing high (resistance).
Fibonacci Settings
- Weak Levels: Show weak levels like 78.6%, 23.6%. Default is OFF.
- Extension Targets: Show extension levels. Default is ON, displaying 1.382/-0.382 (Weak), 1.5/-0.5 (Mid), 1.618/-0.618 (Strong), 2/-1 (Full).
- Use Log Mode: Use log mode. Enable this option if the chart is in Log Mode.
- Fib Extension Color: Color of Fibonacci extension levels.
Notes
- Swing Fibonacci automatically adjusts the 0% and 100% positions based on the uptrend and downtrend. 0% is at the bottom during a downtrend and at the top during an uptrend.
- This tool's Fibonacci automatically draws based on the latest real-time swing range. You may need to manually draw new Fibonacci levels to select different ranges for validation and further analysis.
- When the price breaks through the 0% or 100% levels, the latest swing range will be updated in real-time. Corresponding Fibonacci levels will also update in real-time. In such cases, traders should wait for the price to stabilize before taking retracement and extension levels of Fibonacci into analysis.
- Tool does not repaint. When the price creates new swing highs and lows, new swings will be marked as
Realtime HH/HL/LH/LLand fixed toSwinglabel after stabilized. - Swing Fibonacci may not be accurate when swing labels are
Realtime, as theseRealtimepositions may be refreshed with further price breakthroughs, causing changes in Fibonacci levels based on swings. During this state, the Fibonacci levels are predictions with potential bias until the Realtime label disappears. - MethodAlgo offer advanced and optimized Fibonacci tools, but Fibonacci trading is not our invention. Traders should be proficient with it, typically requiring reading multiple books to understand and utilize its concepts. Traders should not expect MA
@Staffto explain its specific use. If you unfamiliar Fibonacci strategies and concepts, disable theSwing Fibonaccitool in PowerRanger settings under FEATURES to avoid misleading bias until you do. - Analysis results, like all other tools, should be validated with complementary tools to build confidence, rather than relying on a single signal.
The engineers at MethodAlgo are proud of their work, but it's essential for you to understand that no indicator / algorithm can guarantee perfect success. Trading profits and losses are greatly influenced by the trader's psychology, knowledge, experience, and risk management.
The algorithmic interfaces we provide are all part of T.A.T.A. When trading in reality, traders should make their decision like T.A.T.A, considering various factors and signals from other tools to establish confluence system.
Any unclear explanations or errors in this tutorial? Please contact MethodAlgo's @Staff on the Discord Trading Terminal for corrections.