Stop Hunt

Concept
The StopHunt tool is a reverse trading tool designed to identify potential stop-loss hunting phenomena in the market. Based on the market's inherent tendency to target high-leverage positions, this tool helps traders identify potential concentrated stop-loss areas to avoid getting stopped out and to profit from this market behavior.
The algorithm records market highs and lows through Pivot point detection. These points serve as the basis for potential stop-loss hunting areas. By analyzing these pivot points and the current market volatility (ATR), the tool detects and marks key price areas. These areas are typically where the market price might trigger remarkable stop-loss orders.
Once a key price area is detected, the StopHunt tool first displays a yellow horizontal line, known as the "StopHunt Line." When the price approaches and breaks through this line, the system displays a yellow StopHunt zone. This zone represents a potential stop-loss hunting range. When the price enters this zone, market volatility usually slows down. Traders can observe which side the price exits the zone from to determine the subsequent direction. In most cases, the price may reverse, and a reverse stop hunting occur.
Difference Between StopHunt and GrimReaper
While both StopHunt and GrimReaper are categorized by liquidity strategy , they have distinct differences:
- Data Source: GrimReaper calculates predicted liquidation levels based on exchange data, whereas StopHunt predicts possible concentrated stop-loss positions based on market structure.
- Function and Purpose: Both liquidation forced orders and stop-loss orders triggers Market Order. and have similar effects on the market. GrimReaper provides more comprehensive liquidity information, covers a broader observation range, and includes rich and powerful derivative trading strategies for predicting large-scale liquidity clearances. The StopHunt tool, however, offers more concise and user-friendly signals, making it suitable for combining with other analysis tools to become part of a trading strategy, primarily for short-term structural traders.
How You Can Use It
- Risk level reference
- Entry level references
- Observing and predicting price reversals
Interface
- Text Labels:
stophunt 4 (for) buyer/seller, whereseller(short position) appears above the price, andbuyer(long position) appears below the price. Text labels can be turned off in the settings. - StopHunt Line: The StopHunt line is not displayed initially because many StopHunt levels exist, but not all are important enough to be marked. The StopHunt algorithm only prints the line when the level is significant and a StopHunt phenomenon is anticipated. The StopHunt line is a solid line before the time point and an extended dashed line afterward until the price breaks through this dashed line, at which point the StopHunt zone appears.
- StopHunt Zone: The algorithm continuously detects price fluctuations in the StopHunt zone and dynamically adjusts the zone size based on volatility. When the price exits the zone, it indicates the end of the StopHunt. The StopHunt zone is also an observation area, where traders watch the direction of the price exit to determine the subsequent direction.
Strategy
The StopHunt algo references multiple aspects and factors relative to other tools in PowerRanger. Since over-explaining the algorithm will not help much with usage analysis, we introduce the strategy based on price reactions.
Phase
When the algorithm detects and prints a new StopHunt line on the chart, the future price action may unfold as follows:
- Baits: The price immediately rebounds, attracting more liquidity to the StopHunt line level (encouraging retail traders to place stop-losses there).
- StopHunt: The price starts returning to the StopHunt line and breaks through it.
- StopHunt End Reversal/Continuation: By observing which side the price exits the StopHunt zone from, traders can determine whether the price will continue in the current direction or reverse. Specifically:
- Price exits cleanly in the opposite direction of the StopHunt zone, and the zone stops expanding: The price reverses and heads towards the opposite StopHunt zone.
- Price continues through the StopHunt zone: The current direction continues. However, it doesn't mean there won't be a reversal later, and other analysis tools should be used to analyze subsequent trends.
Reversal Strategy
- Entry: As described in the Phase, traders generally get two reversal signals after the StopHunt line appears, during 1. Baits and 3. StopHunt End Reversal/Continuation stages. The Baits stage is simpler for judgement, while the StopHunt end reversal is more challenging as it requires waiting for the candle to exit the StopHunt zone cleanly to increase reversal bias.
- Take Profit: The TP target for both reversal signals is the opposite StopHunt line. If there is no StopHunt line on the other side, rely on other tools for reference.
- Stop Loss: Most Baits stages involve a direct reversal, but there are cases where the reversal starts after breaking through the StopHunt line. Place stop-losses at the pivot highs or lows behind the StopHunt line. For StopHunt End reversals, place stop-losses at the zone boundary.
Examples
Traders can backtest on their own charts. The StopHunt tool's reversal strategy is generally high in success rate. Here, we highlight its failures and risk scenarios.
Backtest Effectiveness
In the examples below, we marked the Phase stages: Baits Reversal, StopHunt End Reversal, and StopHunt End continuation.
There are 9 successful reversal opportunities and 3 continuation cases. to note that the continuation with the red boxes represent normal expectations, not strategy failures, as described in Phase and Reversal Strategy. When the price enters the StopHunt zone, traders should observe the candle's exit direction to judge a reversal and increase bias.
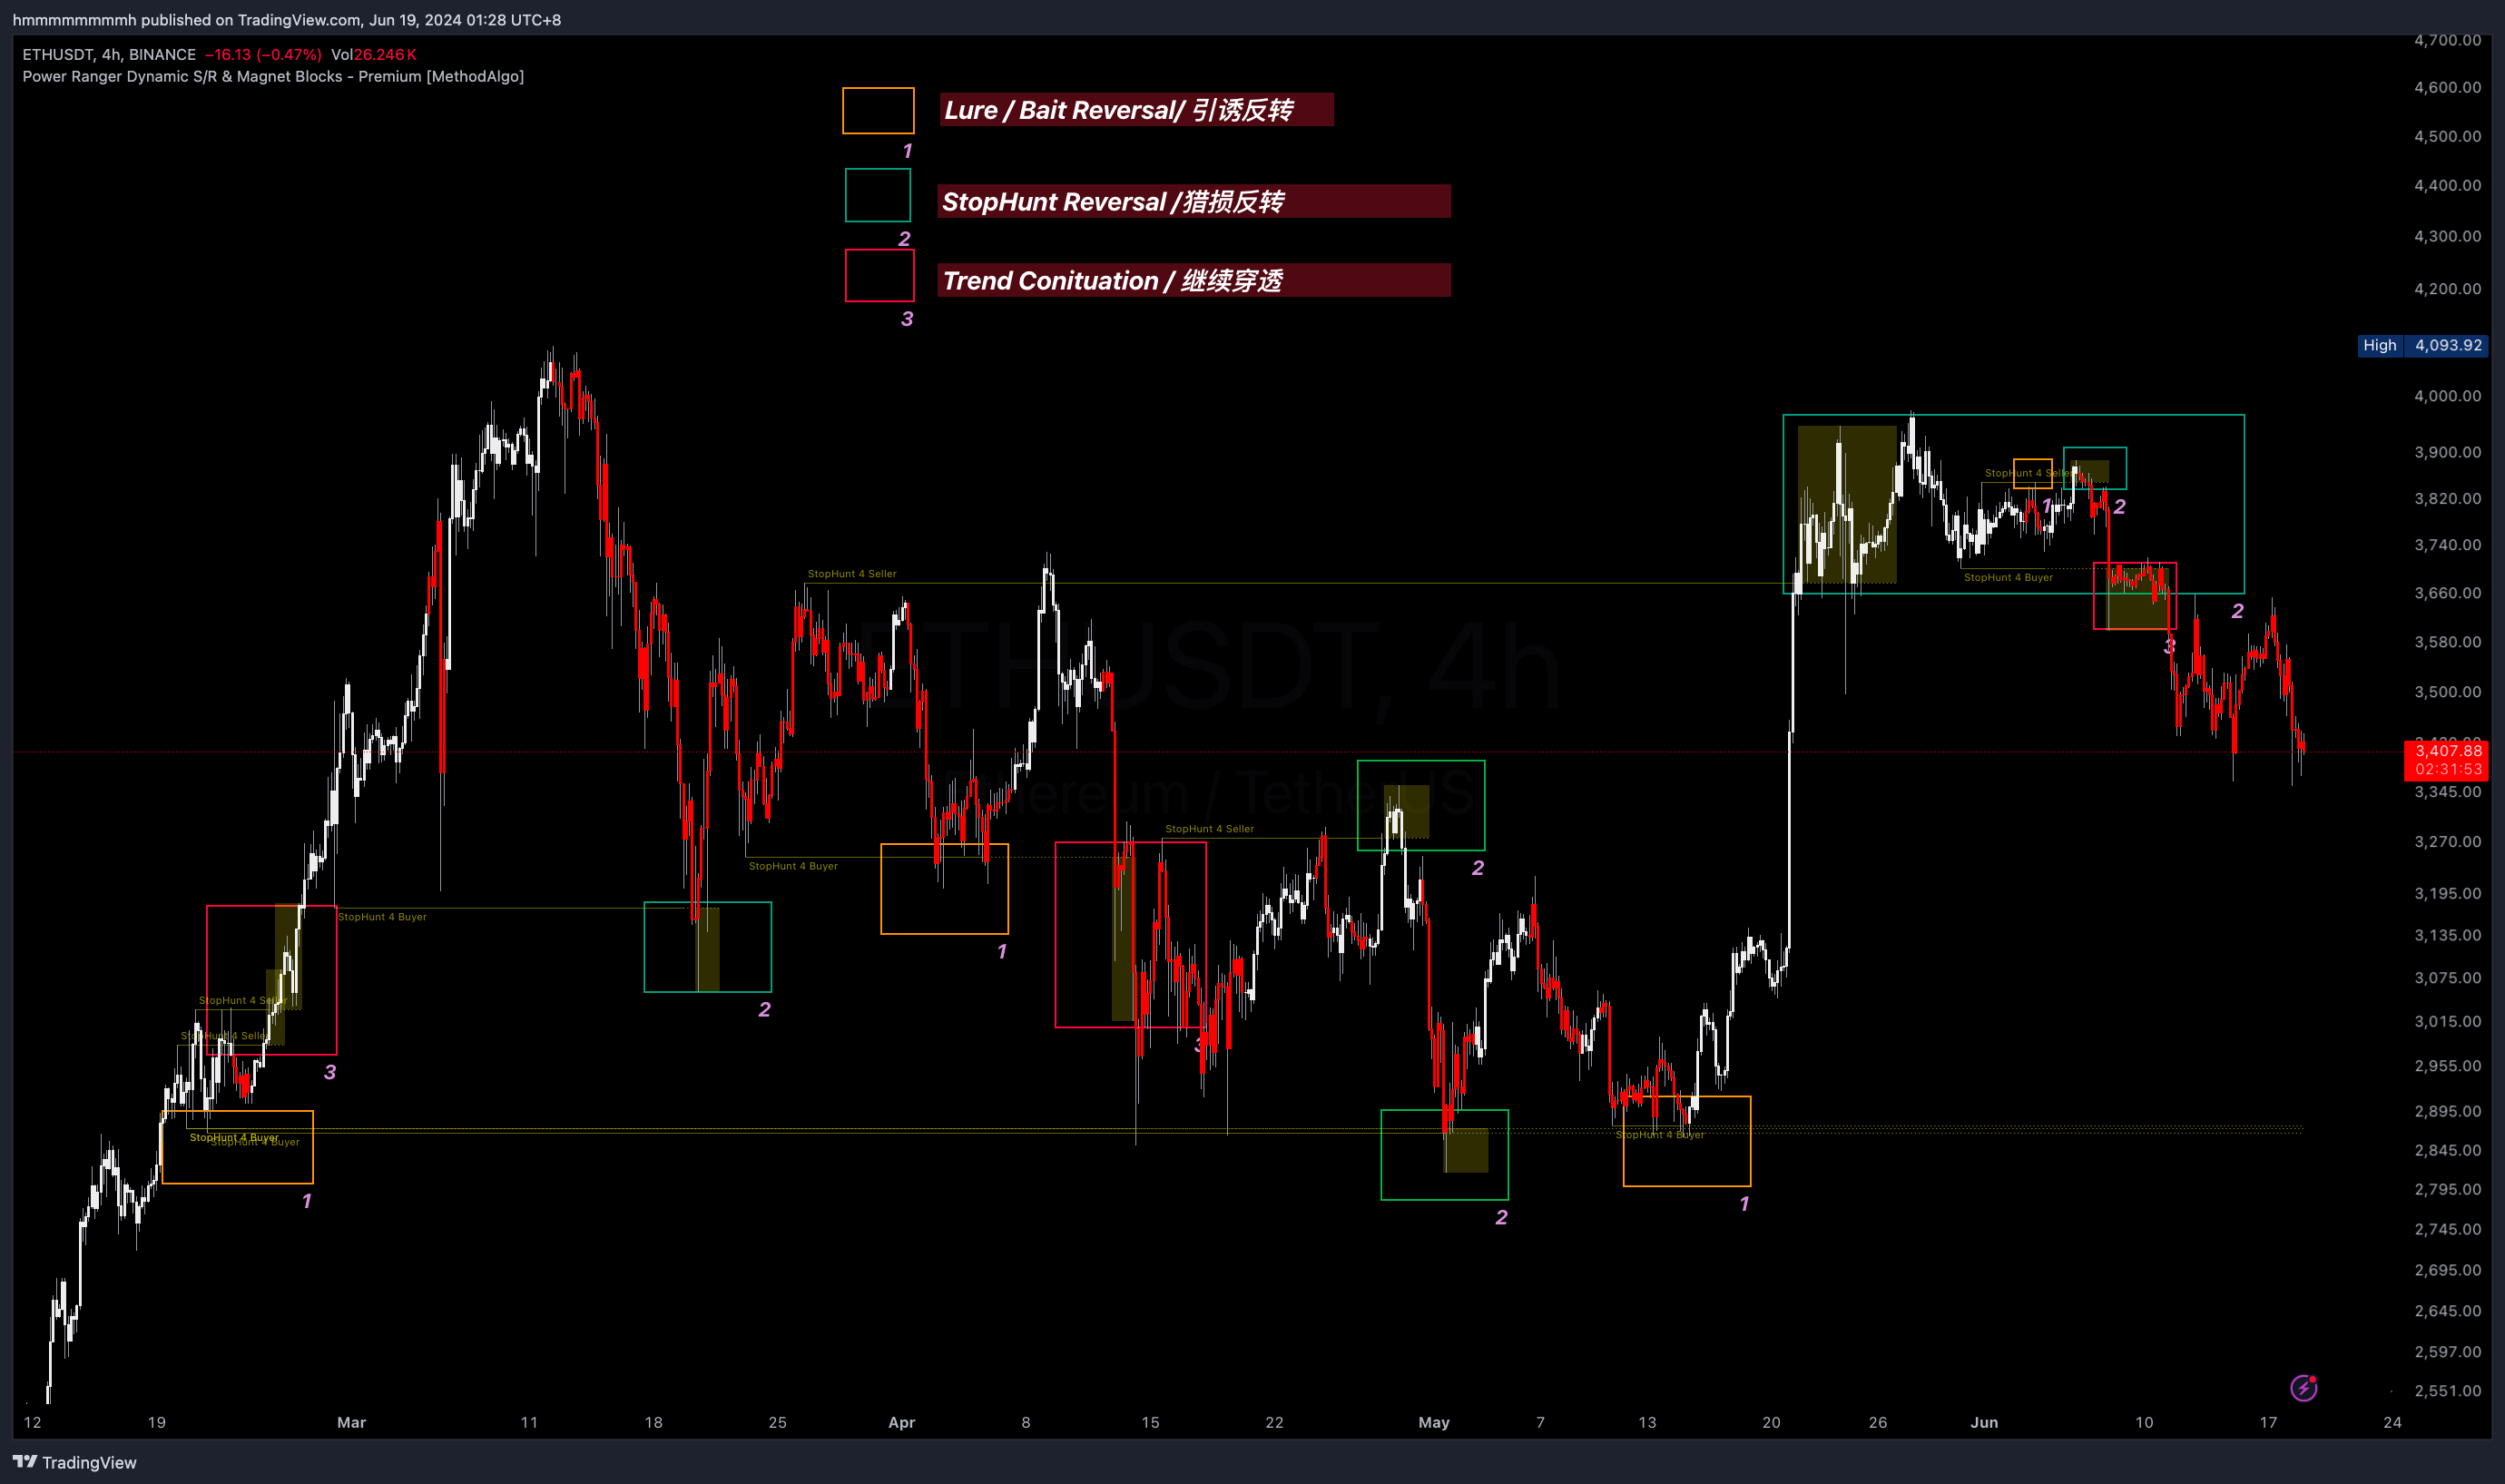 ETHUSDT 4H
Continuation
The example below reminds traders that while the StopHunt line may be a potential support/resistance level, avoid using them strictly for stop-losses because multiple consecutive StopHunt instances may occur, penetrating several zones at once. Remember:
- The StopHunt line is intended to be penetrated by the price later, not to prevent it.
- The StopHunt zone edge can be a short-term stop-loss reference level only after it stops updating (when the price leaves the zone successfully and reverses).
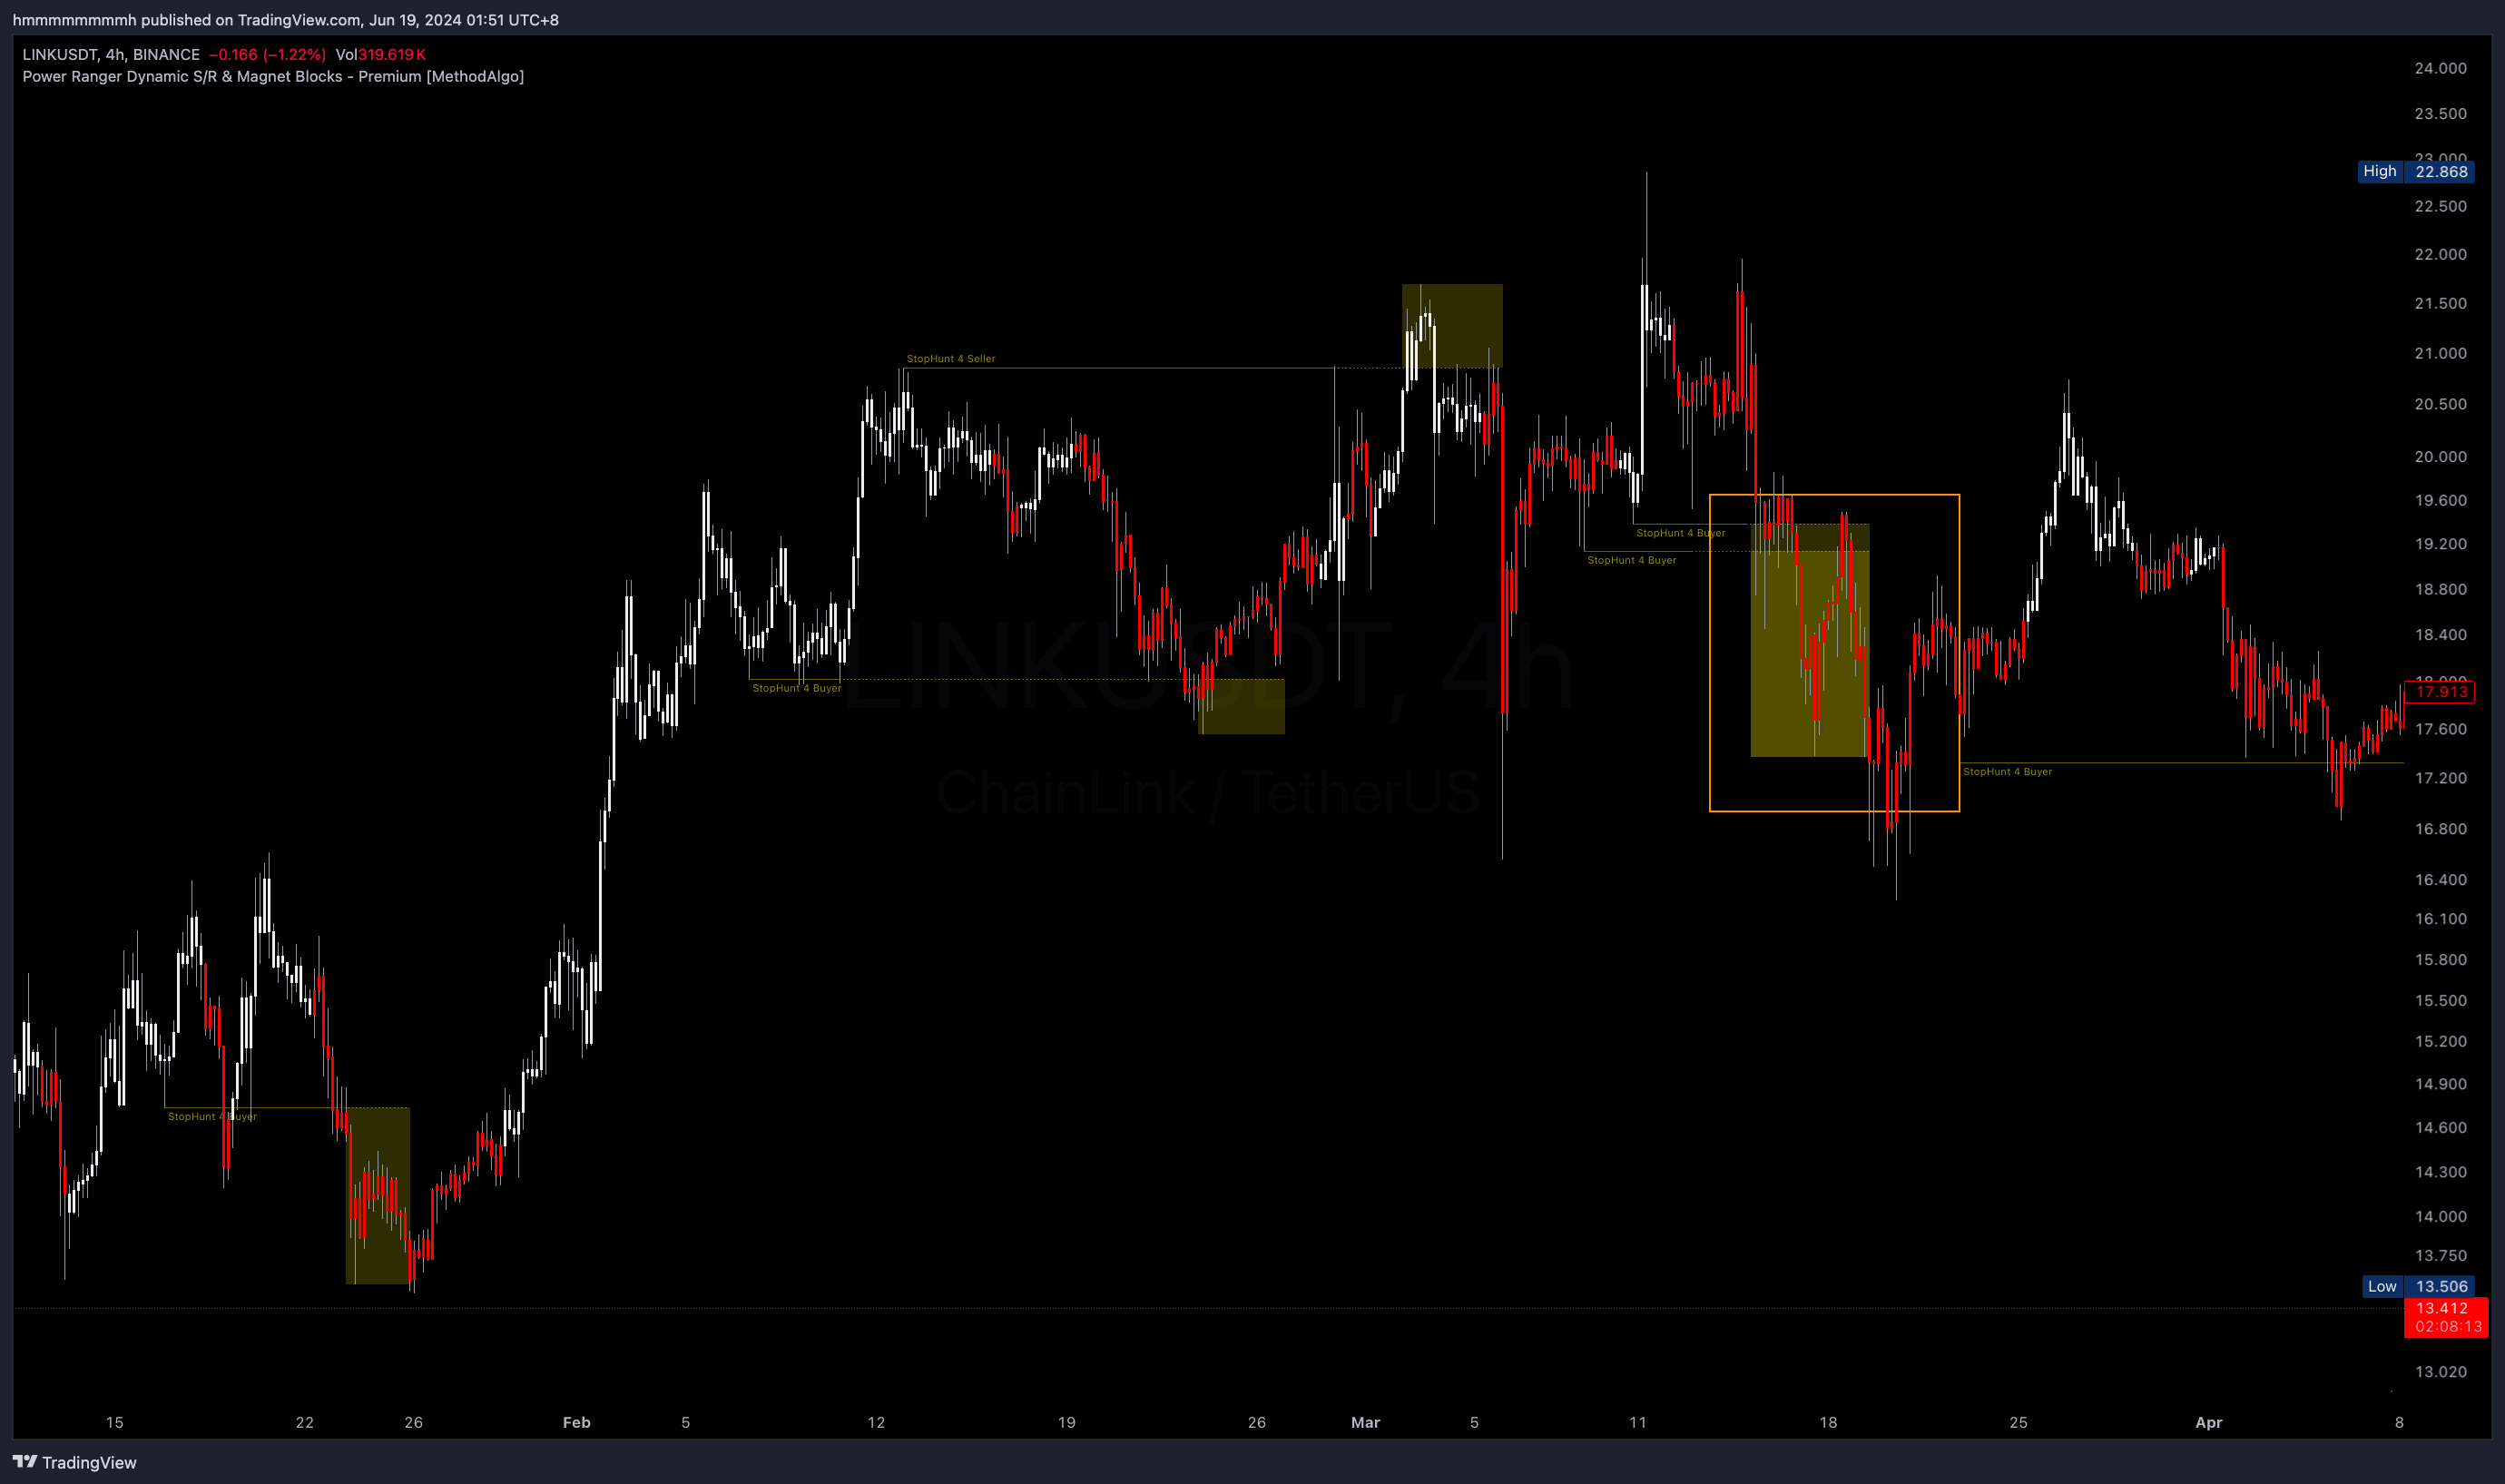 LINKUSDT 4H
Reversal Magnitude
As mentioned in Notes, reversal signals only indicate short-term price reversals without trend bias. Predicting trend and accurate TP targets may require other tools from our arsenal.
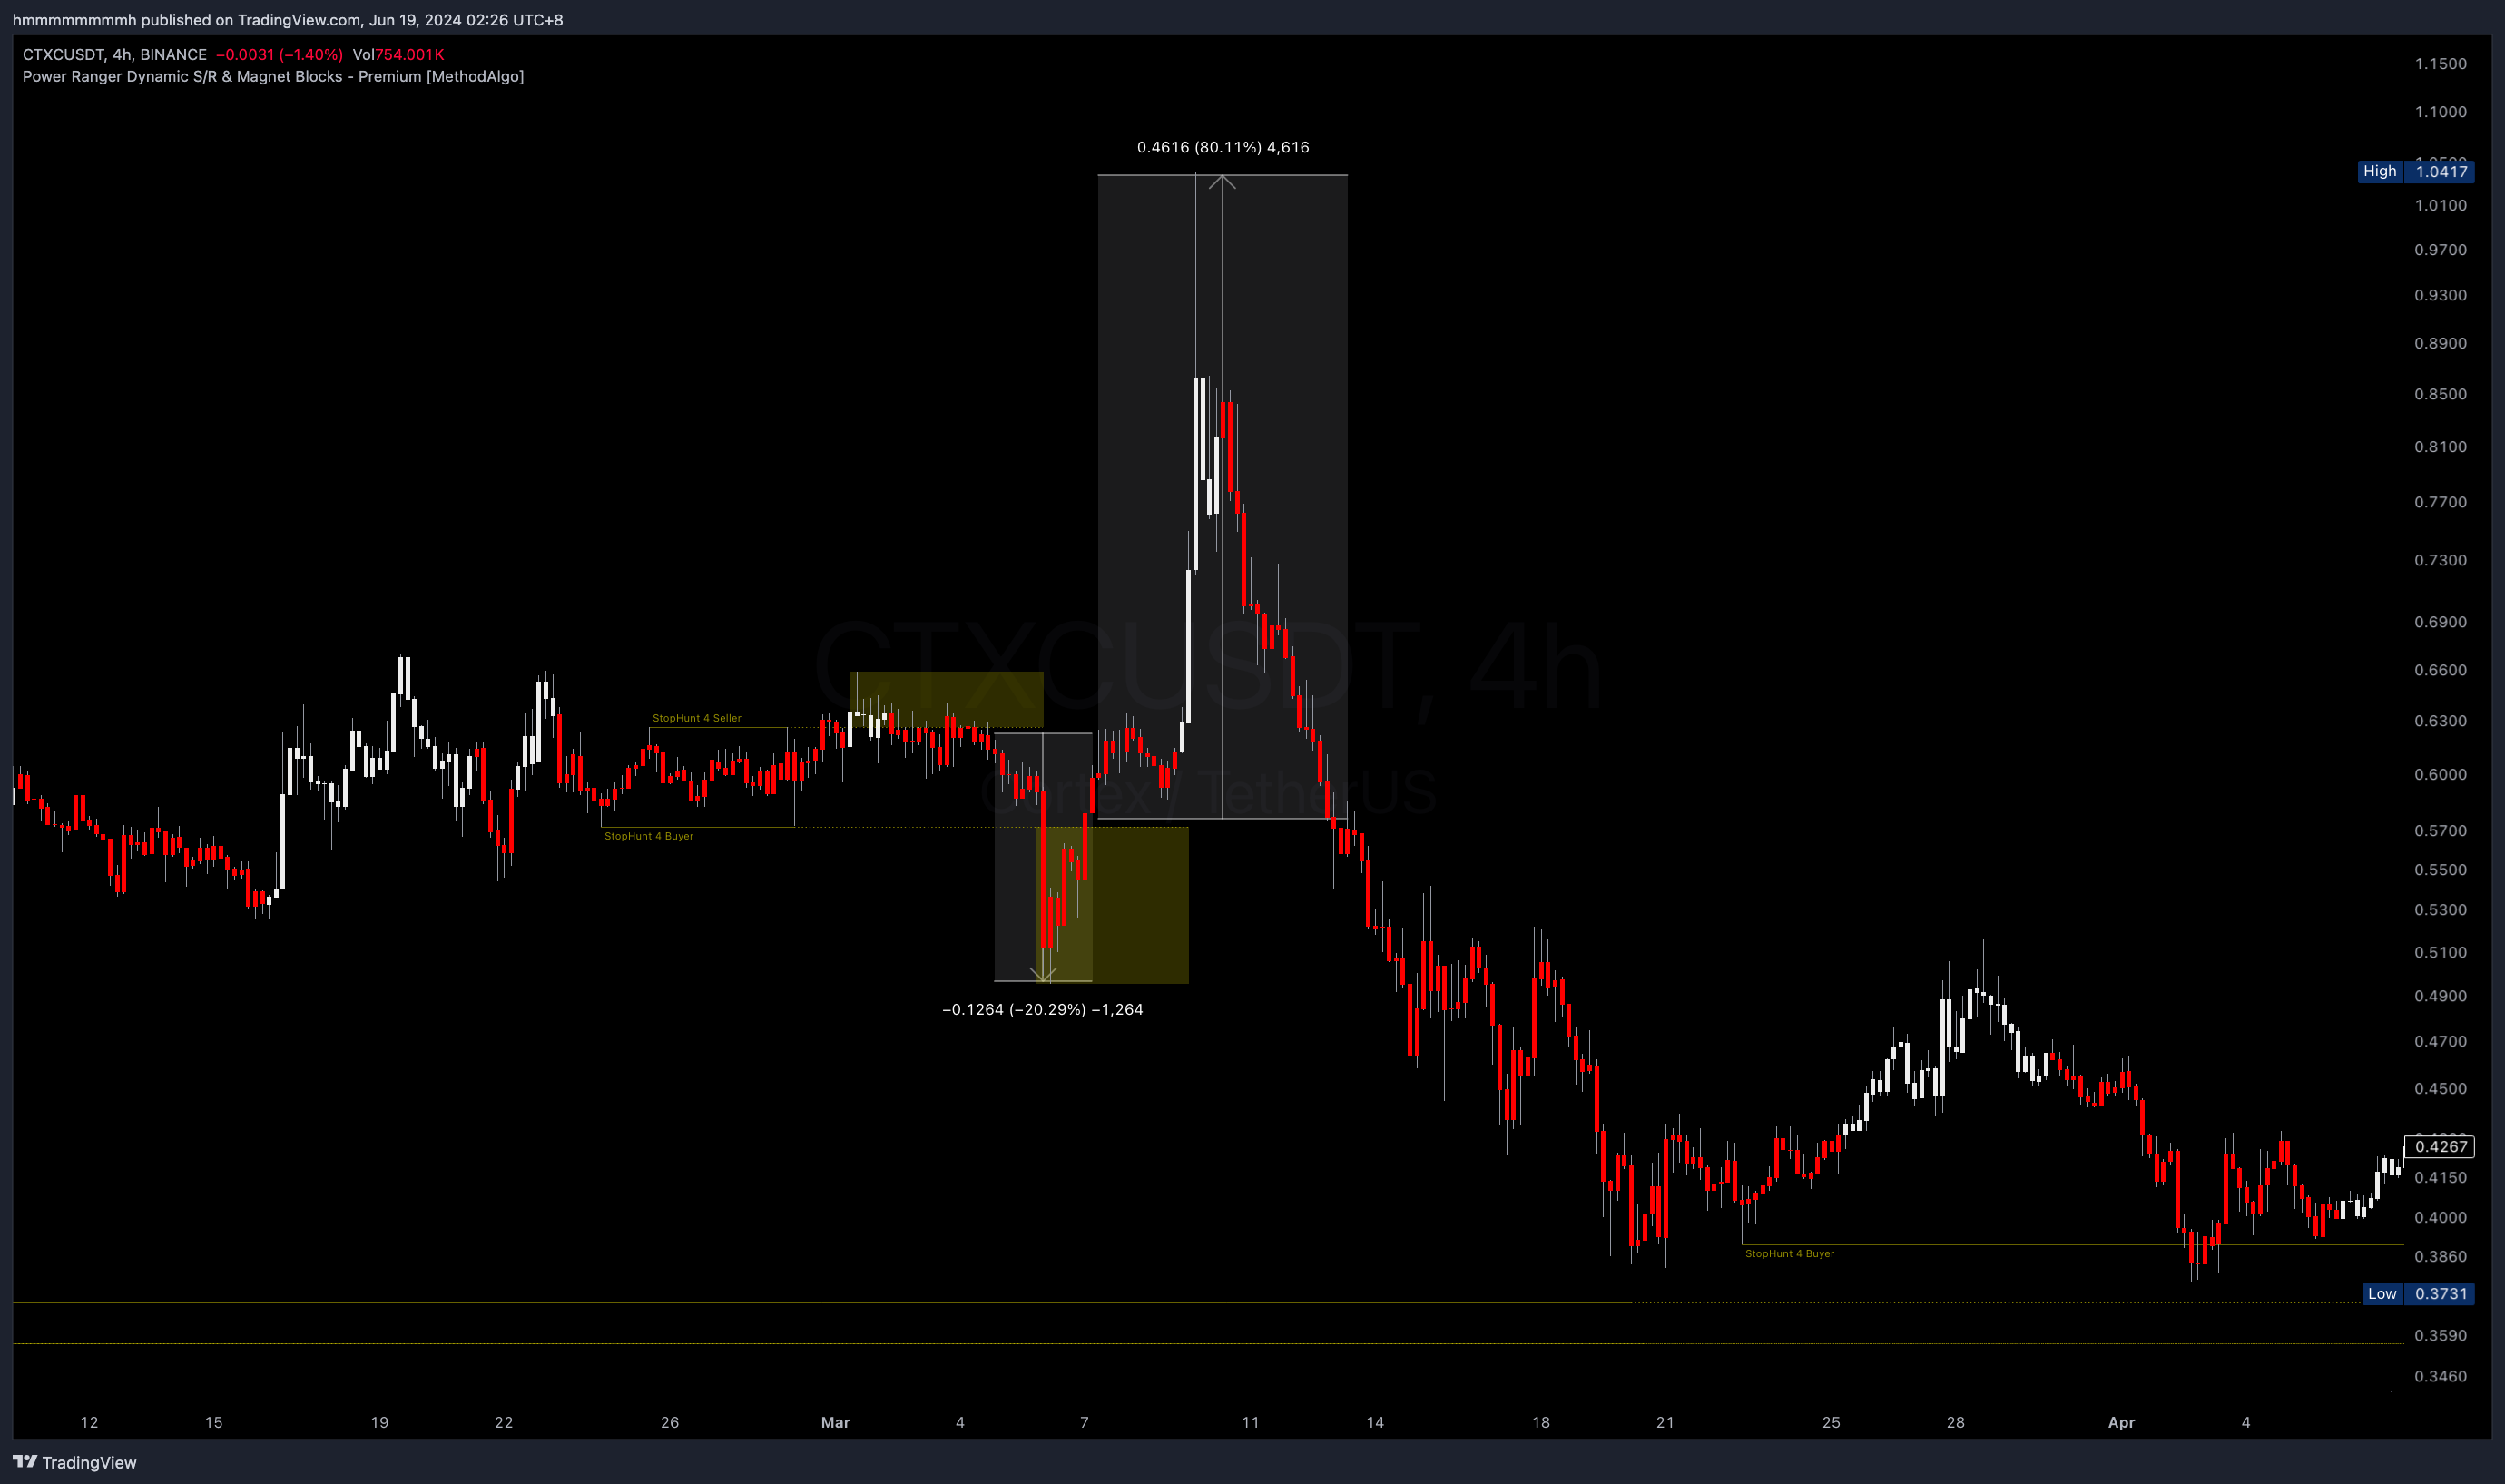 CTXUSDT 4H
Ambiguous Signals
Although rare, the example below identifies some challenging signals. In such cases, interpret as follows:
- Mark1 StopHunt Zone Reversal: Traders can use the line at mark1, i.e., the StopHunt line edge, to increase reversal bias when the price breaks through it.
- Mark2 Continuation Reversal: As described in Phase, price penetrating the StopHunt zone doesn't mean there won't be a reversal later. Traders can increase reversal bias when the price breaks through the StopHunt line in the opposite direction (only when price hasn't stayed outside of zone for too long).
- Mark3 Consecutive Penetration False Reversal: Mark3 shows three consecutive StopHunt zone penetrations. During the second one, it seems like a reversal occurs with the candle exiting the StopHunt zone cleanly, but proven false later. The candle didn't actually break through the edge of the first StopHunt zone, so it's still considered within the zone.
Mark2 and 3 also demonstrate that the StopHunt Continuation case shouldn't be seen as an entry signal. The price may continue moving a lots after penetration, but not because of the StopHunt concept. The tool only provides directional bias around the StopHunt zone and line.
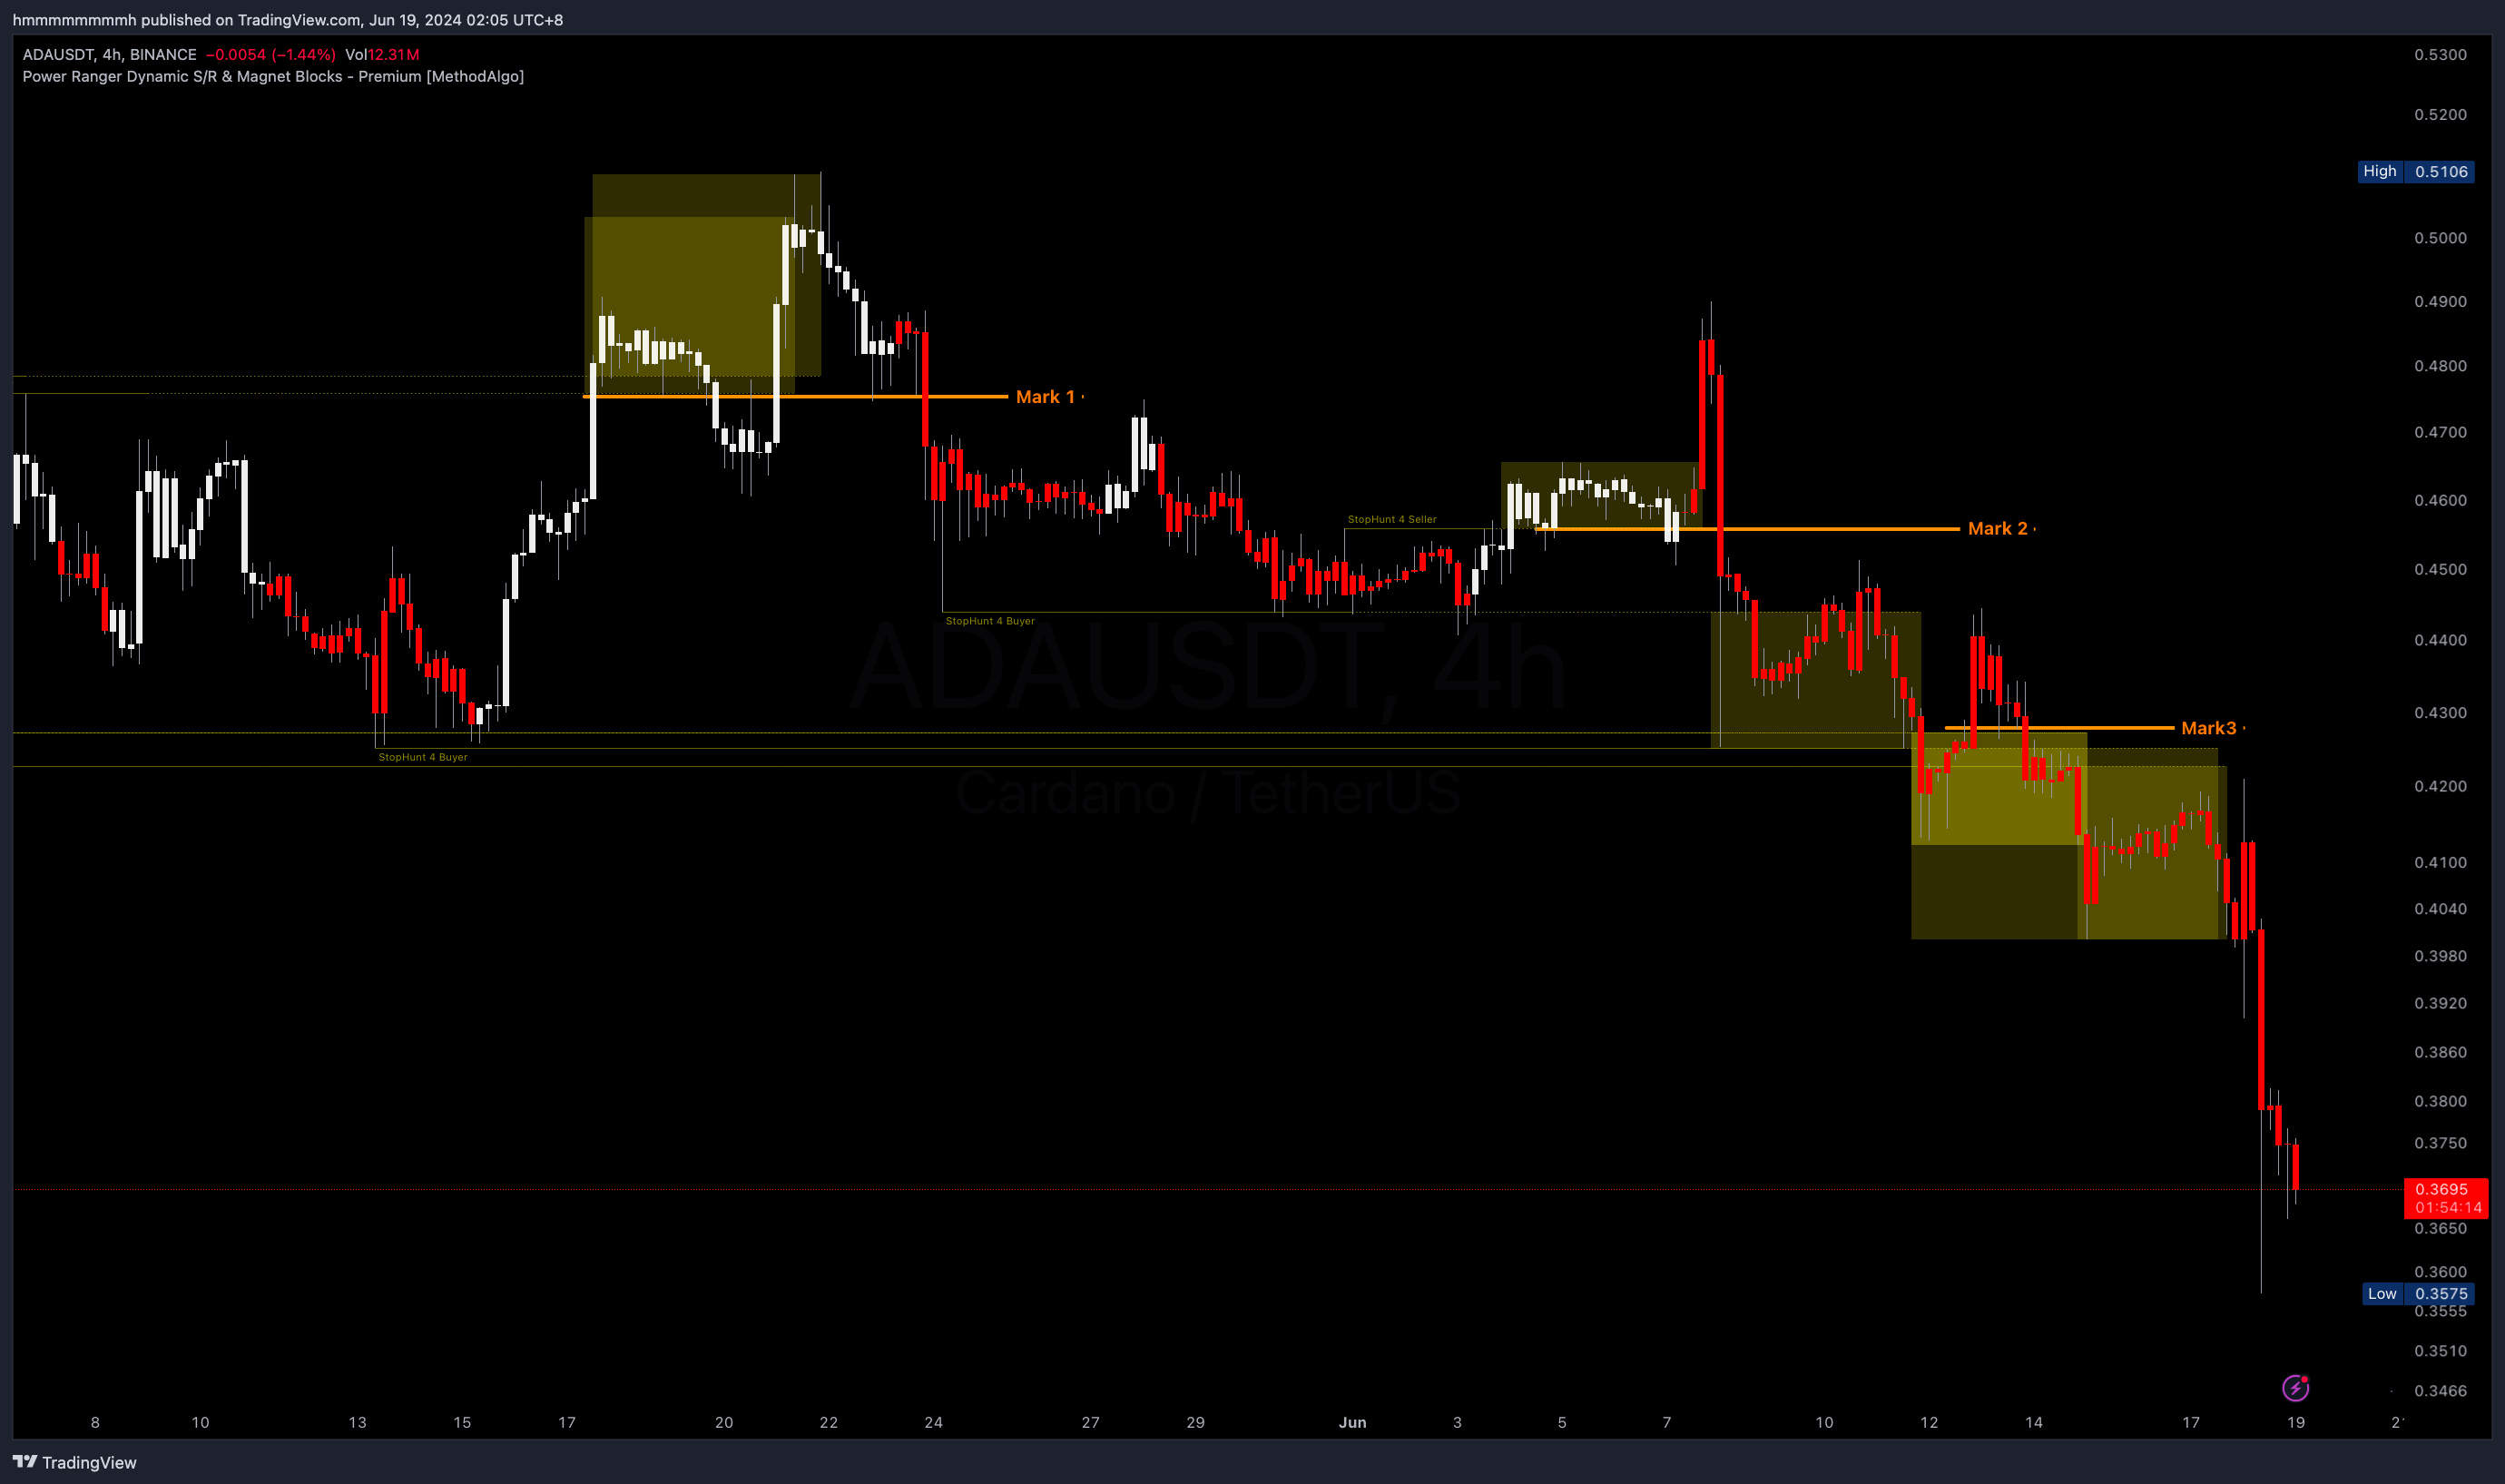 ADAUSDT 4H
Parameters
The StopHunt tool is parameter-heavy, so only settings related to aesthetics and display limits are provided.

- Hide Label: Hides
stophunt 4 buyer/sellertext labels for a cleaner interface. - Mode:
Presentonly shows recent StopHunt zones, whileHistoricaldisplays past zones. Using recent zones is recommended as historical ones don't aid future analysis. - Display limit for both sides: Sets the maximum number of (upper and lower) StopHunt zones to display.
- Clear hunted zone after: Deletes the StopHunt zone a certain number of candles after its appearance to keep the interface clean.
- Stophunt against seller: Color for short StopHunt lines/zones.
- Stophunt against buyer: Color for long StopHunt lines/zones.
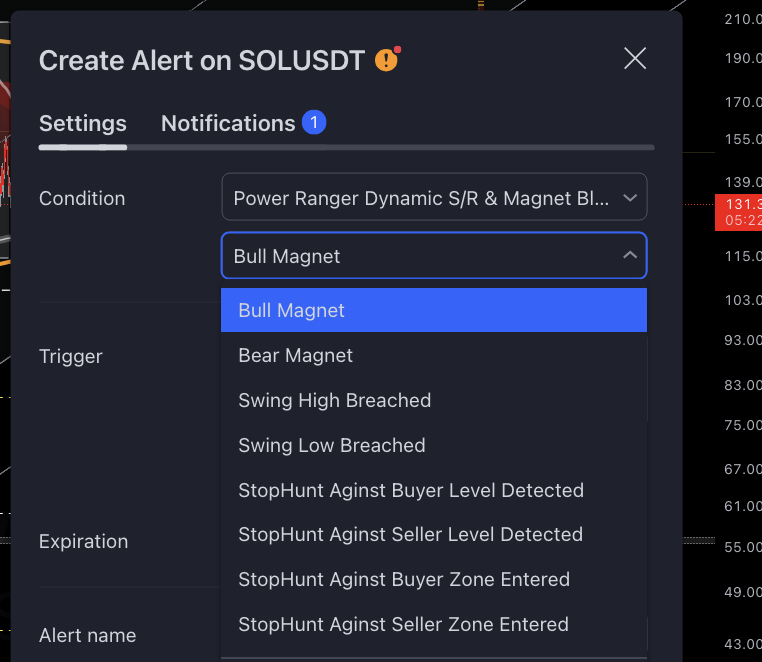
Alert
Trader can set alert for following moment for their favorites assets in tradingview:
- Stophunt line detected
- Price entered stophunt zone
Notes
- Sometimes the Baits and StopHunt stages are completed together.
- This strategy only provide reversal opportunities. Predicting post-reversal price movements may require additional tools like Fibonacci or Magnets for determining TP targets.
- StopHunt zone reversals are price reversals, not trend reversals. Default expectation are within the structure, not the swing.
- When price enters the StopHunt start consolidating while your current position is in loss, curb your reversal bias. The zone size might change bigger, and could end up with continuation case. Only when the price exits the stophunt zone does it meet the reversal conditions. The correct approach is to close or reduce the position to protect assets, then observe for re-entry opportunities.
- The StopHunt tool has opportunistic attributes, so combining it with the Liquidity Detective's reversal signal will yields better results.
- Price re-enters a Used StopHunt zone, provide no aid in future analysis.
- The size of the StopHunt zone dynamically adjusts based on price volatility but has a maximum range.
- The reversal strategy, when used properly, also serves as an excellent signal for stopping price declines or increases.
The engineers at MethodAlgo are proud of their work, but it's essential for you to understand that no indicator / algorithm can guarantee perfect success. Trading profits and losses are greatly influenced by the trader's psychology, knowledge, experience, and risk management.
The algorithmic interfaces we provide are all part of T.A.T.A. When trading in reality, traders should make their decision like T.A.T.A, considering various factors and signals from other tools to establish confluence system.
Any unclear explanations or errors in this tutorial? Please contact MethodAlgo's @Staff on the Discord Trading Terminal for corrections.