Smart-Cloud & Trendline
Concept
SmartCloud is an essential tool within the MethodAlgo dynamic support and resistance toolset. Utilizing professional institutional parameters, it constructs a system combining price and volume moving averages, providing traders with a powerful, practical, and innovative method of analysis. SmartCloud and its trendlines not only offer crucial horizontal information but also have significant trend analysis value due to their patterns. The analyzed signals exhibit high stability and reliability, making them suitable for all market and timeframes.
Additionally, SmartCloud and trendlines are ideal complements to other tools in the PowerRanger indicator system. Unlike most custom Bollinger Bands or crossover-based trend indicators on the market, the SmartCloud and trendline system is characterized by no resistance in an uptrend and no support in a downtrend, avoiding the ceiling expectations brought by resistance/support calculated based on historical volatility.
For trend traders, this feature amplifies and liberates the risk/reward (RR) ratio, reducing misjudgments of reversal trades. For reversal traders, it offers a new method of SmartCloud pattern analysis to identify reversal and dip signals.
You Can Use It For
- Support and Resistance
- Trend Analysis
- Pattern Prediction
Interface
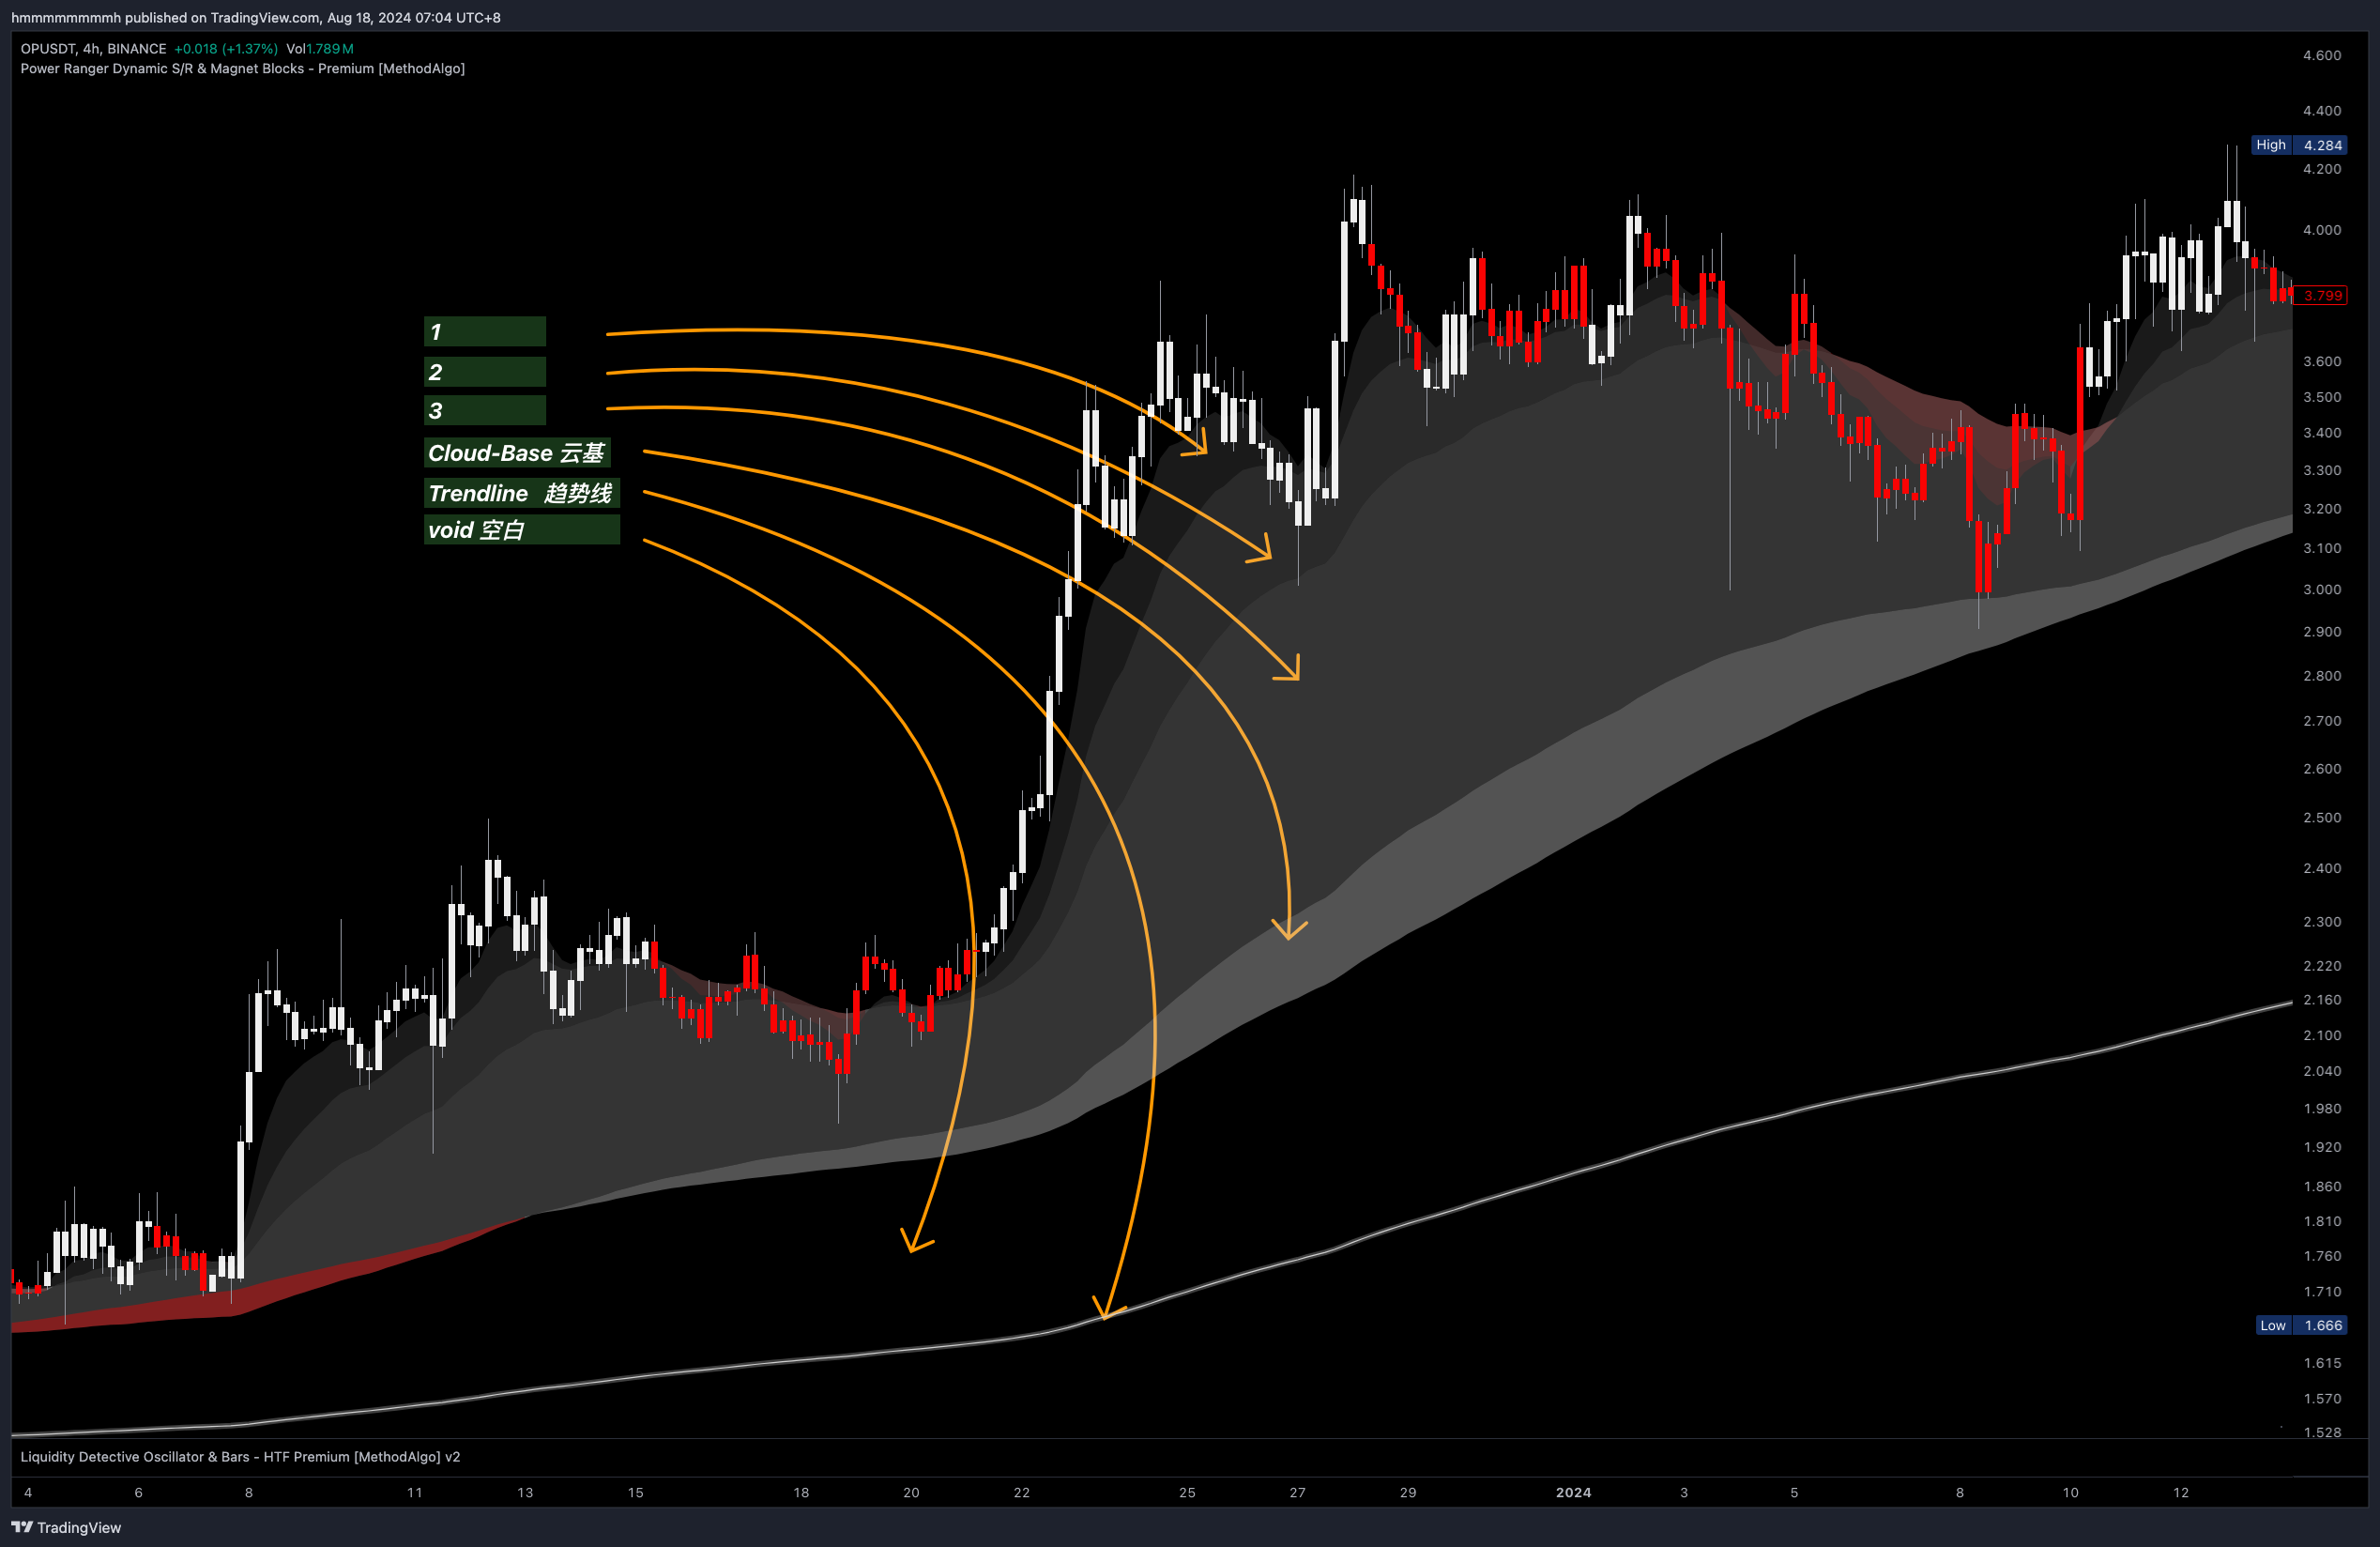
Cloud: Composed of three layers of clouds (collectively referred to as the Cloud) andCloud base. White indicates an uptrend, red indicates a downtrend.Trendline: A neon-colored thick solid line. When the price is above the trendline, it is white; when the price is below, the trendline is red.Void Area: A colorless area between the Cloud and the Trendline, existing in strong uptrends/downtrends.
Support and Resistance
The Cloud, cloud base, and Trendline naturally serve as support and resistance. In an uptrend, the Cloud acts as white support, and in a downtrend, it serves as red resistance. The levels of support and resistance are ranked from low to high as follows:
-
Cloud Layers 1 and 2 - Impulsive Support/Resistance
- The first two layers are collectively known as the Cloud Edge. The first layer is frequently touched, penetrated, or tested by the price, while the second layer supports the first.
- After impulsive moves or wicks outside of
Cloud Edge, the market often adjusts the price back to it.
-
Cloud Layer 3 - Volatility Support/Resistance
- The third layer is usually the thickest. After an impulsive move, the price’s highs/lows often begin to operate within this layer.
- Candle trapped between the
Cloud Edgeand thecloud basesignal early trend contraction (but not trend termination). - If the
Cloud Edgebegins to flip at the third layer, forming new counter-support/resistance, it may indicate a trend reversal or retracement. - Avoid placing stop-losses here, as Cloud Layer 3 is the normal fluctuation zone for price.
-
Cloud Base - Minor Trend Support/Resistance
- The
Cloud Baseis strong support/resistance. It should remain white in an uptrend and red in a downtrend. - A color change without breaking the
Trendlineis evidence of price contraction, forming a Golden Pit pattern. - In long-running uptrends or downtrends, the
Cloud Base area is a premium entry point for dips, usually offering 1-2 opportunities per trend.
- The
-
Trendline - Major Trend Support/Resistance
- The
Trendlinemarks the highest level of support/resistance and is a primary indicator of bullish/bearish bias. - Prices above the
Trendlineindicate an uptrend; prices below indicate a downtrend. - In an uptrend, dips that do not break & hold the
Trendlineare considered retracements; in a downtrend, rallies that do not break & hold theTrendlineare considered just bounces. - After a prolonged uptrend or downtrend, the first attempt to break the
Trendlineis usually rejected. - In long-running uptrends or downtrends, waiting for a dip to the
Trendlineoffers the best entry point, usually providing 1-2 opportunities per trend.
- The
Trend Patterns
Traders can identify key trend and directional signals through the interaction of the Cloud, Cloud Base, Void Area, and Trendline.
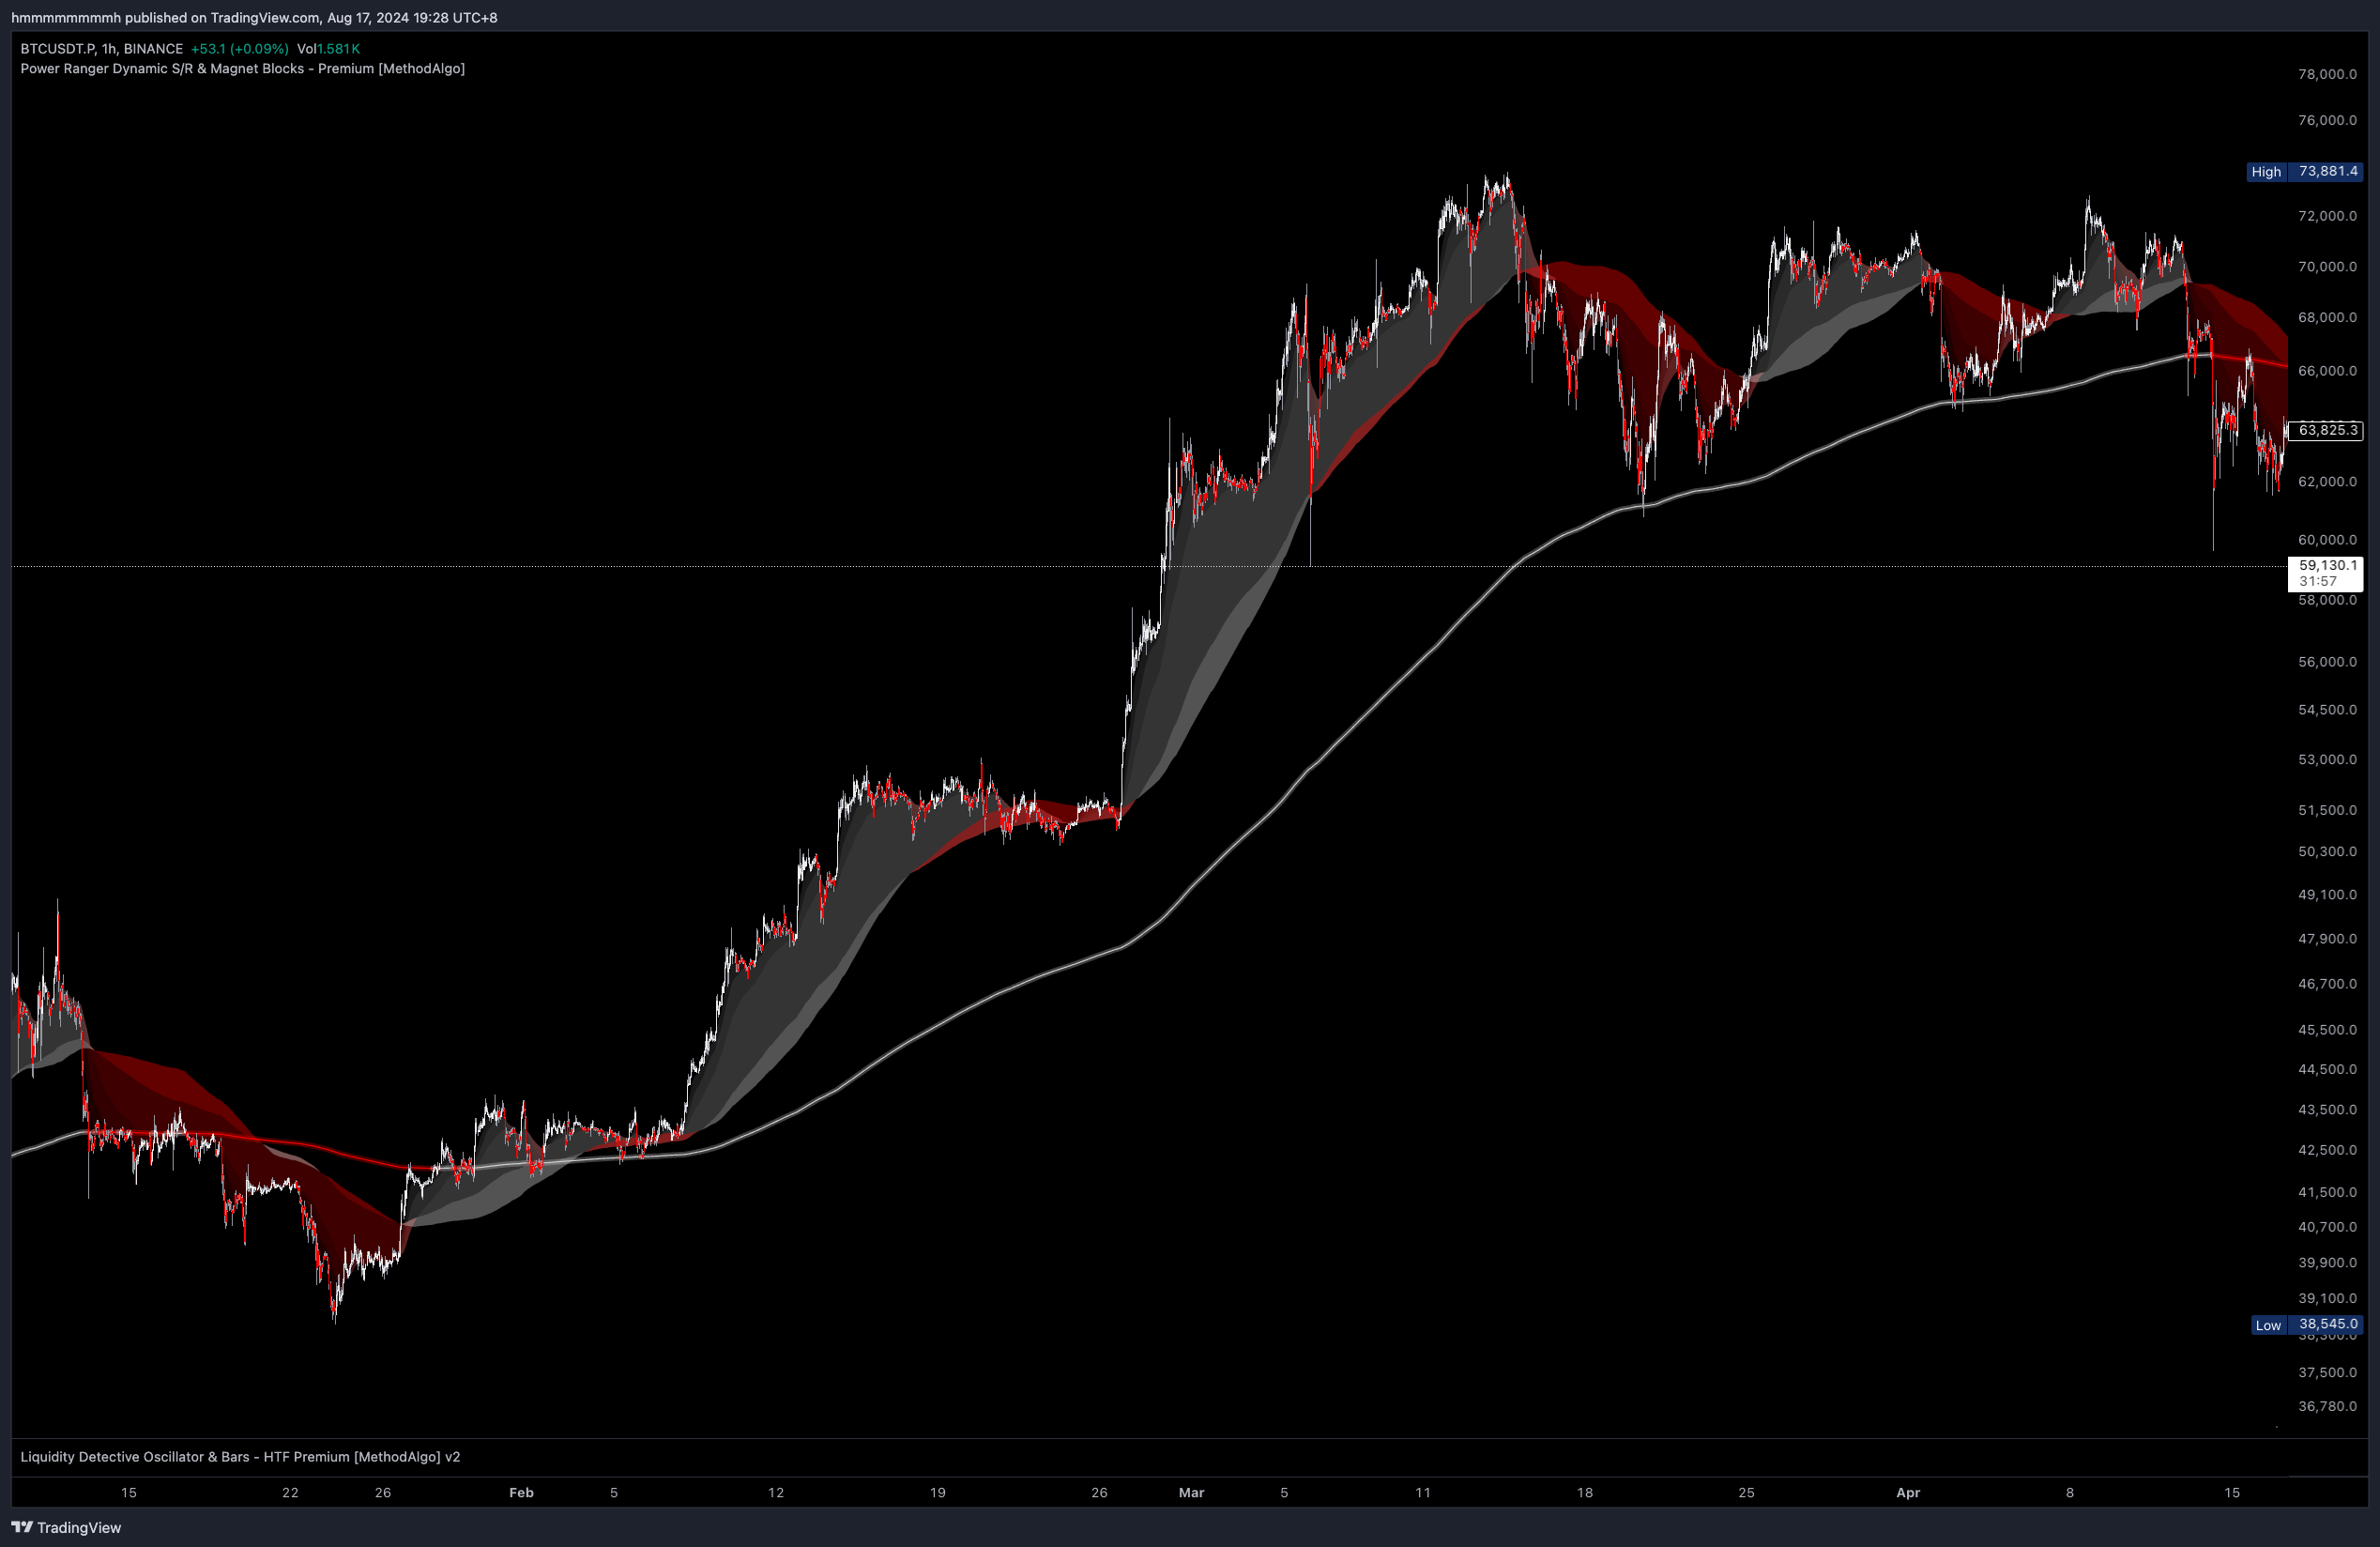
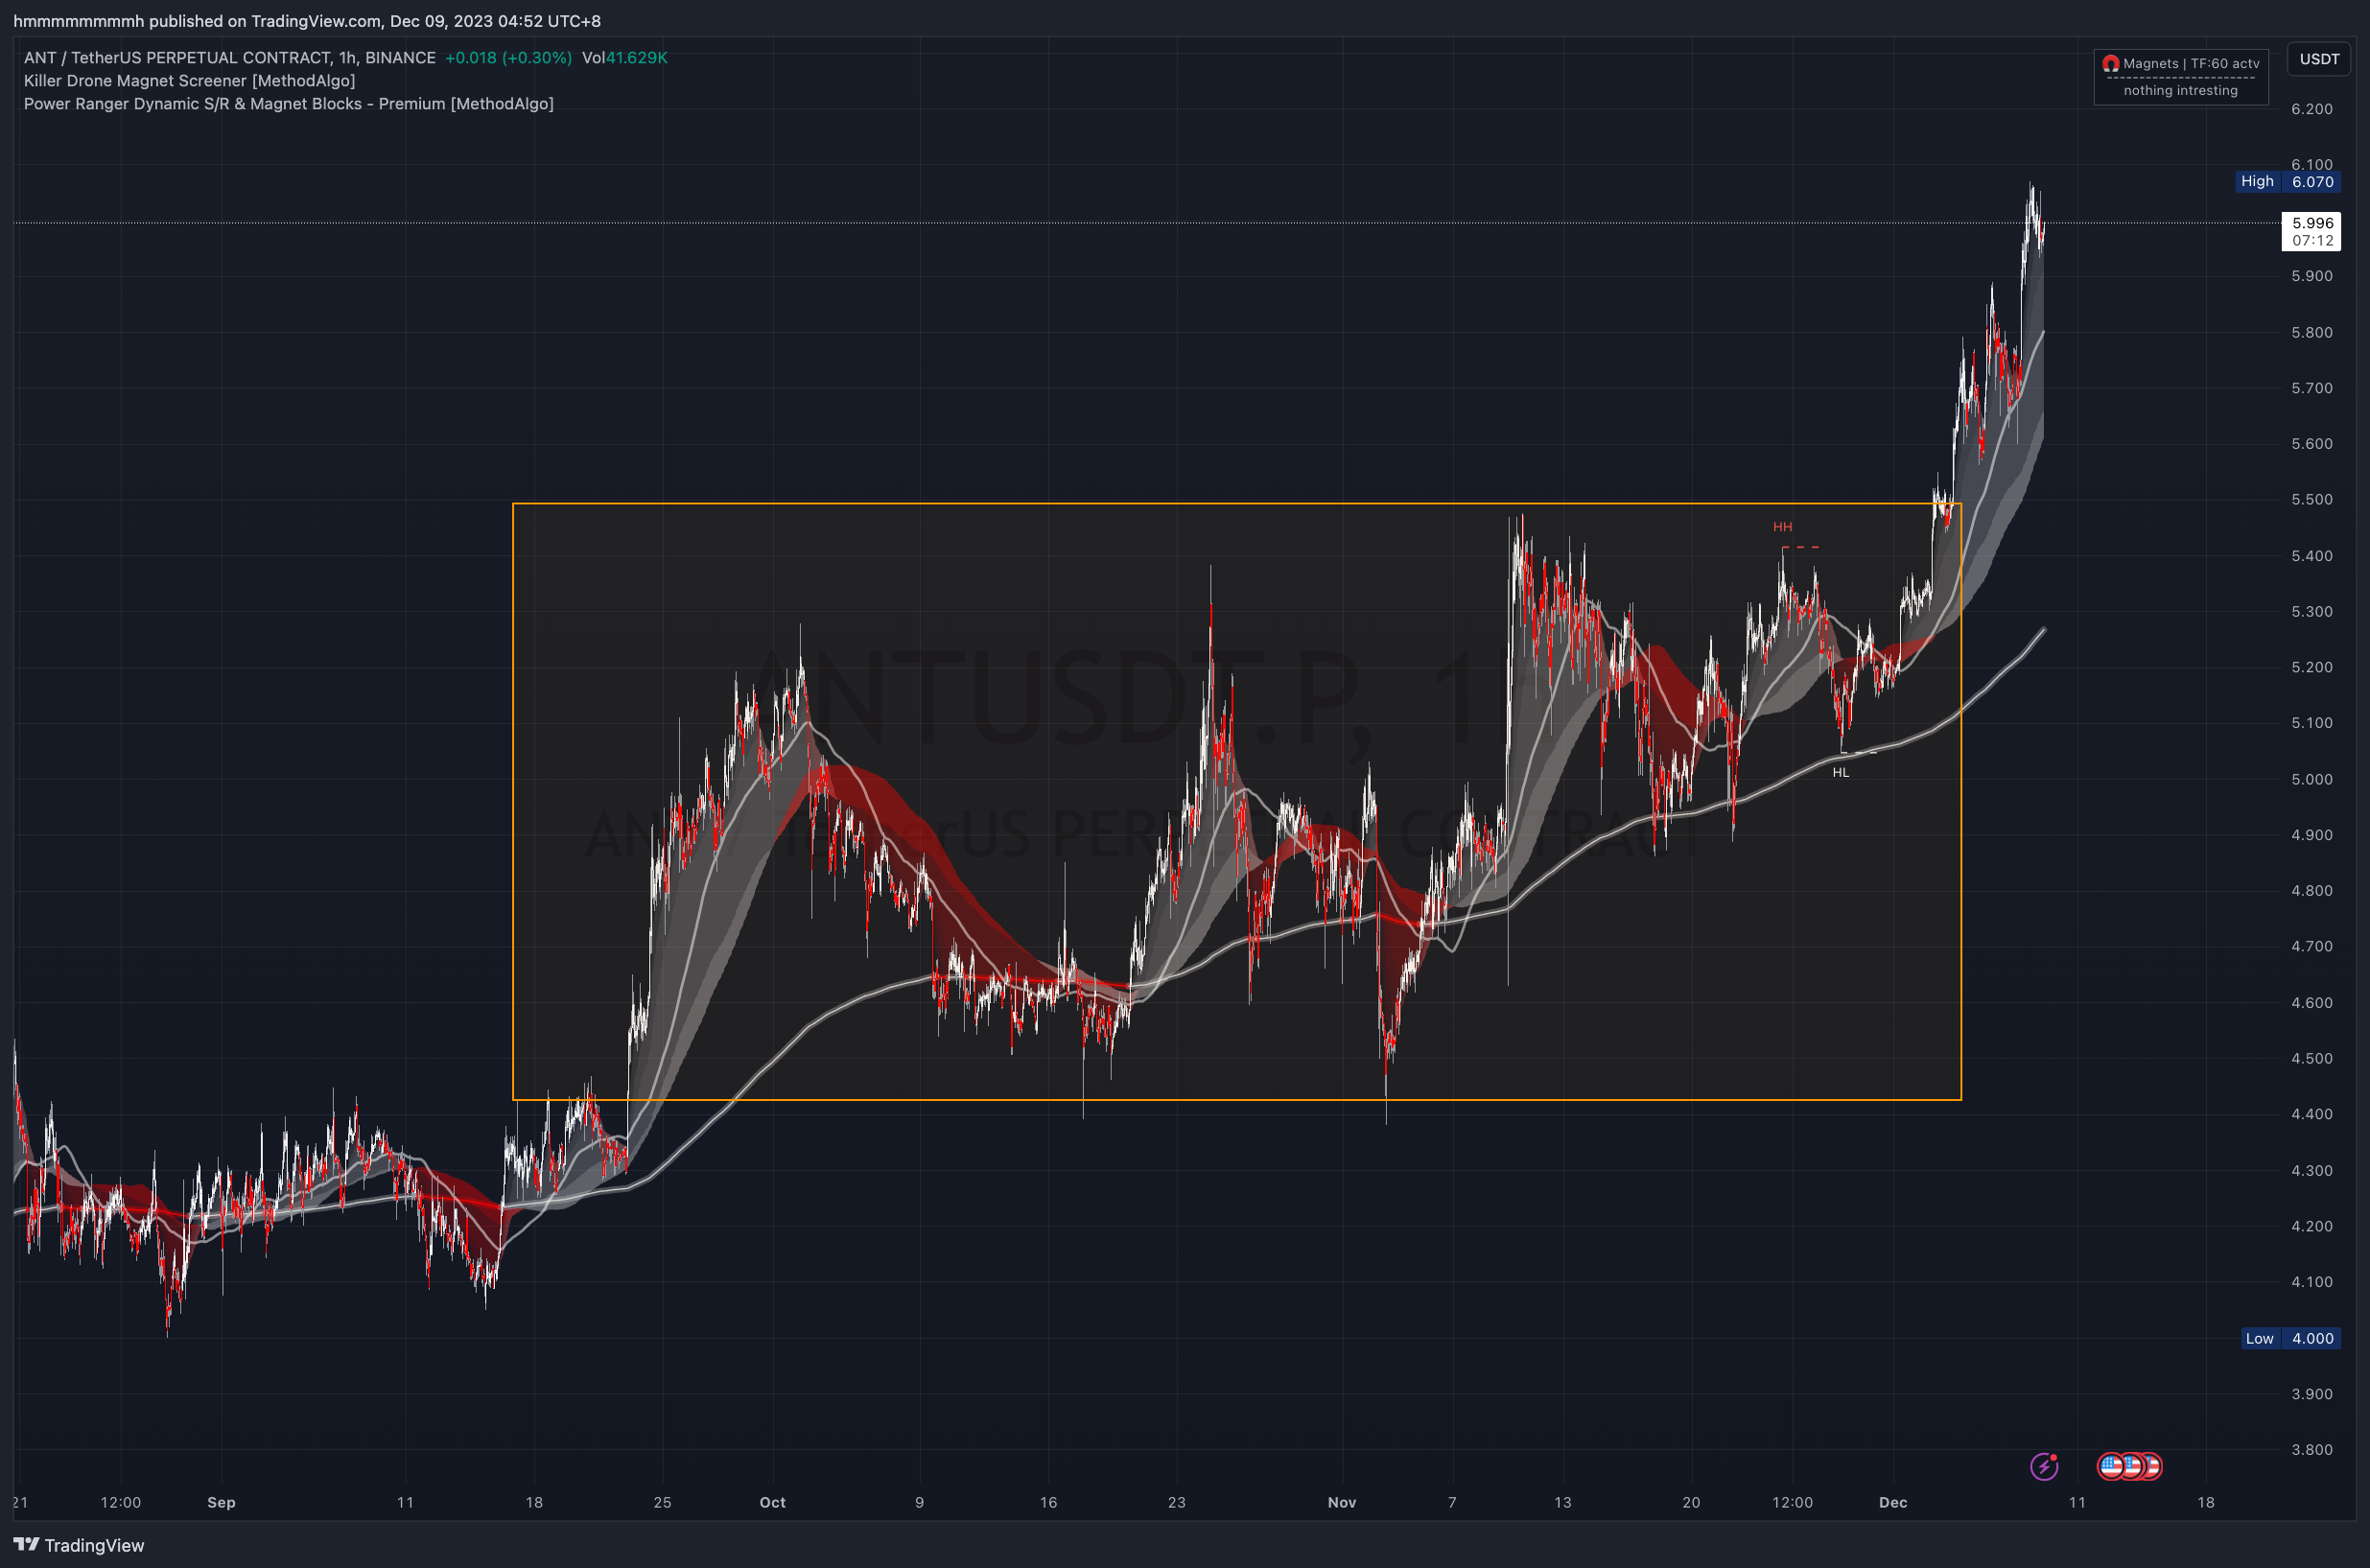
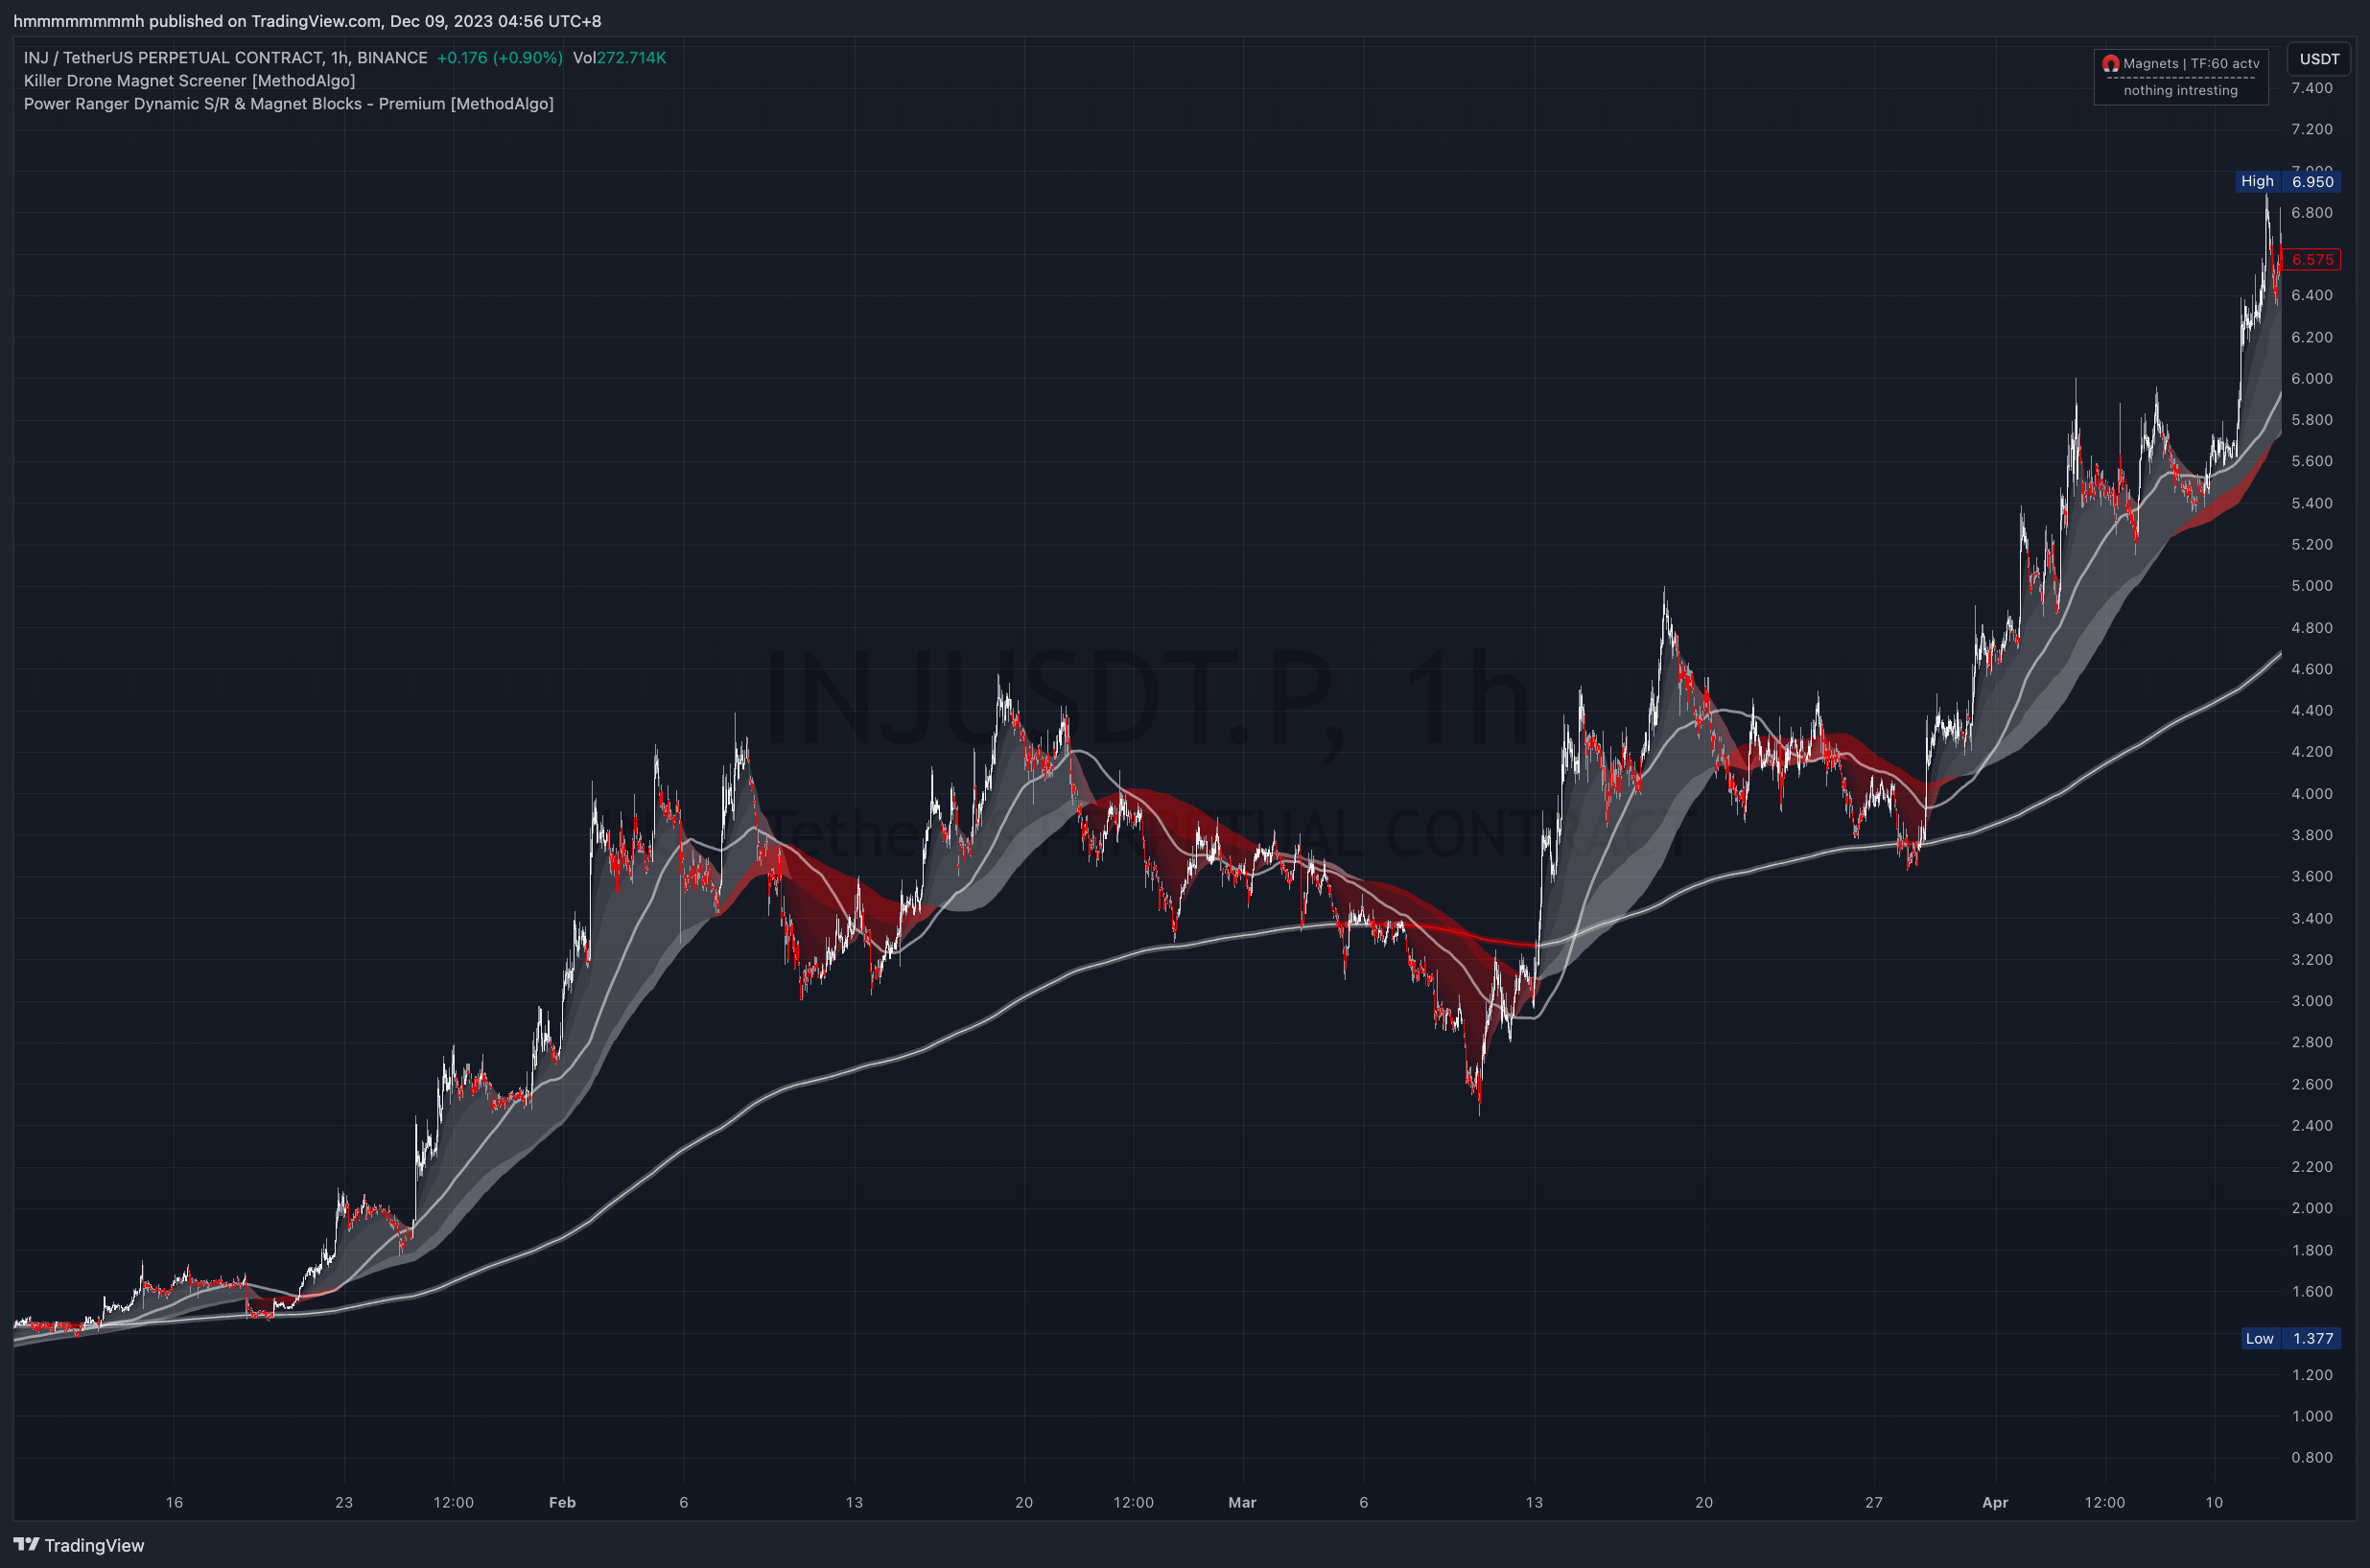
Healthy Cloud
The following images show a healthy uptrend cloud and a healthy downtrend cloud, representing strong trending conditions. The market trend is unlikely to reverse until 1-2 occurrences of the Golden Pit pattern or at least one touch (or near touch) of the Trendline.
A Healthy Cloud must satisfy the following conditions:
- Uniform cloud color
- The
Cloudis thick, becomes thicker, or remains thick - The
Cloudis above/below the Trendline - There is a
Void Areabetween theCloudandTrendline - The MA100 is above the
Cloud Baseand holding the price - The candle’s lows frequently touch the
Cloud Edge
Unhealthy Cloud
This cloud pattern is often characterized by large fluctuations and does not show a continuous, prolonged trend. It is often in the process of forming patterns (like triangles or other patterns) or combinations of short lived impulsive movement. Small fluctuations may indicate a pressure cooker pattern, while others suggest an unstable trend that may experience a sharp reversal.
An Unhealthy Cloud pattern meets any of the following conditions:
- Non-uniform cloud color or with opposite-colored
Cloud Edges - Opposite-colored
Cloud Baseand third Cloud Layer - MA100 is not within the
Cloud - The
Trendlinecolor changes frequently
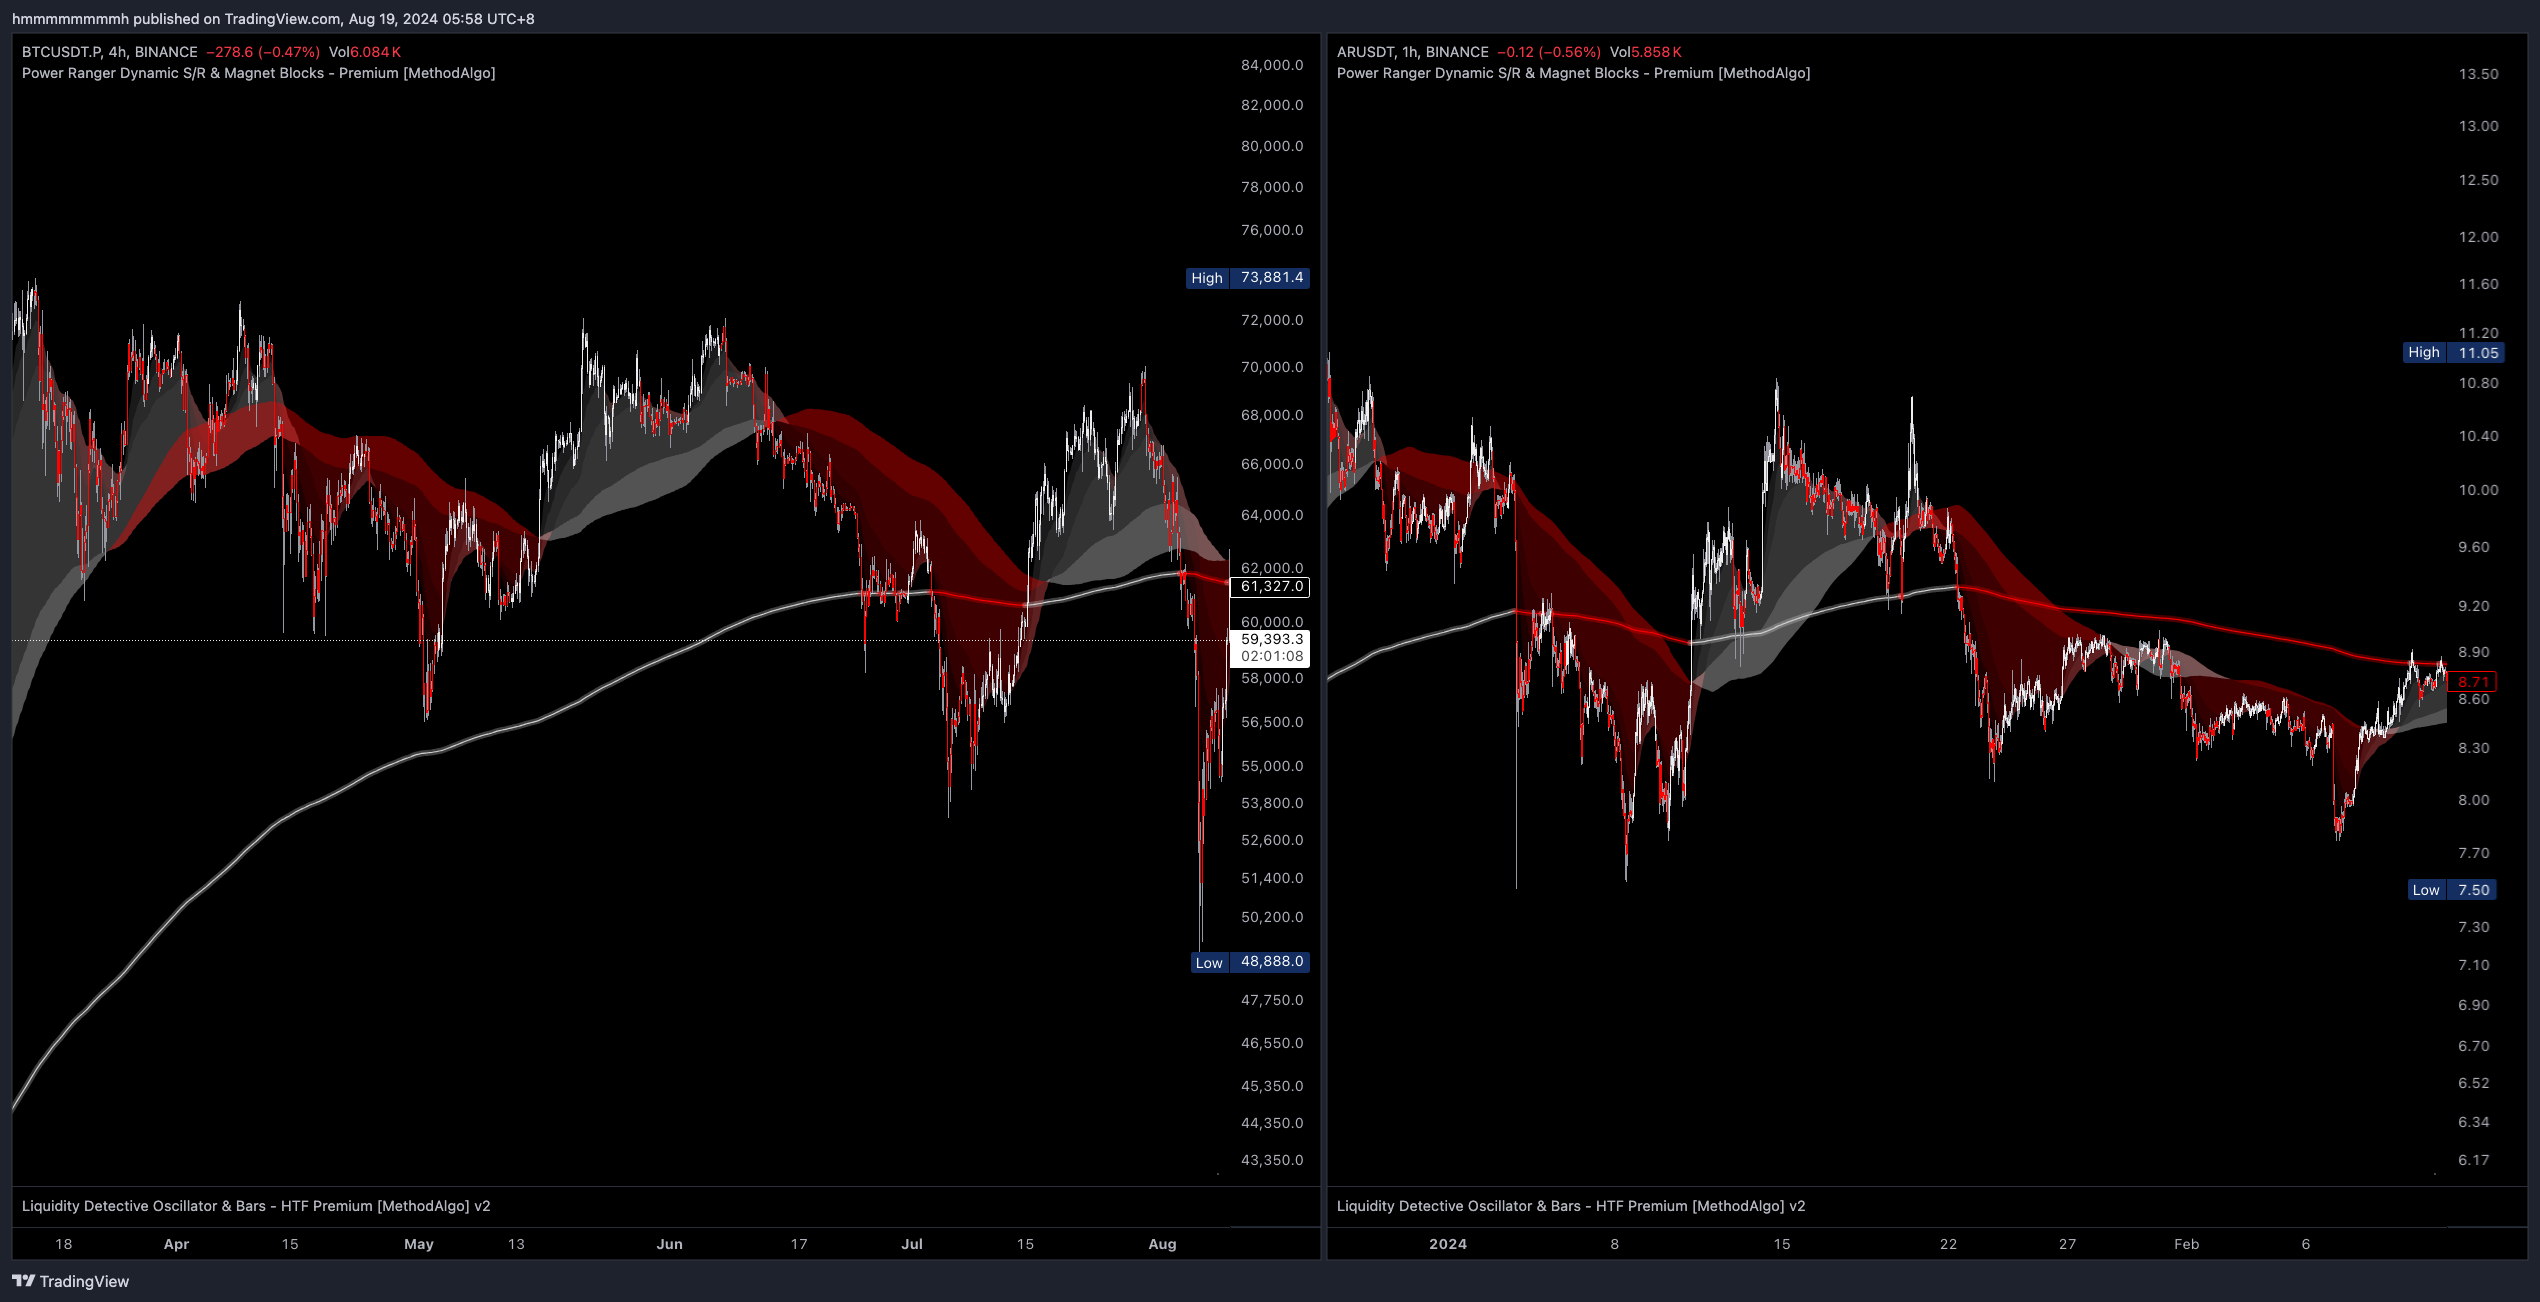
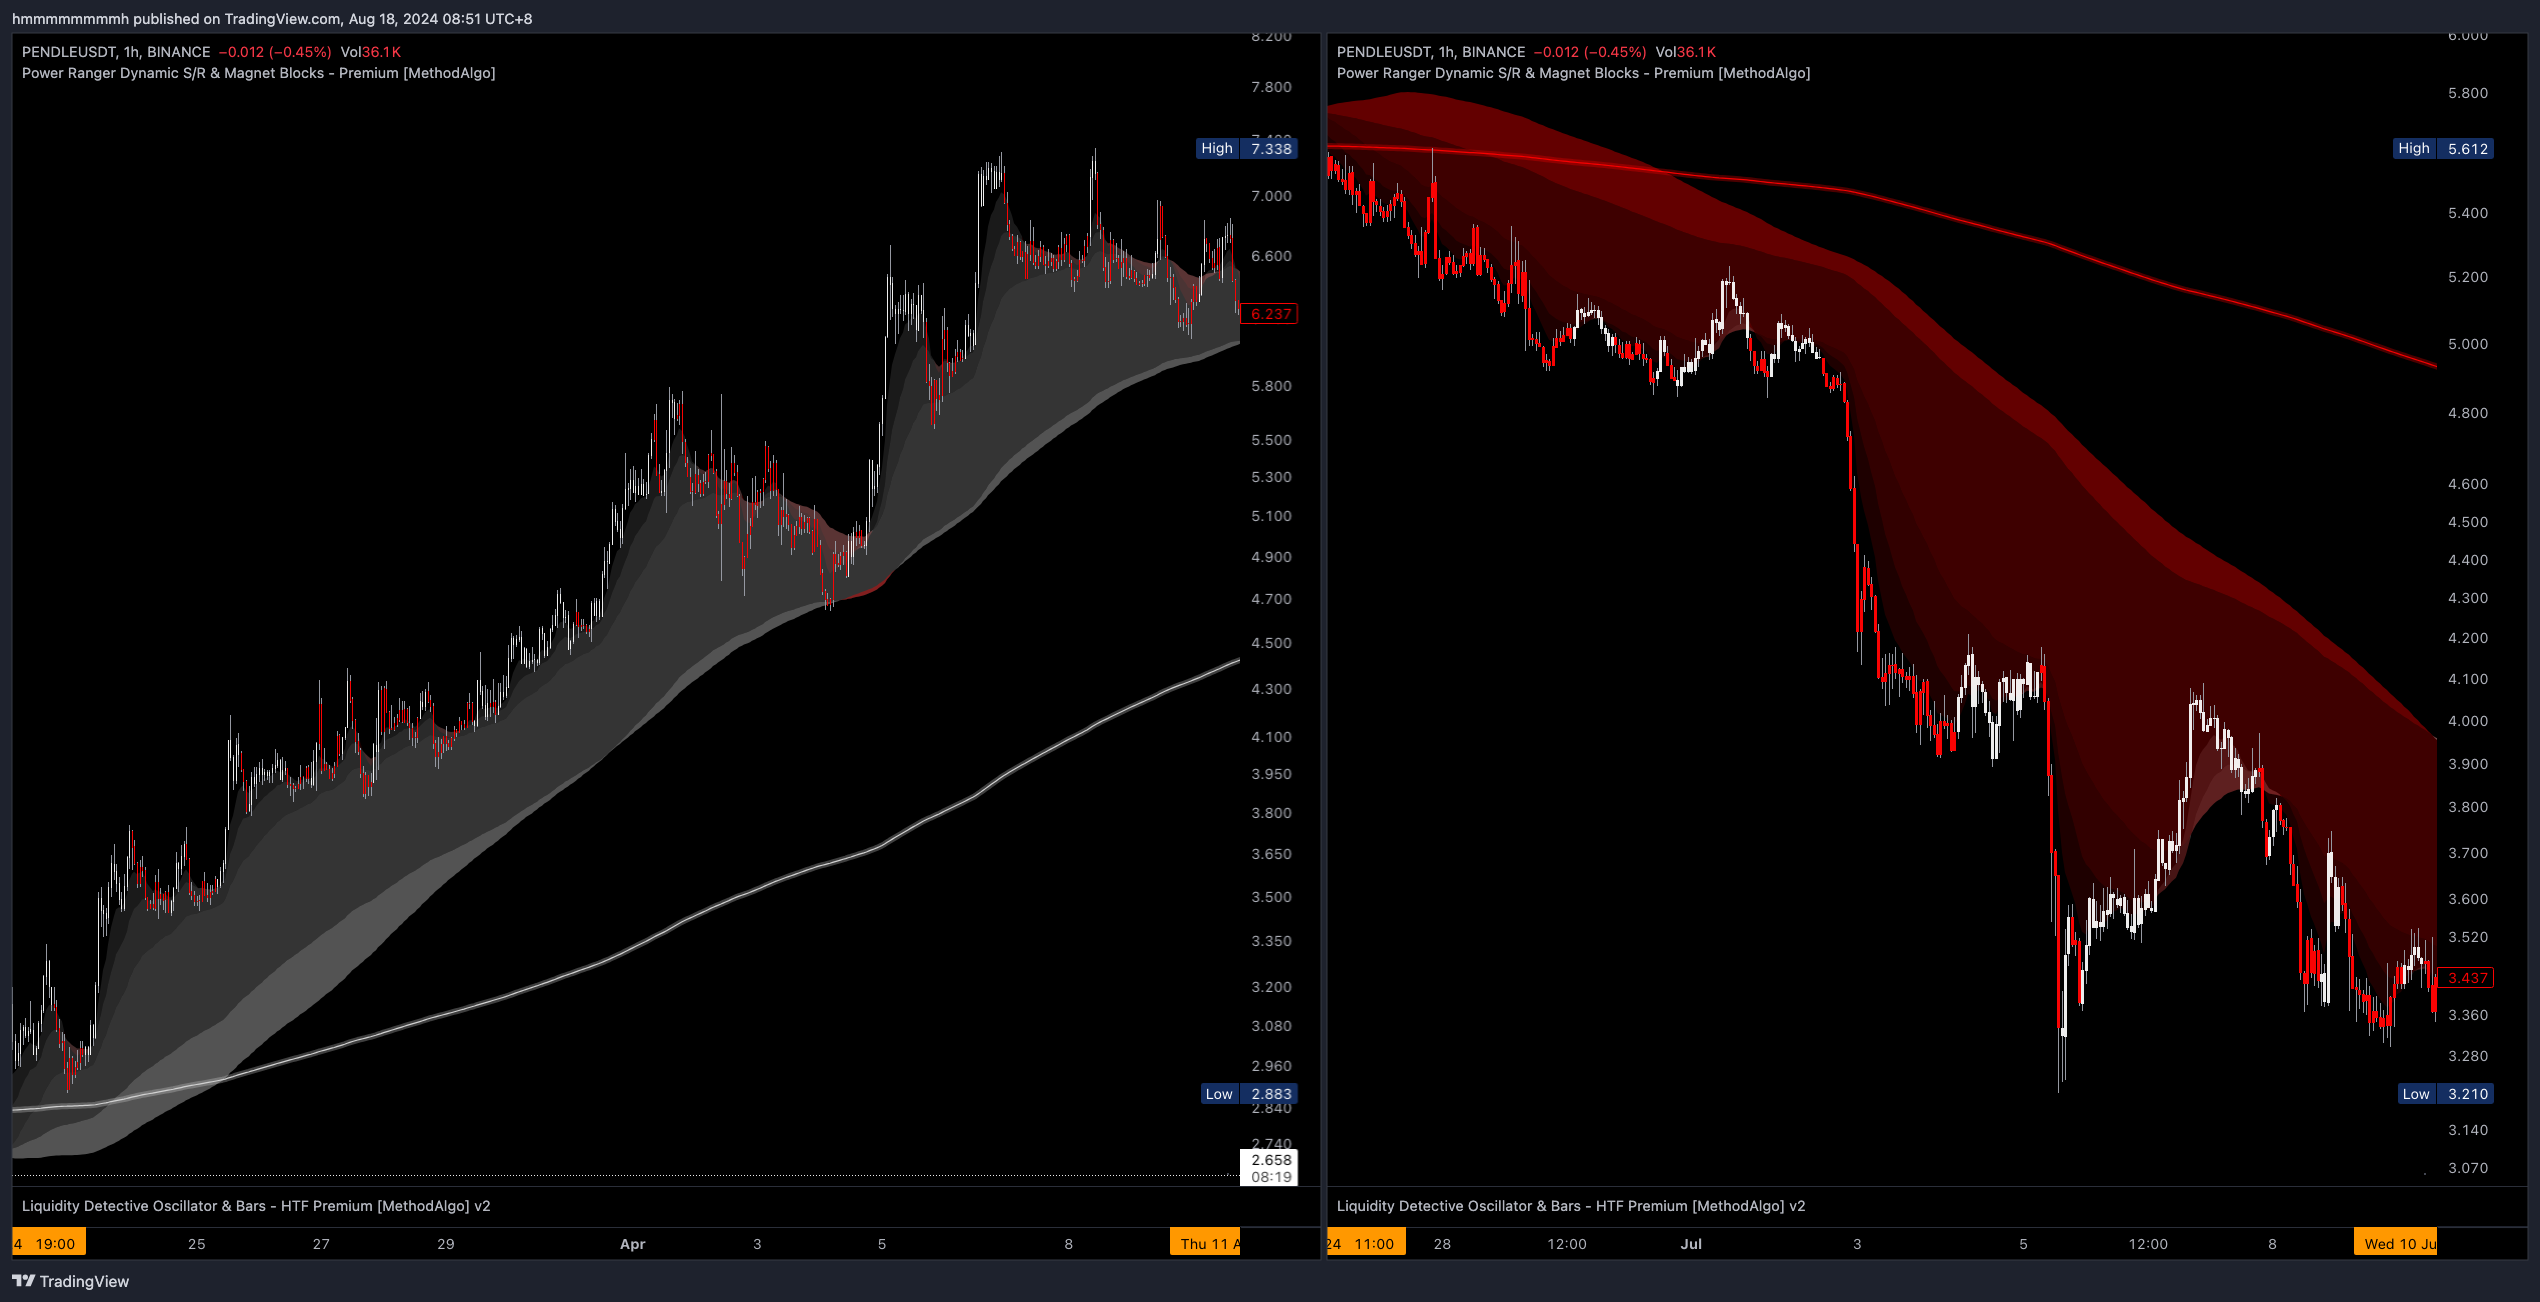
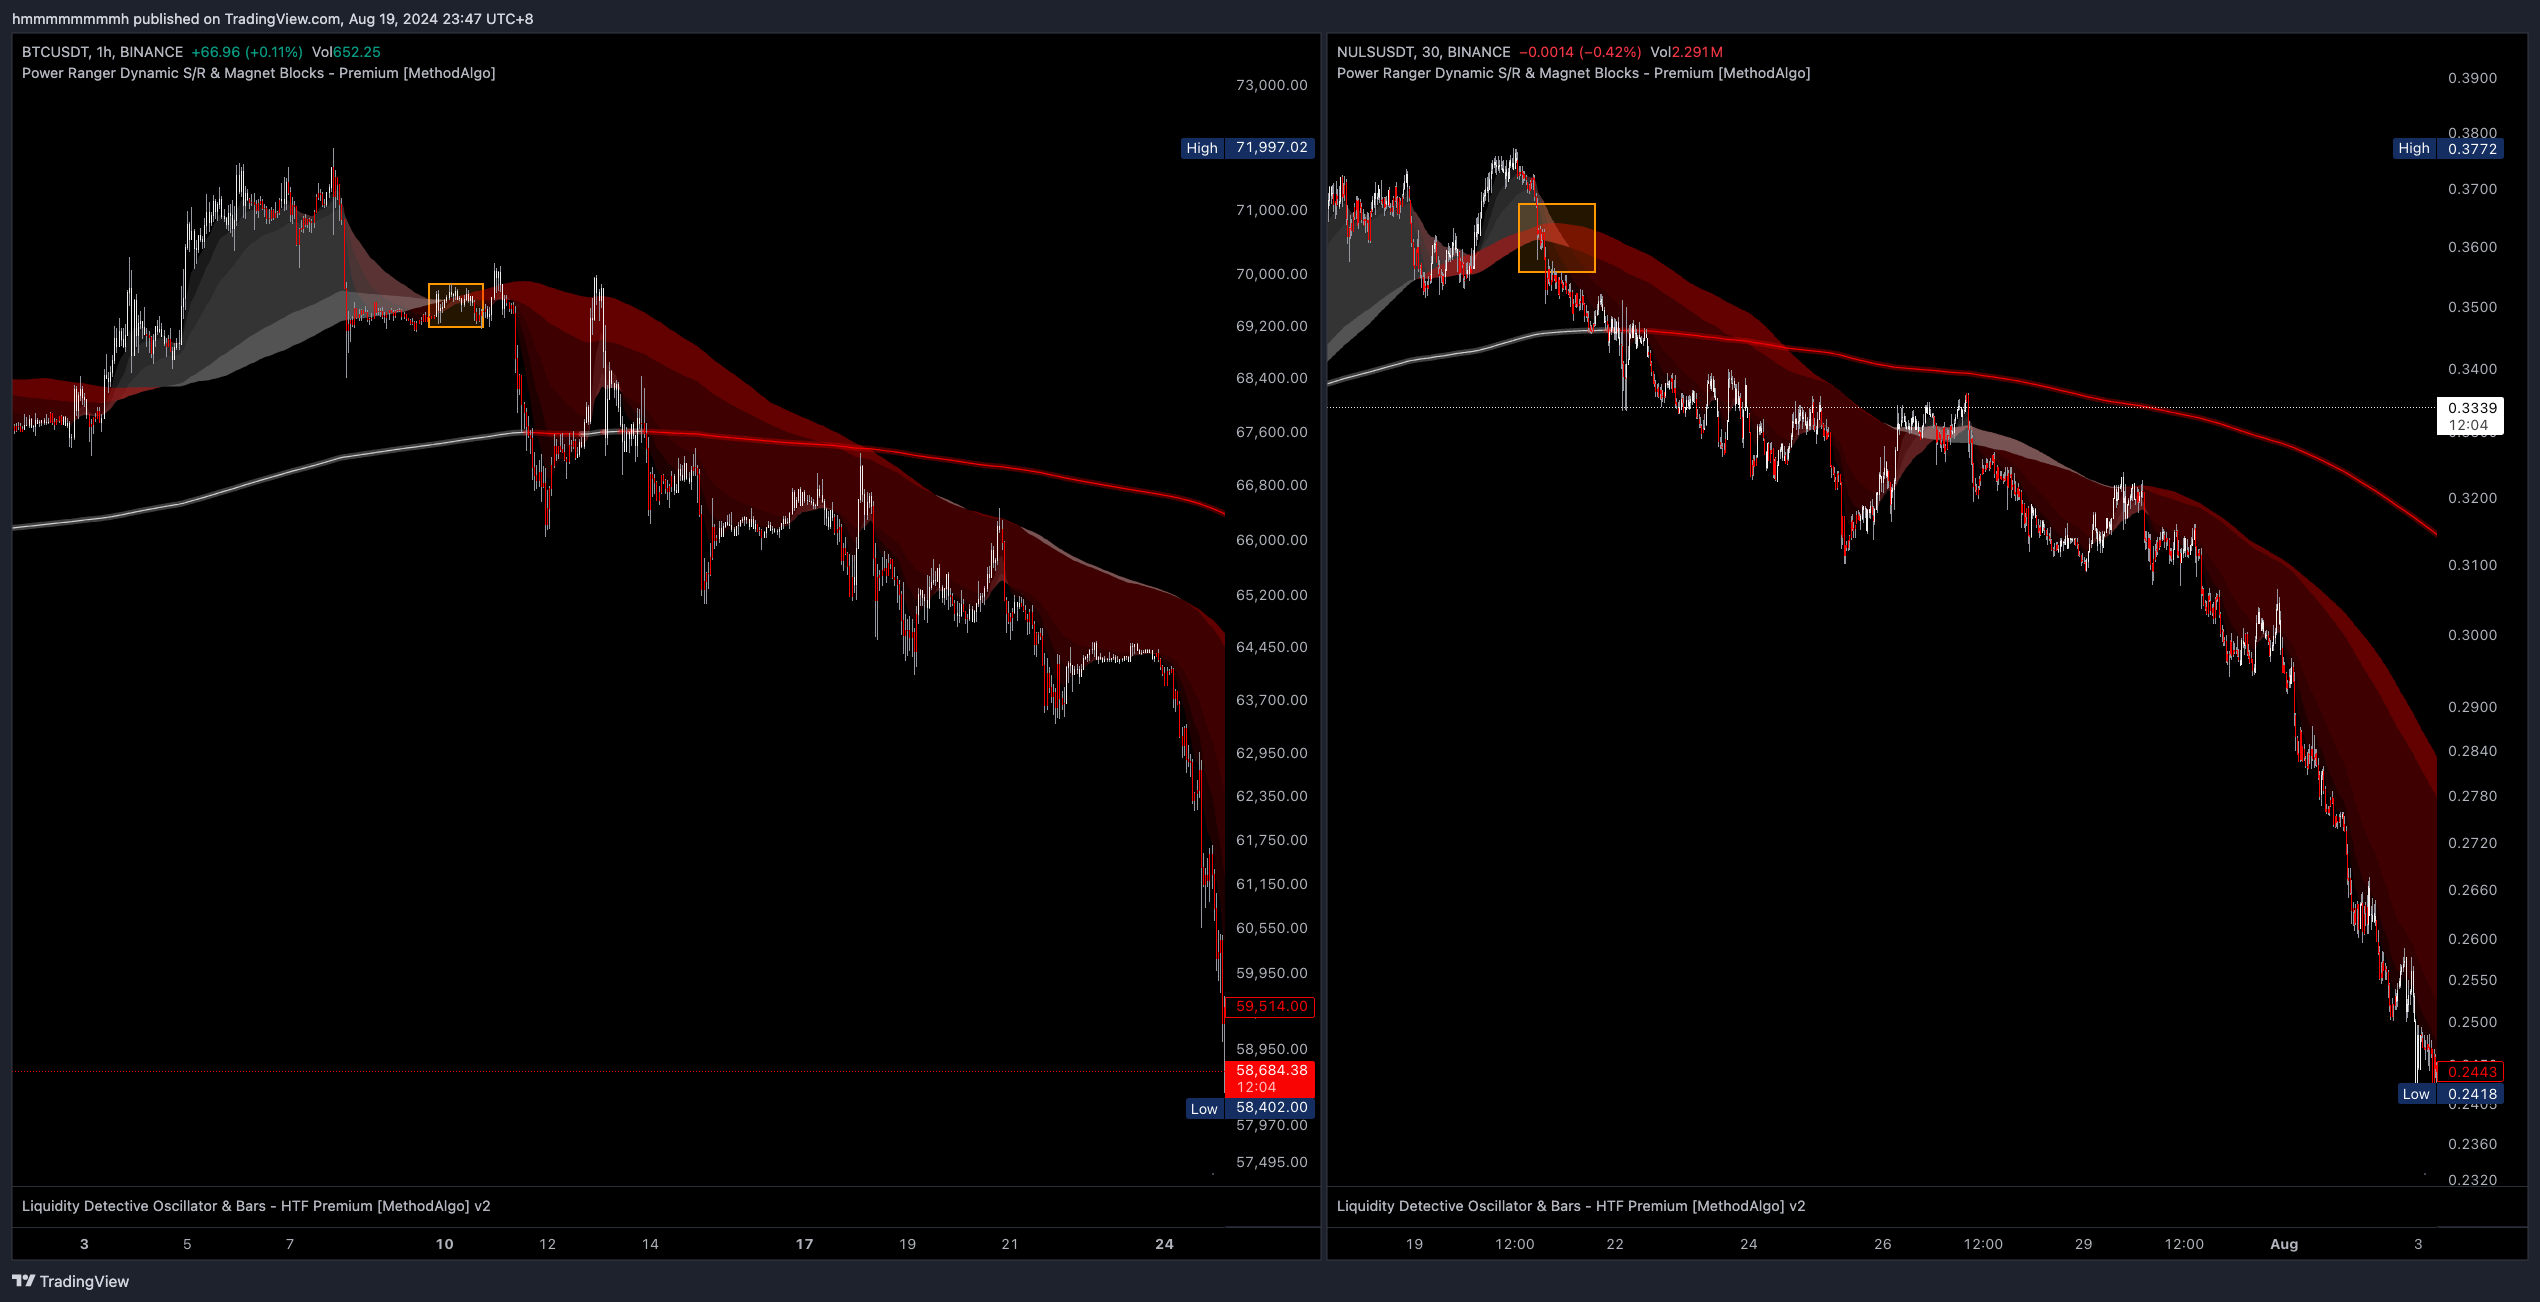
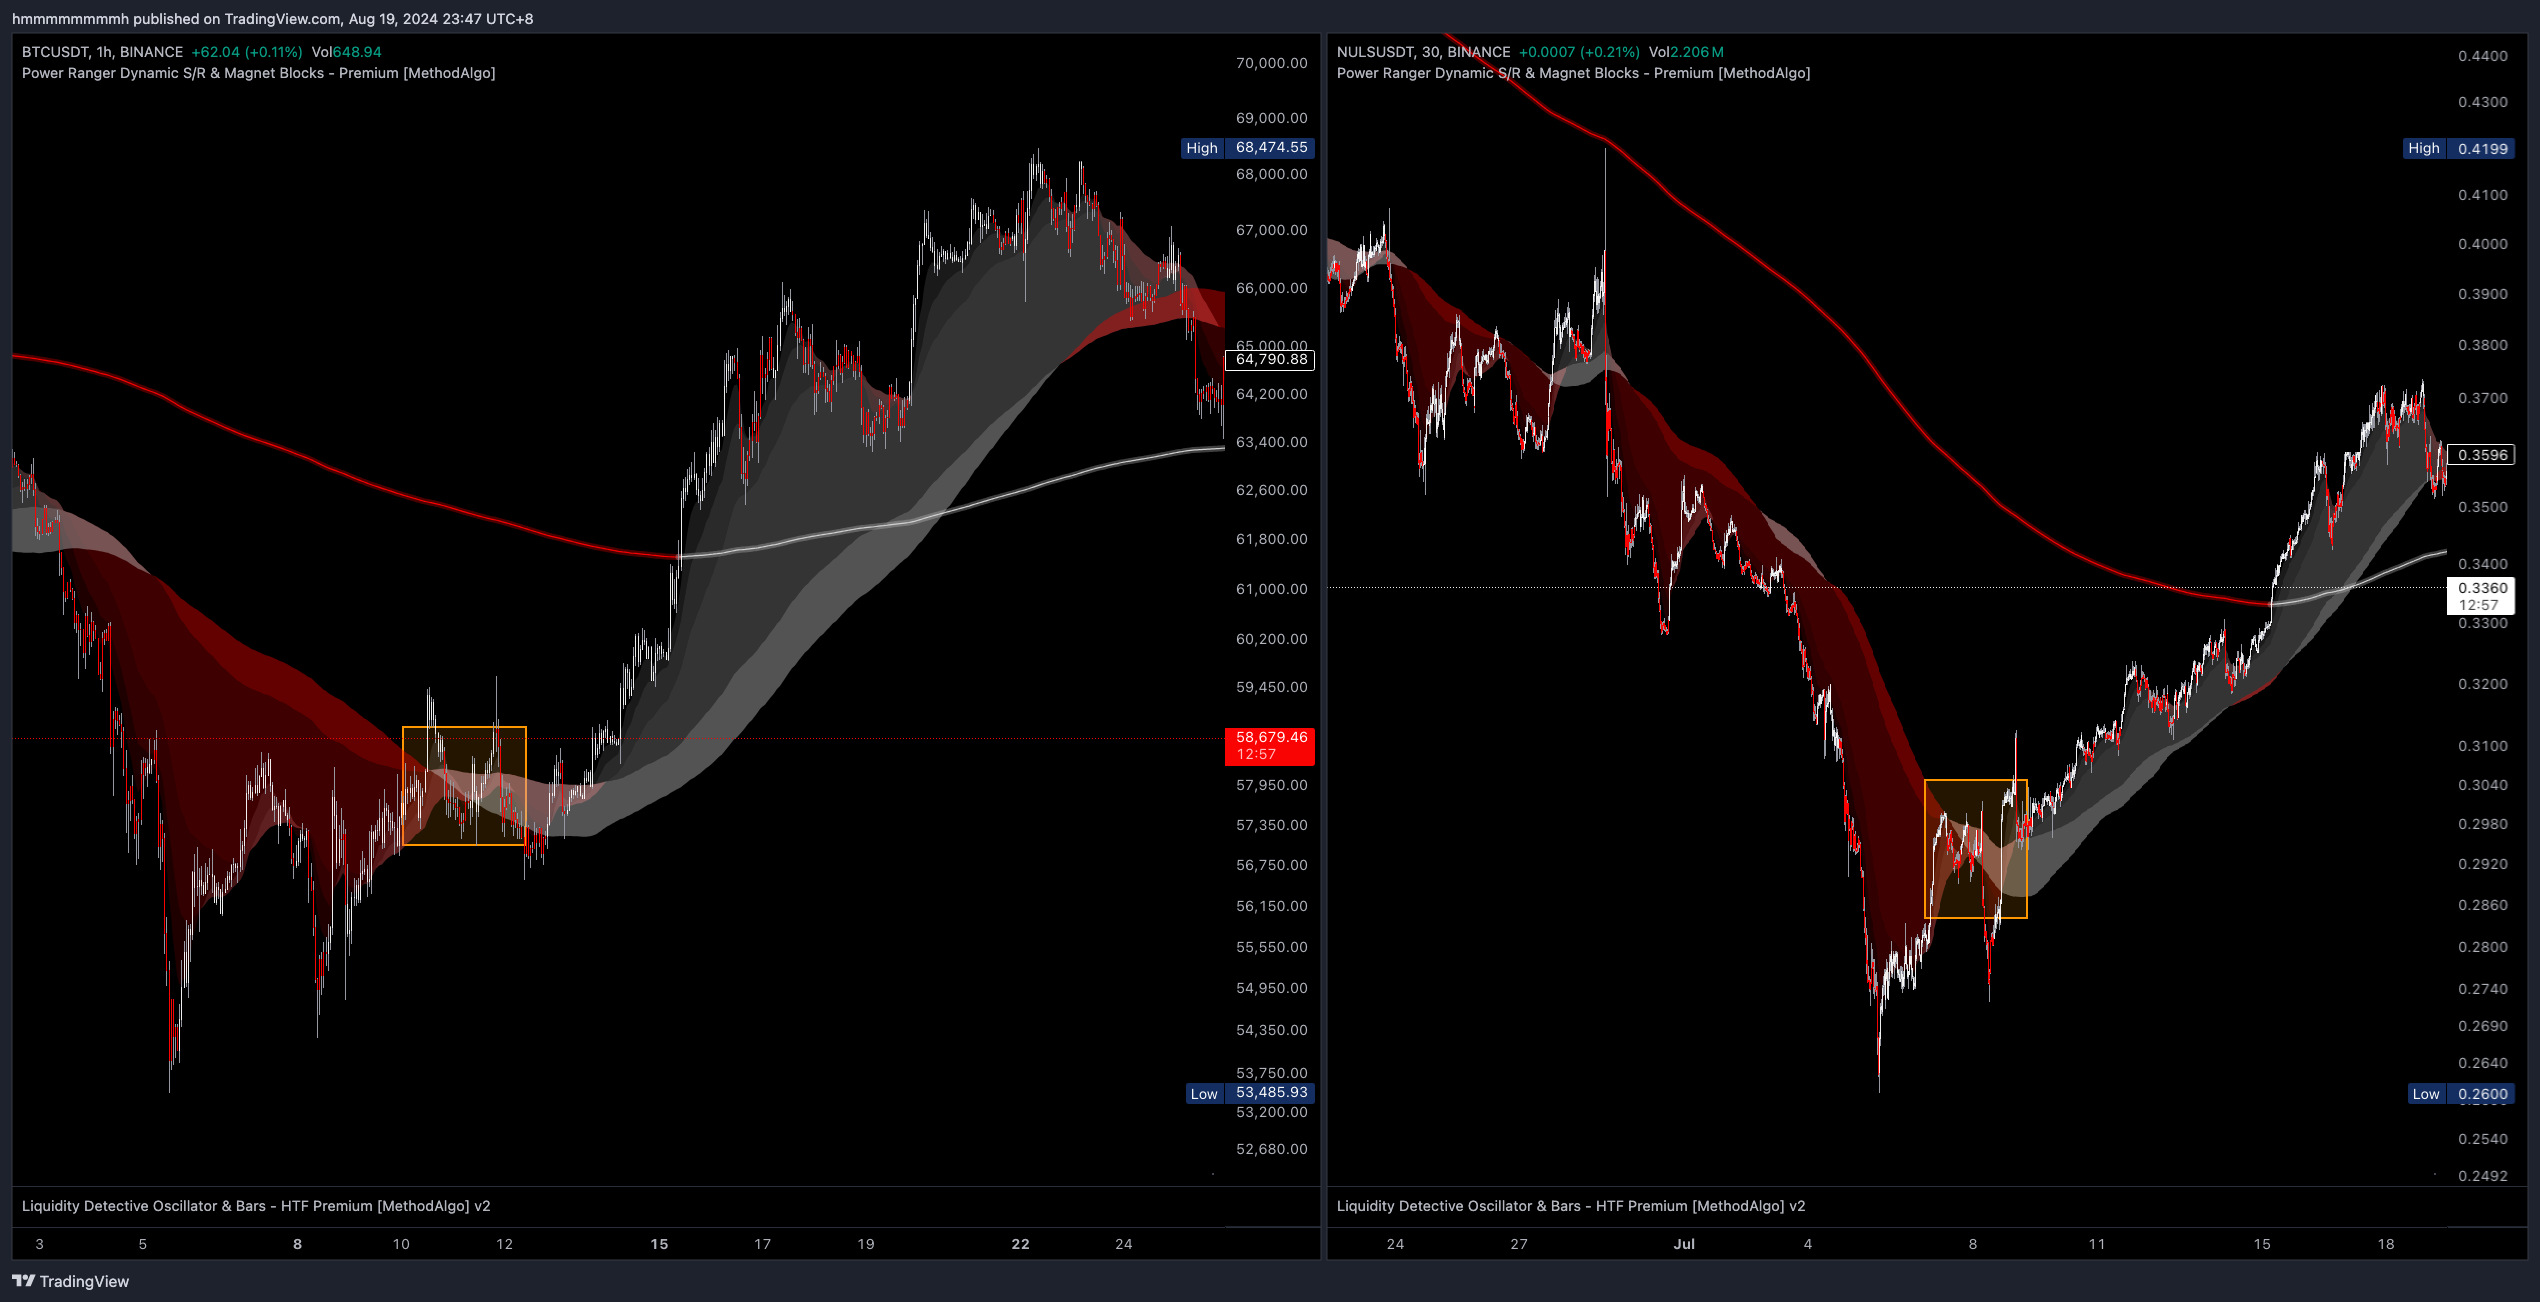
Pressure Cooker
The Pressure Cooker pattern typically appears in accumulation zones at the bottom of a bear market or during prolonged re-accumulation after a price surge. This pattern is similar to the Chinese Dragon but differs in its smaller fluctuations and longer duration. Due to prolonged consolidation, traders may find it difficult to analyze trends through the Cloud. However, this pattern often ends with a burst in the APEX move.
A Pressure Cooker Cloud must satisfy the following conditions:
- Flat
cloud - Cloud color frequently changes
- The price repeatedly crosses the
Trendline - Minimal or no
Void Area
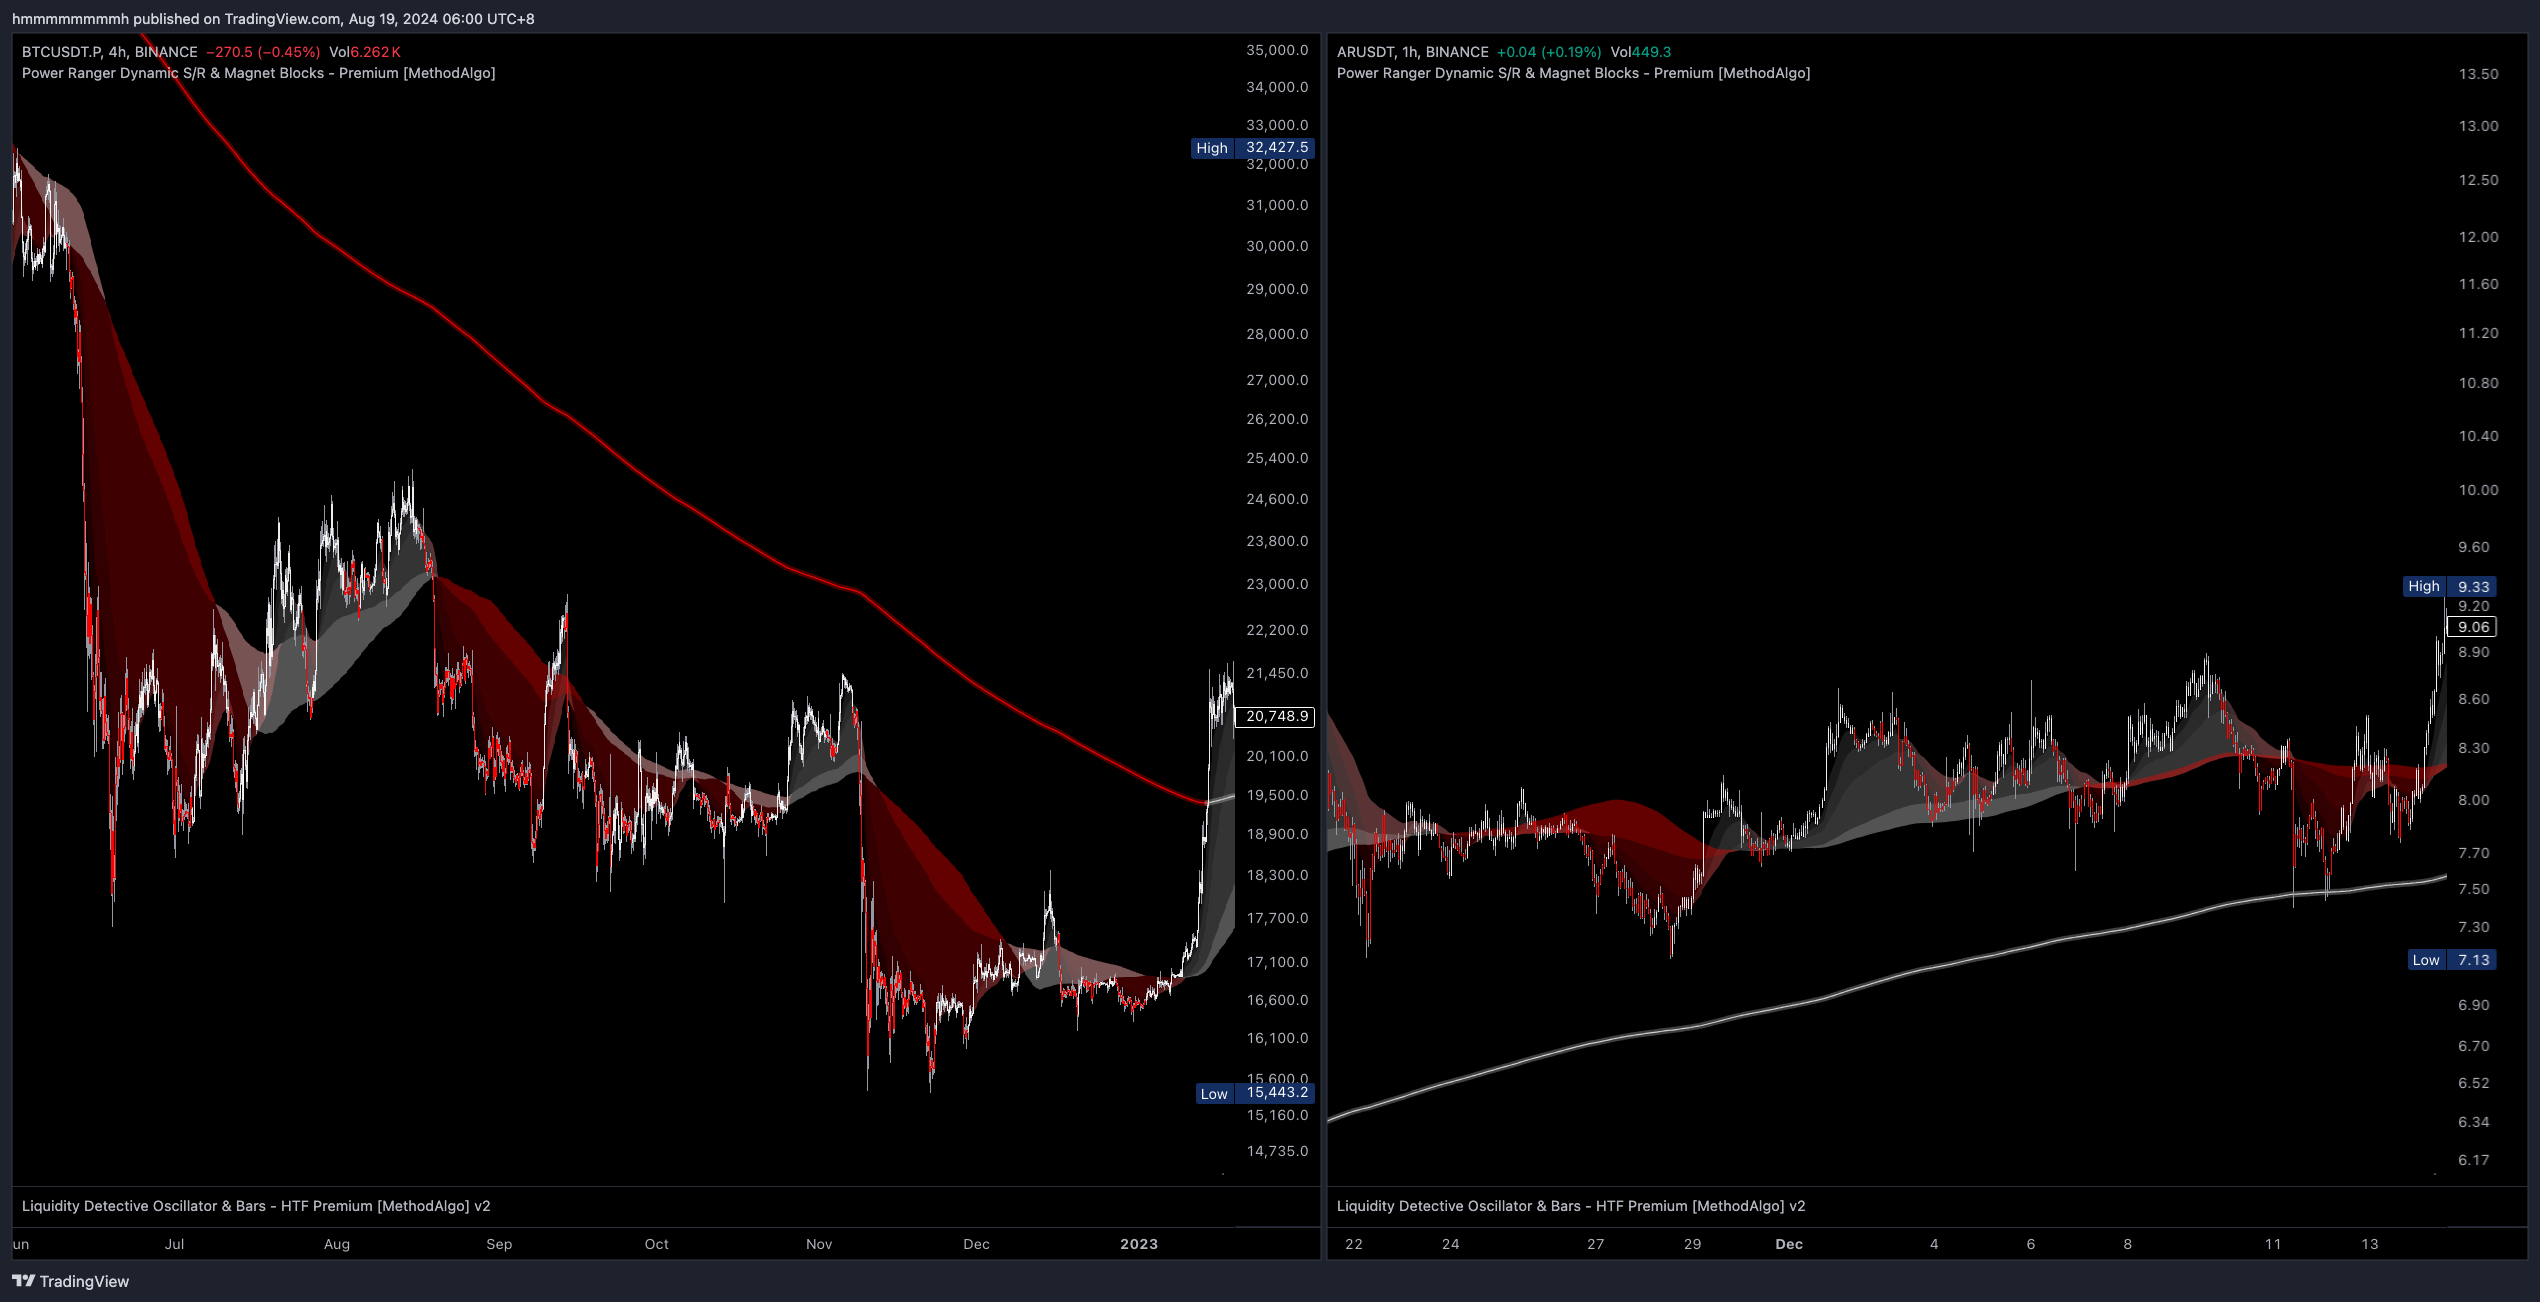
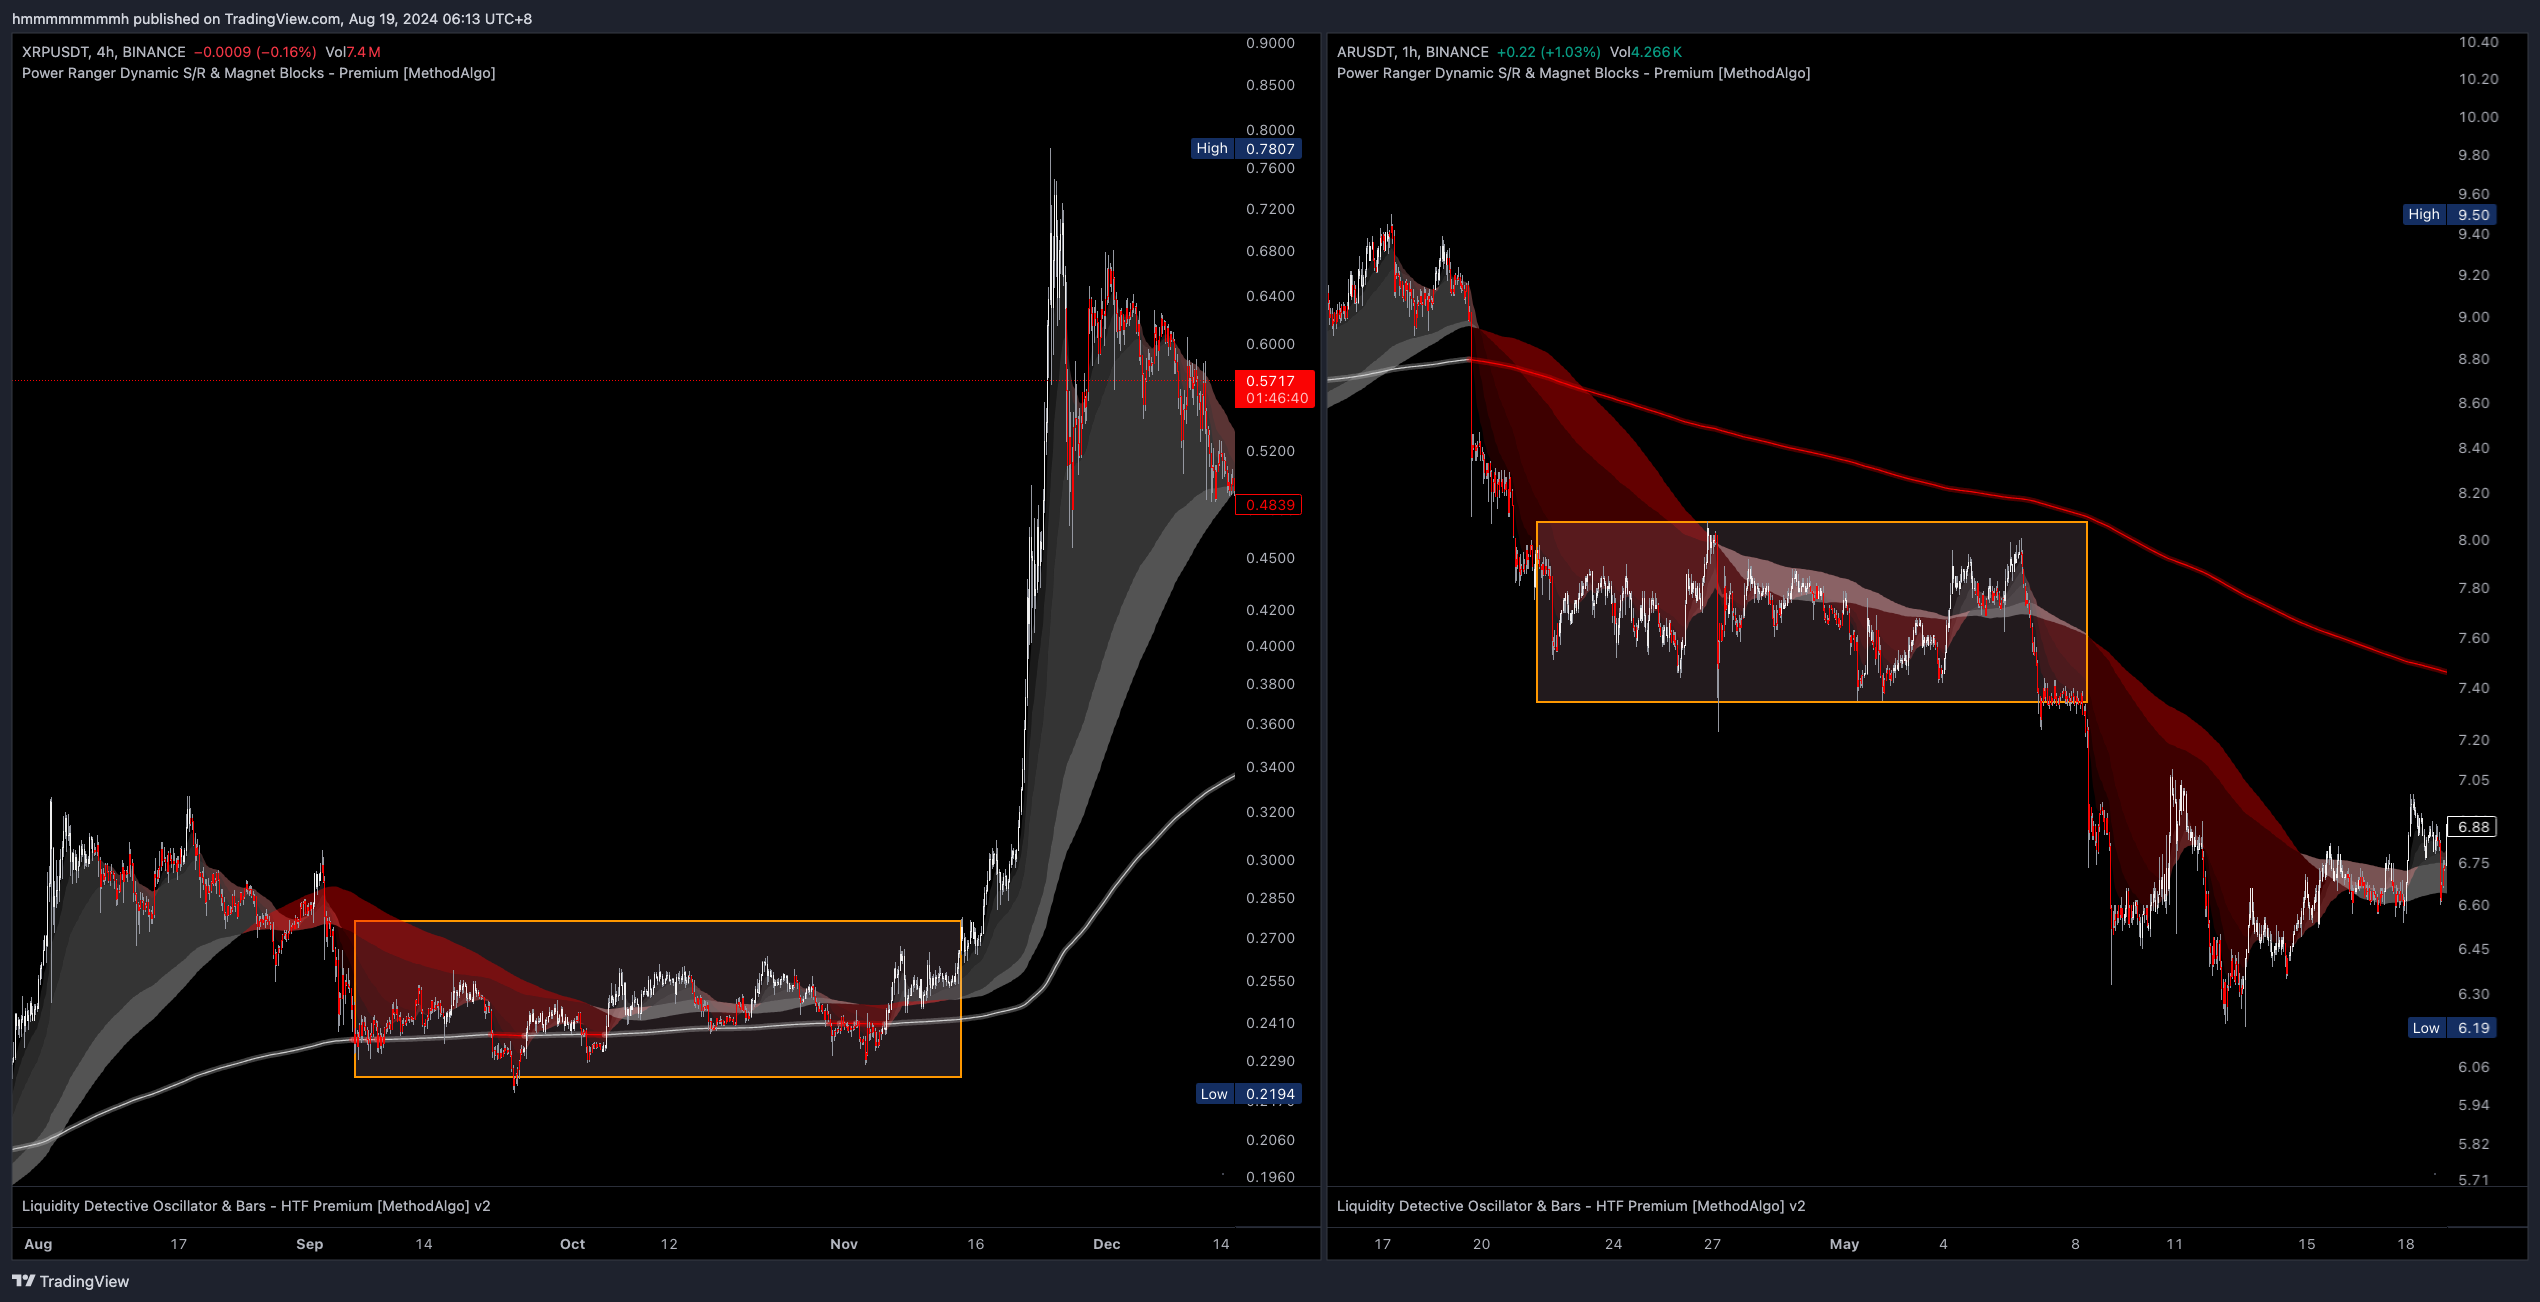
The left chart below shows the XRPUSDT in a pressure cooker pattern.
The right chart of ARUSDT appears similar but is NOT considered a pressure cooker pattern because it lacks the characteristic of oscillating around the trendline. Instead, it qualifies as a bear flag and distribution area, aligning with the Golden Pit pattern
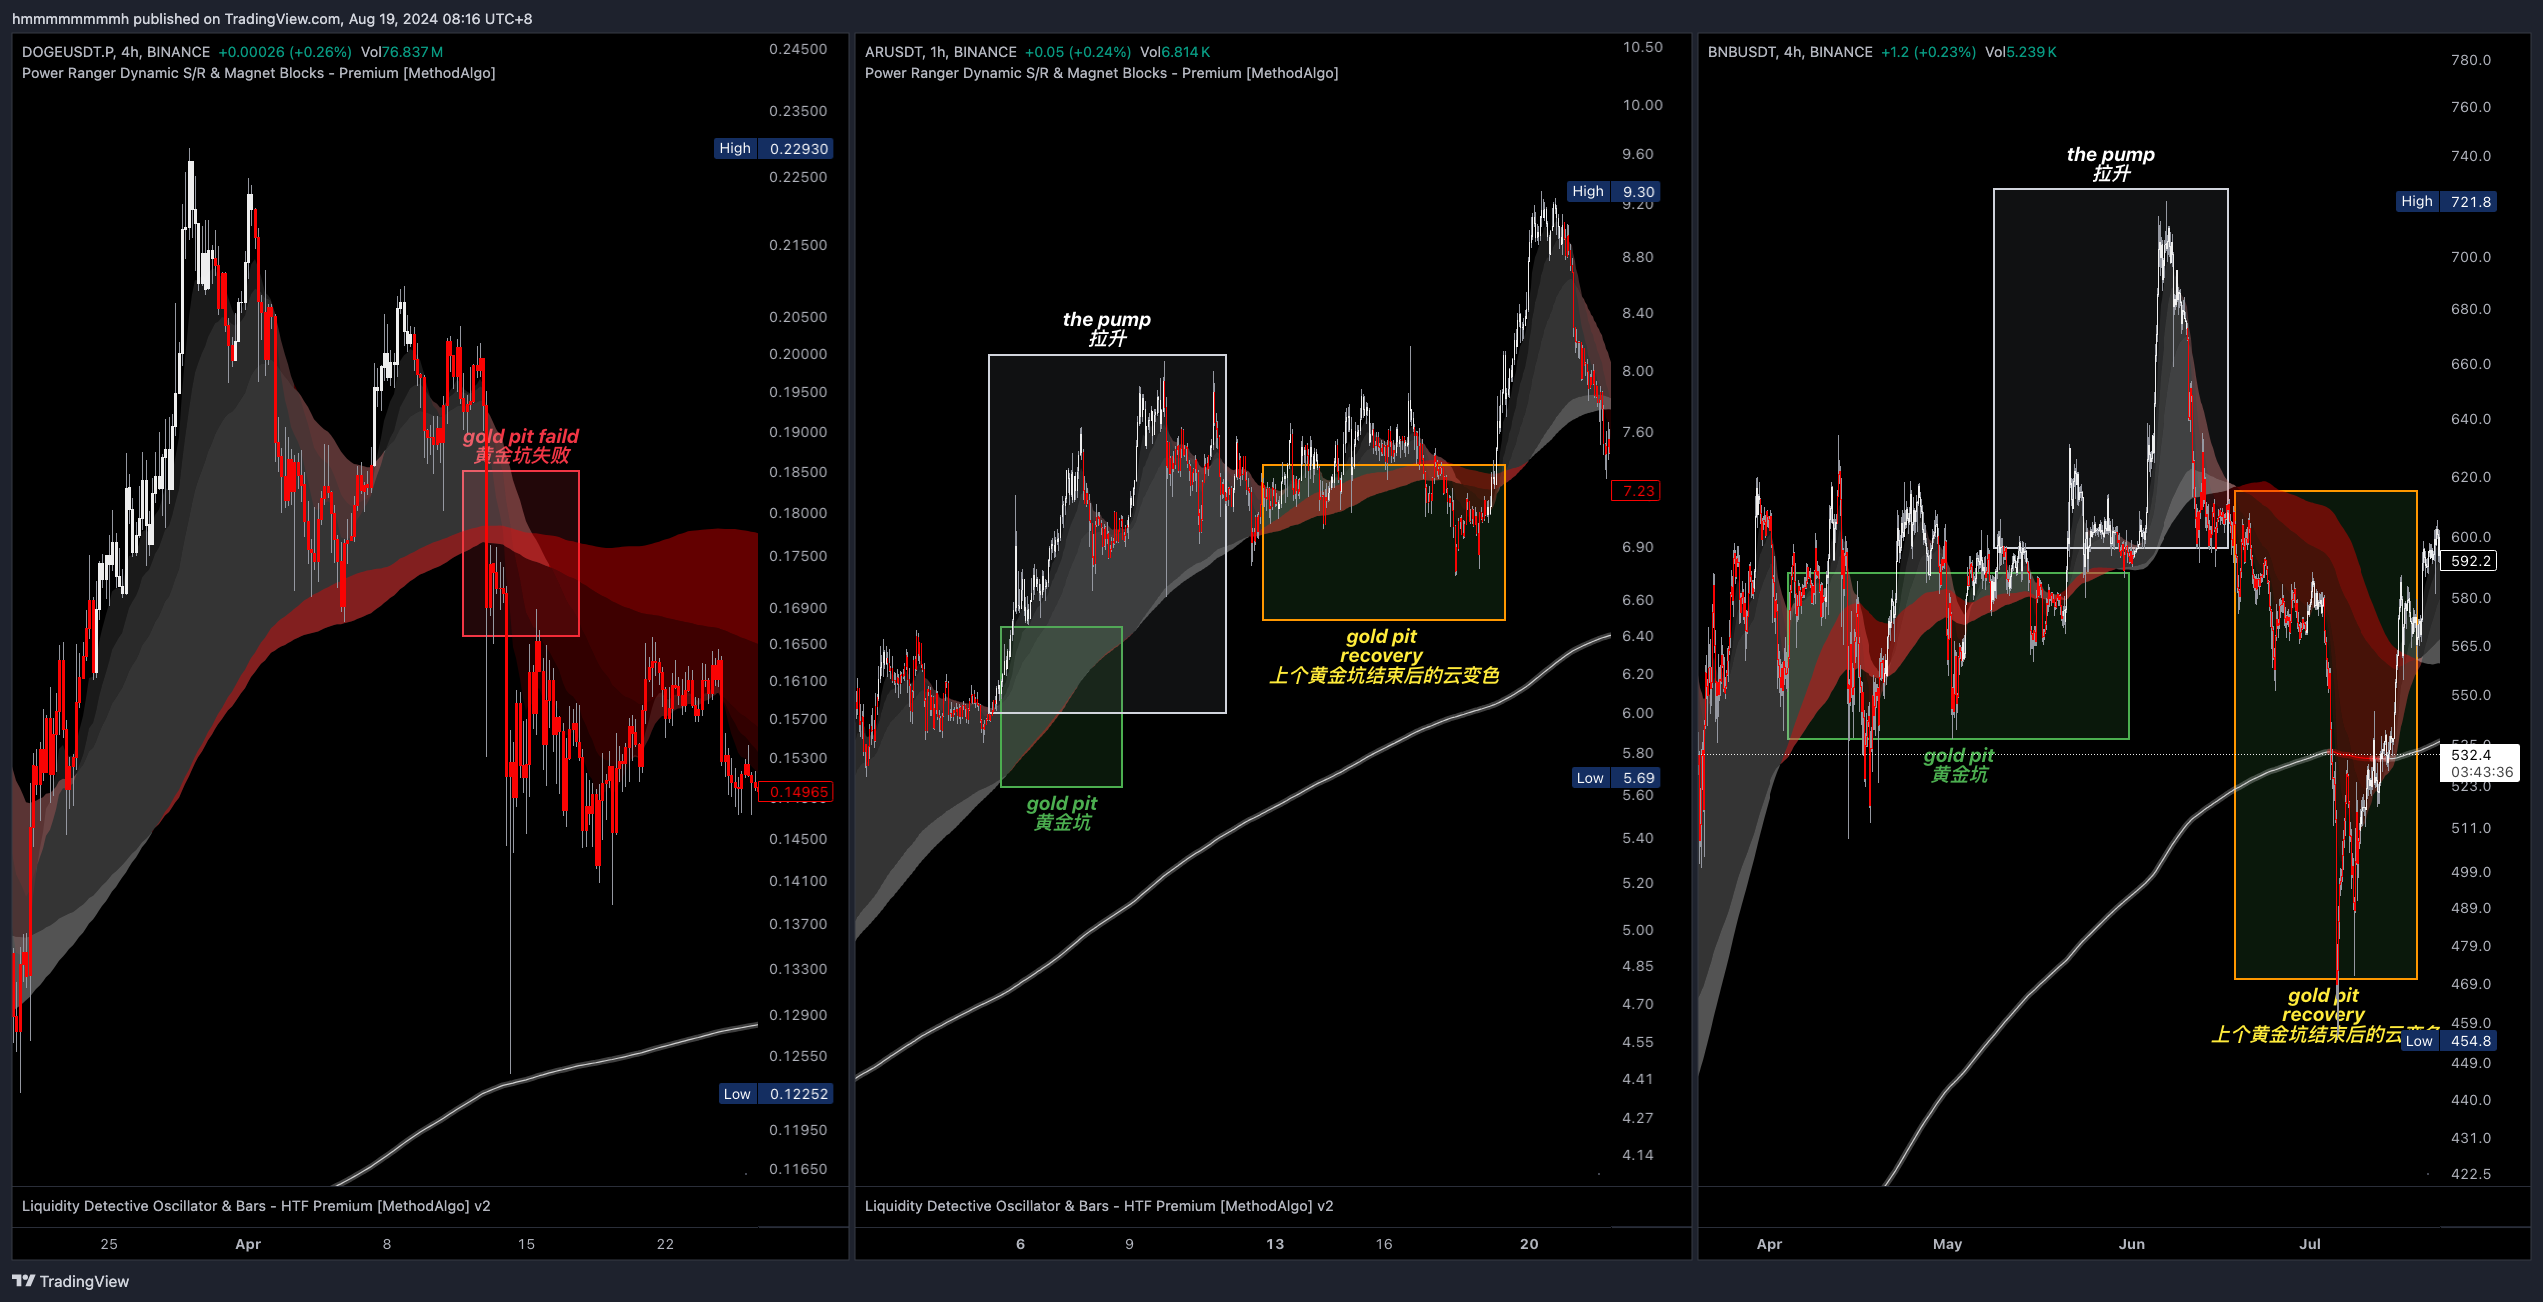
Golden Pit
This pattern only appears in a Healthy Cloud and signals the final push or drop in a small cycle.
Identifying the Golden Pit:
- In an uptrend
Healthy Cloud, theCloud Baseturns red while thethird Cloud Layerremains white, indicating a significant price surge when theCloud Basereturns to white, followed by a shift to a red cloud. - In a downtrend
Healthy Cloud, theCloud Baseturns white whilethe third Cloud Layerremains red, indicating a significant price drop when theCloud Basereturns to red, followed by a shift to a white cloud. - The first 1-2 occurrences of the Golden Pit in a
Healthy Cloudoften signal the final impulse move in the trend; further occurrences may indicate a trend reversal.
Open
- After the
Cloud Basechanges color, the price begins contracts and fluctuate near theCloud Base. This is a good dip entry area for the trend trading position, followed by a significant impulse move.
Closing and Pit Reset and Reversal
- Pit Reset : After the price impulse, it usually begins to retrace until the Cloud fully reverses color for pit reset.
- The Golden Pit induced price impulse may occur before or after the Pit is closed. take profit before pit starting to reset is the key. because the pit reset process have possibility end the current trend.
- After the Pit is closed and the Cloud fully reverses color for pit resetting, the key to determining the subsequent trend lies in the
Trendline. If the price breaks and holds theTrendline, the trend has reversed. If the price fails to break & hold theTrendlineand rebounds, the original trend resumes.
- After the Pit is closed and the Cloud fully reverses color for pit resetting, the key to determining the subsequent trend lies in the
Anomalies and Failures
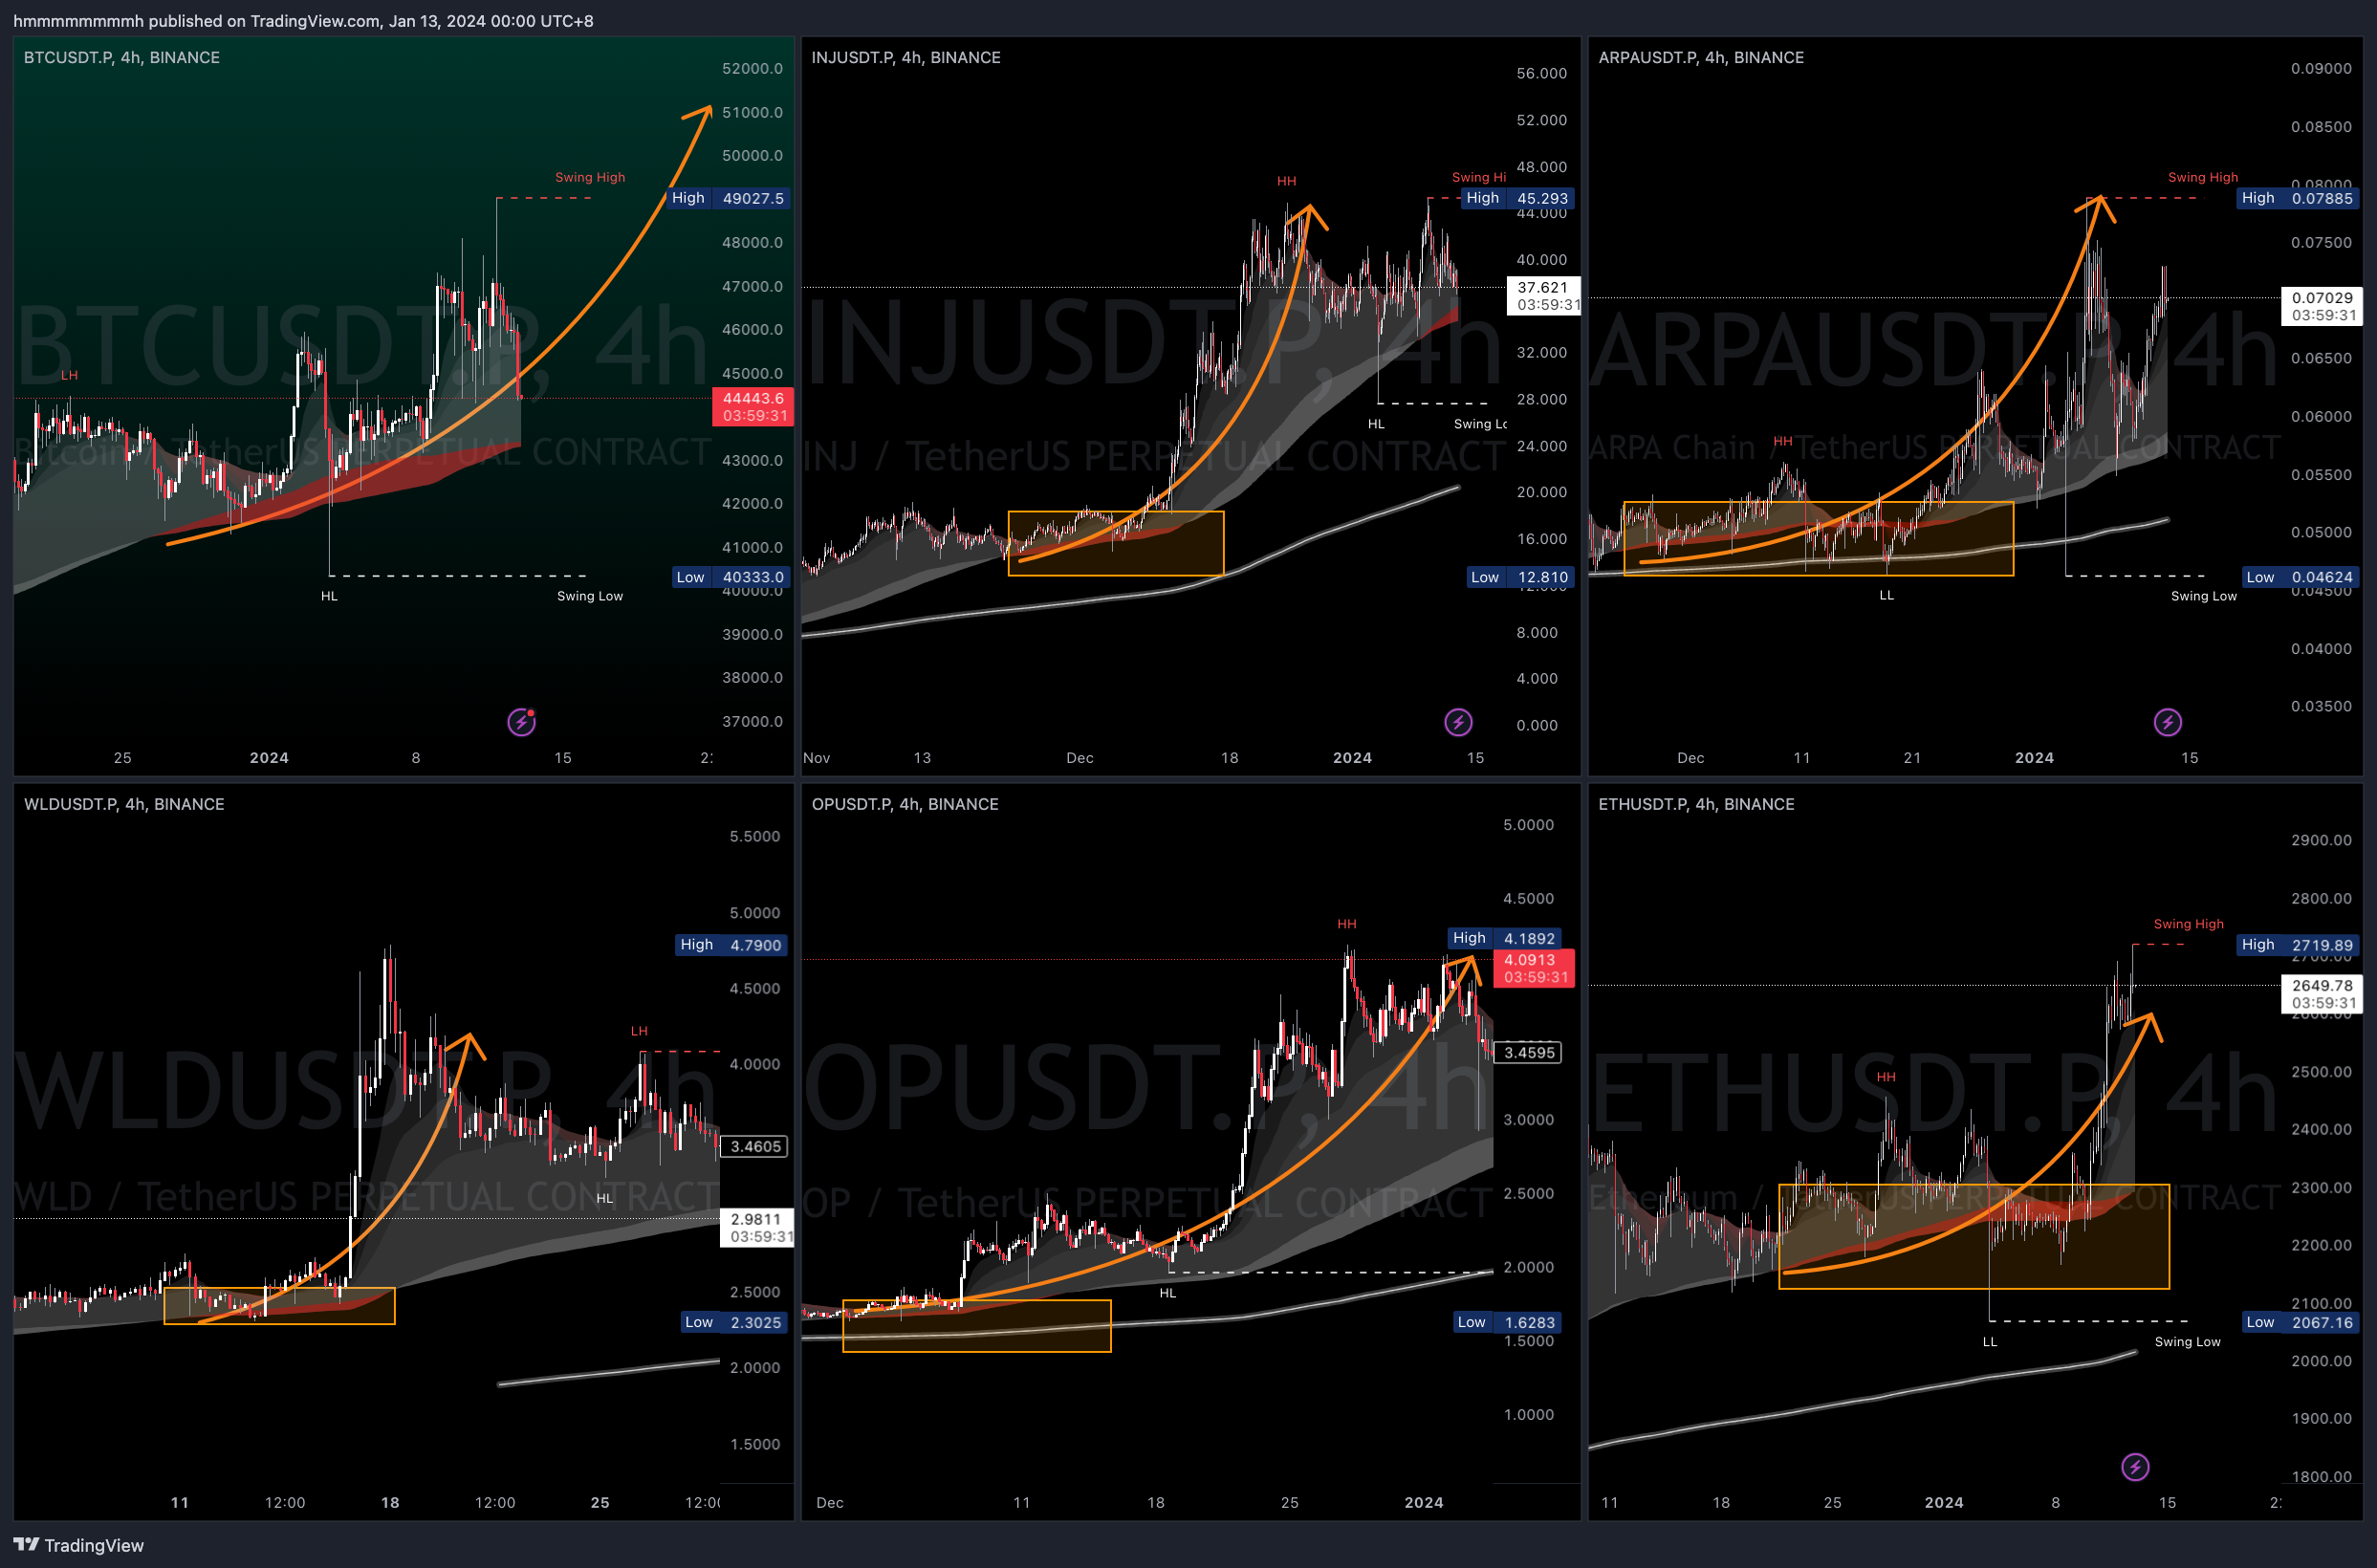
Markets are always unpredictable, and in real trading, patterns can appear in countless variations. In the examples below:
- Figure 3 shows the success
Open,Close, andPit Resetof the Golden Pit. - Figure 2 depicts a small Golden Pit with an expected surge. However, the subsequent similar pattern is not a new Golden Pit, as it does not meet the identifying conditions, specifically the condition that the
third Cloud Layerretains its trend color. This is actually a cloud color change phase ofPit Reset. subsequent surge unrelated to the previous pit. it is a trend resume. - Figure 1 illustrates that while the Golden Pit is a highly reliable pattern, it typically only appears 1-2 times in a strong trend. pattern successful rate drop significantly in subsequent appearance and it may signal a Reversal pattern, especially if the previous Pit’s have not or failed to reset.
Although the Golden Pit pattern can predict subsequent price rises or drops, the extent of these movements cannot be determined from the cloud pattern. You will need to use other tools from the PowerRanger toolbox, such as Fibonacci Extensions, volume profile, Pangolin Channel, Magnet, or Grim Reaper to make more accurate assessments for when the impulse end. because in the concept of SmartCloud, there are no ceiling and no bottom.
Chinese Dragon
This pattern features a relatively thin cloud with alternating red and white colors, following the trendline and moving in its direction, creating continuous swings. This pattern has significant volatility, so careful stop-loss placement is essential. It belongs to the category of unhealthy cloud patterns.
Key points for trading the Chinese Dragon pattern include buying below the trendline in an uptrend and shorting above the trendline in a downtrend. Watch for double-top and double-bottom patterns, and pay attention to HH/HL/LH/LL swing highs and lows. Due to the large swings, stop-losses can be tricky to place, so consider using a neutral grid bot within the swing range.
The Chinese Dragon cloud must meet all of the following conditions:
- Thin cloud
- Follows the trendline
- Large swings
Reversal Pattern
In an uptrend, if a fully opposite-colored cloud appears and there was no prior Golden Pit pattern to reset, it usually signals the end of the trend and the beginning of a reversal.
Identification Criteria:
- In an uptrend, the cloud and price are both above the
trendline, with avoid areabetween thecloudand thetrendline, and a reversal cloud appears. - In a downtrend, the cloud and price are both below the
trendline, with avoid areabetween thecloudand thetrendline, and a reversal cloud appears.
If a trader decides to trade the reversal trend, multiple take-profit (TP) levels should be set to prevent potential evolution into the Chinese Dragon pattern. The first TP should be placed near the trendline, and techniques like break-even (BE) stop-loss should be used. For the remaining TP levels, consider using other tools like Fibonacci extensions, volume distribution, Pangolin Channel, Magnet, Grim Reaper, etc., for predictions.
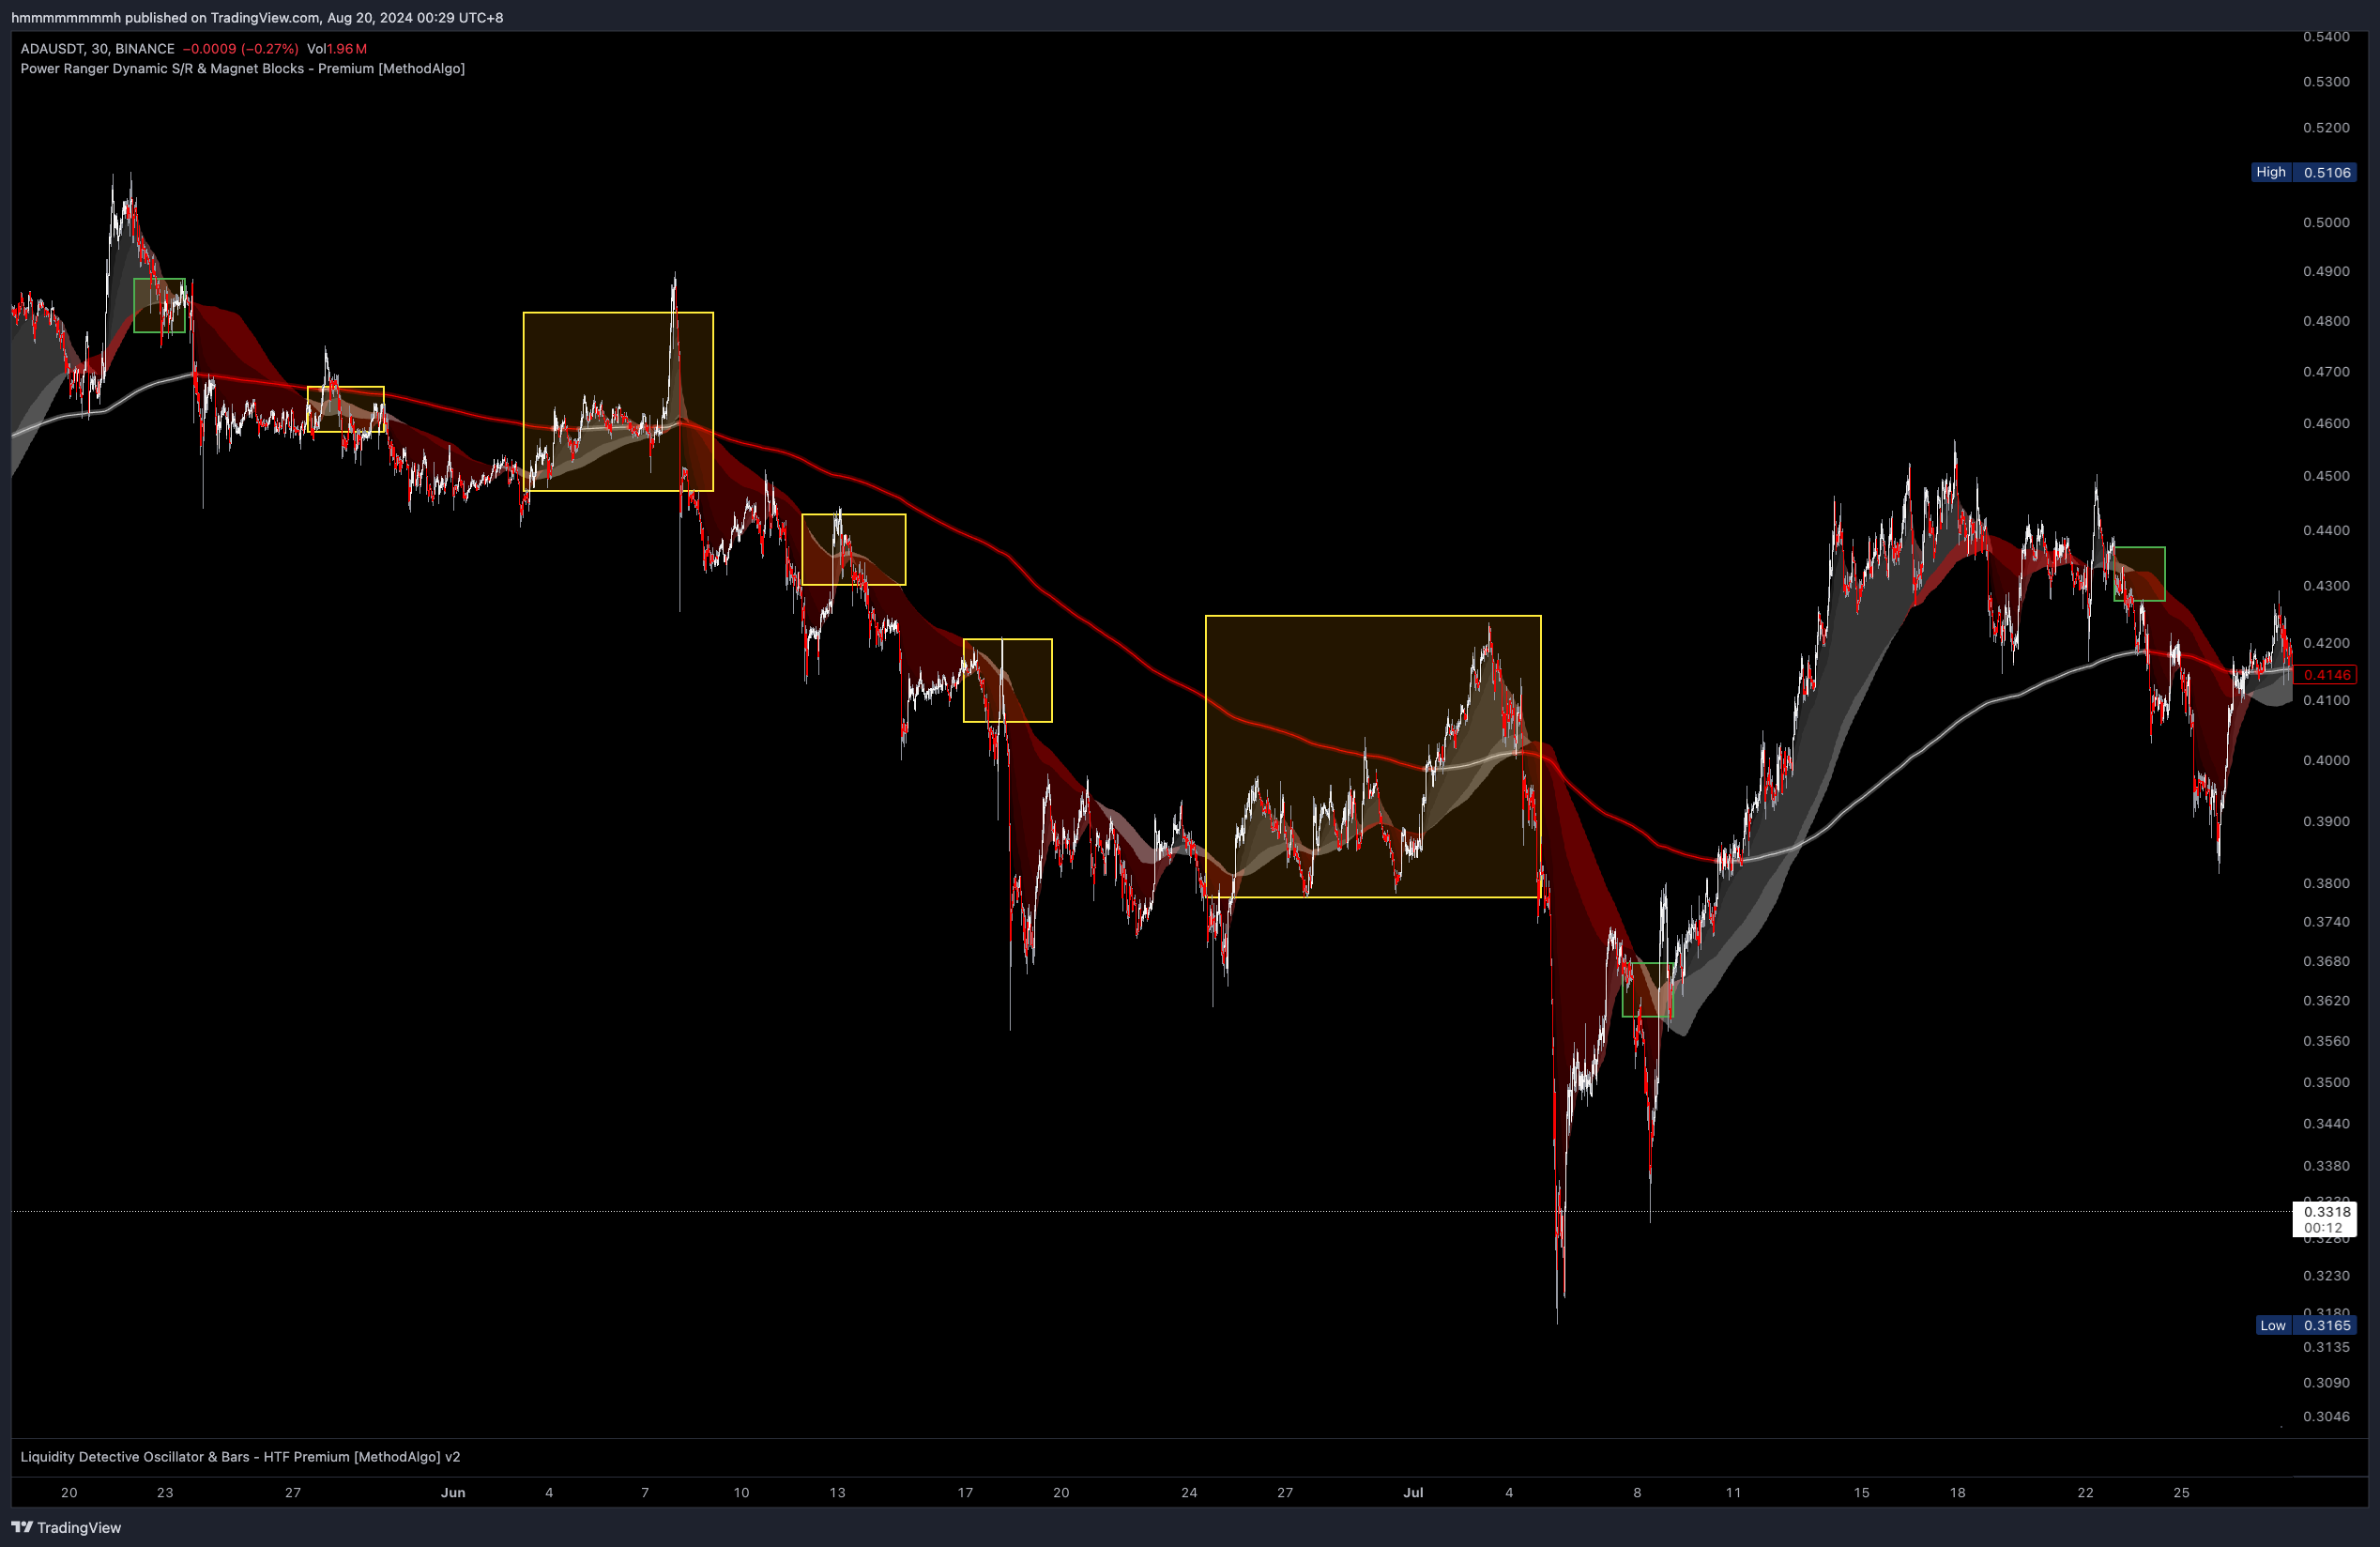
As previously mentioned, the market can be tricky, often distorting patterns to make analysis difficult. Not every reversal cloud on every chart will have a clear contour and obvious reversal like the examples above.
The following ADAUSDT example is a more ambiguous case. The pattern is blurred because the cloud is relatively thin, and the trend is not particularly strong. The green box marks the beginning of a reversal cloud that meets the identification criteria, while the yellow box indicates the Golden Pit pattern and its reset.
Strategies
In addition to trend analysis through patterns, SmartCloud offers the following trading strategies:
Entering a Trend from a Quality Dip
Unlike other tools like MA100 that define a dip as buying below MA100 in an uptrend, or sell above MA100 in a downtrend, which are small retracements, the concept of a dip in SmartCloud mainly focuses on the Golden Pit pattern and trendline dip. Similar to Fibonacci, these are large retracements.
- Golden Pit: When a Golden Pit appears, the ideal entry range is in the area where the
cloud basechanges color. Usually, the market provides opportunities, but sometimes, the market may start the impulse without retracing to the cloud base and close the Golden Pit after the impulse . The first Golden Pit is the best to trade; after the second, the success rate gradually decreases (it may not close and simply turn into a reversal pattern). - Trendline: There are usually two opportunities for the price to retrace near the
trendlineand then resume trend. Starting from the second time, the success rate gradually decreases (the price may not rebound after breaking thetrendline).
- Even if you are eager to enter a position, at least enter at Cloud Layer 2 or 3; avoid chasing highs or lows above Cloud Layer 1 to minimize initial unrealized losses after entry.
- If the uptrend has a large
void areaand you don't want to wait for the Golden Pit ortrendlinedip, pay attention to the moment when the price falls into thevoid area(the area between thecloudand thetrendline). This is often a good dip opportunity, usually appearing during the reset phase after the Golden Pit pattern closes. However, be cautious of the Reversal Pattern. - For more accurate timing and more precise entries, consider using the Grim Reaper and Liquidity Detective indicators to further optimize your trading plan.
Take-Profit Targets
In addition to using Fibonacci, volume distribution, Pangolin Channel, Magnet, Grim Reaper, etc., to confirm take-profit targets, the cloud base and trendline in SmartCloud should also be common reference points for taking profits, as they serve as support and resistance levels for small and large trends, respectively, often causing price reversals upon contact. The trendline, in particular.
Stop-Loss Targets
When there is a big void area, the trendline is a relatively safe stop-loss level. Typically, the market only moves towards the trendline after a sustained impulse or after a long period of accumulation/distribution in a sideways consolidation. However, the trendline should only be considered a safe stop-loss level, not necessarily the best one. Consider using Fibonacci or Grim Reaper for better target optimization.
Notes
- When the price is far from the
cloud edge, it will either consolidate sideways to let the cloud catch up or drop to touch thecloud. - The
cloud baseandtrendlineare important support/resistance levels; if the price moves to these levels and penetrates but does not hold, a natural rebound usually occurs. - The size of the
void areabetween thecloudandtrendlineindicates the strength of the trend. - When the price penetrates all
cloudsand thetrendline, it signals the end of the current trend or a trend reversal. - Everything above the
trendlineis an uptrend, and everything below is a downtrend. No matter how much the price rises or falls, if it does not break thetrendline, the trend bias should not change. The exception is when in a pressure cooker state, with thetrendlinecrossing through the middle of the price, SmartCloud may not provide a high-confidence trend bias; in this case, you can use other tools in our toolset to analyze the subsequent trend.
The engineers at MethodAlgo are proud of their work, but it's essential for you to understand that no indicator / algorithm can guarantee perfect success. Trading profits and losses are greatly influenced by the trader's psychology, knowledge, experience, and risk management.
The algorithmic interfaces we provide are all part of T.A.T.A. When trading in reality, traders should make their decision like T.A.T.A, considering various factors and signals from other tools to establish confluence system.
Any unclear explanations or errors in this tutorial? Please contact MethodAlgo's @Staff on the Discord Trading Terminal for corrections.