Previous Levels
Default parameters are set to “Previous 1 Week” and “Previous 1 Month.”
The following examples are based on these two periods.
Concept
Previous Levels is a time-fact-based analytical tool — unlike predictive indicators (such as trend lines, patterns, or momentum tools). It does not attempt to forecast price direction. Instead, it marks the highest and lowest prices within completed time periods, helping traders understand the market’s structure and boundaries through the lens of time attribution.
This approach is derived from statistical market behavior:
Prices tend to cluster liquidity and reverse around period highs and lows.
These levels naturally carry market memory, making them important references for future trading decisions.
Strong Support & Resistance
In both market psychology and technical structure, time-based highs and lows are often seen as key levels:
- The previous month’s high represents the upper limit of the last full cycle — the ultimate balance between bulls and bears.
- The previous week’s low often marks a temporary liquidity trough.
When price revisits these areas, markets tend to:
- Trigger a wave of active or passive orders (like take-profits, stop-losses, or limit entries)
- Induce counter-trend moves or breakouts
- Exhibit liquidity stop-hunt mechanisms
The default “Previous Week” and “Previous Month” levels are widely regarded as major support/resistance zones, suitable for:
- Taking profits or partial exits
- Validating breakout effectiveness for trend continuation
- Initiating counter-trades upon rejection
In the MethodAlgo suite, tools such as Previous Levels(Time-Based S/R), Trendline, Golden Pit, and Liquidity gap from GrimReaper are all belong to the Strong Support/Resistance family
Stop-Hunt Mechanism (Fakeout / Reversal Trigger)
A stop hunt is a common phenomenon — where major players briefly push price beyond key levels to trigger opposing stop orders, absorb liquidity, and then reverse direction.
This Time-Based S/R tool is one of the tools helps identify these liquidity trap zones in advance.
For instance, if price breaks above the previous month’s high and is quickly rejected, it often indicates that liquidity has been cleared and a reversal is likely.
Learn more about Stop-Hunt
In-Depth Stop Loss Hunting Mechanism
The stop loss hunting mechanism (Stop Loss Hunting / Stophunt) in financial markets involves large institutions or liquidity providers pushing prices briefly to hit concentrated retail stop-loss zones, thereby creating liquidity and volatility opportunities.
This is not a conspiracy theory, but a natural byproduct of market microstructure and human biases. This article systematically analyzes this common yet misunderstood market phenomenon, from its mechanistic principles and structural causes to coping frameworks.
Stop loss hunting (Stophunt), commonly known as "stop hunting", is evident across global financial markets.
Its core logic is that stop-loss orders in the market convert to market orders when prices break key levels, providing instantaneous liquidity.
Large participants or algorithms can exploit these liquidity spikes through short-term breakouts and rapid reversals to capture spreads.
This phenomenon is not a deliberate act targeting individual traders but results from order book structures, crowd behavior clustering, and algorithmic optimization.
With the proliferation of high-frequency trading (HFT) and automated market making, this "liquidity grabbing" mechanism has become increasingly prominent in cryptocurrency markets (especially in major pairs like BTC/USDT and ETH/USDT).
The Essence of Liquidity Grabs
The root of stop loss hunting is liquidity grabbing (Liquidity Grab).
In the order book, retail stop-losses are typically clustered around visible support/resistance levels—such as previous highs/lows, round numbers, Fibonacci levels, or below trendlines.
These levels form what are known as "liquidity pools" (Liquidity Pools).
Institutional algorithms can push prices slightly to briefly breach these key zones, triggering a large number of stop-loss market orders.
At this point, the stop-loss orders passively turn into selling or buying pressure, sparking a chain of transactions—a "cascade effect" (Cascade Effect).
The result often appears as a "fake breakout" (Fakeout) or a candlestick with a long wick (Wick).
In this instant release of liquidity, institutions can buy low and sell high or unwind existing positions for profit.
From a behavioral finance perspective, this phenomenon also reflects traders' "round number bias" and "herding in stop-loss placement," where people tend to set stops at obvious, psychologically "safe" locations.
You Can Use This Concept For:
- Identifying potential stop loss hunting zones
- Optimizing stop-loss placement to reduce passive triggers
- Understanding the relationship between liquidity and price action
- Viewing "fake breakouts" more rationally from a mechanistic angle
Core Principles
Key Process Breakdown
- Target Identification: Algorithms spot "liquidity pockets" in the order book where stops are concentrated, typically 1–2% below support or above resistance.
- Inducement to Hit: Through active trades or small pushes, prices break these zones to trigger stops.
- Chain Reaction: Stop orders convert to market orders, causing a brief liquidity cascade and "flash crash"-like volatility.
- Reversal for Profit: After liquidity is released, prices quickly revert, allowing initiators to hedge or reverse trade in the reversal range.
Relationship to Market Efficiency
Stop-loss orders themselves are risk-control tools that enhance market efficiency, but when clustered, they create a "clustering effect," amplifying short-term volatility.
A 2024 simulation study published by ScitePress indicates that, under specific market conditions, concentrated stop triggers can increase short-term price volatility by about 27% and induce cascade transaction effects (Cascade Effect)1.
Meanwhile, 2025 research and market observations note that in crypto markets, algorithmic strategies actively identify and exploit these liquidity features for excess profits2.
These findings remind us: Stop loss hunting is not a manipulation conspiracy but a byproduct of "liquidity optimization" in high-frequency environments.
Short-term prices may be disturbed, but long-term trends still follow broader supply-demand and capital flow dynamics.
Why "Stop Hunting" Happens
The roots of stop loss hunting lie in the interplay of microstructure and behavioral patterns.
-
Structural Level:
Market makers and institutional algorithms bear quoting obligations and need liquidity for inventory adjustments. Stop zones provide a "natural source of counterpart orders."
When natural volume is scarce, triggering stops becomes a means to "acquire liquidity." -
Behavioral Level:
Retail traders tend to place stops at "round numbers" or "obvious levels," turning these into liquidity hotspots.
Additionally, news events or low-liquidity sessions (e.g., end of Asian trading) are more prone to brief price vacuums.
Stop hunting behavior does not equate to "malicious manipulation."
In most cases, it is a natural price discovery process;
However, if it involves deliberately creating false liquidity or inducing trades, it may constitute market manipulation in certain jurisdictions (e.g., spoofing or fake orders), which must be distinguished.
How to Identify Stop Hunting Signals
Identifying stop hunting requires combining structural and behavioral dimensions, not just relying on charts.
Typical features include:
- Price Patterns: Long wicks touching key levels followed by rapid reversals, forming clear "fakeouts" (Fakeout).
- Volume Anomalies: Sudden volume surge at the trigger, but lacking follow-through trend.
- Timing Characteristics: Often occurs during low-liquidity periods or ahead of major data releases, when institutions can move prices at lower cost.
- Historical Traits: If a price zone repeatedly shows "probe-and-bounce" patterns, it may be a recurring stop hunting area.
In the MethodAlgo series tools, indicators like "stop-hunt," "liquidity gaps," "timezone bandits," "previous levels," "Fibonacci," and "Swings" are based on these principles,
helping traders more intuitively identify and leverage this mechanism.
Coping Strategies: Multi-Layered Defense and Counter-Thinking
Relying solely on mechanical stops (e.g., OCO orders) makes you an easy liquidity target.
More effective approaches involve layered and contextual strategies:
Basic Layer: Stop-Loss Placement Optimization
- Mental Stops: Avoid pre-placing orders; manually assess and execute upon touch to reduce exposure.
- Position Bias: Steer clear of obvious levels for stops; slightly offset from common zones to increase randomness.
Advanced Layer: Counter-Exploitation
- Liquidity Reversal Entries: Wait for confirmation of reversal signals at "breached" key levels before entering, turning passive into active.
- Layered Stops: Use fixed stops for part of the position, manual or delayed for the rest, reducing one-shot trigger risk.
Expert Layer: Systematic Judgment
- Multi-Timeframe Confirmation: Verify short-term fake breaks against medium- to long-term trends to avoid misjudgments.
- Integrated Risk Management: Stop design should align with position sizing, capital management, and psychological tolerance.
Strategy Comparison Analysis
| Strategy Type | Advantages | Disadvantages | Applicable Markets |
|---|---|---|---|
| Mental Stops | Reduces clustering triggers, flexible adaptation | Requires high discipline, prone to emotional interference | Crypto / Forex |
| Reversal Entries | Turns passive to active, high profit potential | Needs experience for identification, many false signals | High-Volatility Periods |
| Layered Management | Disperses risk, buffers psychological stress | Complex execution, needs clear rules | All Markets |
| Trailing Stops | Locks in profits, automated execution | Easily swept out early in ranging markets | Trending Conditions |
Stop loss hunting reveals the essence of market "zero sum" game.
Retail traders' "safety nets" often serve as institutions' "entry signals."
Understanding its mechanism is not about "fighting the big players," but enabling traders to respond to the market in a more objective, systematic way.
References
Footnotes
-
ScitePress (2024). Simulation Study on Stop-Loss Orders and Market Volatility.
The study shows that, in specific simulated environments, concentrated stop triggers can amplify short-term volatility by about 27% and form "cascade" transaction effects. ↩ -
Yavuz Akbay (2025). Stop Hunts in Financial Markets. Medium market observation article notes that algorithmic trading in crypto markets often exploits stop-zone liquidity to create reversal opportunities. This is a practical observation, not peer-reviewed literature. ↩
You Can Use It To
- Identify strong support and resistance zones
- Plan take-profit or stop-loss levels
- Define reversal or trend continuation entries
- Support both trend-following and counter-trend strategies
- Observe how price reacts to key time levels
Interface & Layers
The following example demonstrates the Previous Week setup.
Interface
- Range Definition: The high and low of a chosen period (e.g., previous week).
- Update Frequency: Zones update only when a new period starts (every Monday at 0:00 UTC+0 — exchange timezone).
- Multi-Timeframe Consistency: Zone positions remain consistent across all timeframes (1h, 4h, 1D, etc.).
Layers
- Resistance Zone:
- Previous week: red
- Current week: yellow
- Upper edge = previous week high
- Lower edge = suggested order level (long take-profit or short entry).
- Support Zone:
- Previous week: white
- Current week: green
- Lower edge = previous week low
- Upper edge = suggested order level (short take-profit or long entry).
- Label Example:
P 1W H= “Previous 1 Week High”- P = Previous (historical)
- X = Time quantity
- Y = Time unit (H/D/W/M)
- H / L = High / Low
Suggested Order Levels are conceptual references, not algorithmic predictions.
They are based on common trading practices — such as placing orders slightly above or below previous highs or lows — to improve execution probability and optimize the risk–reward (R/R) ratio.
Double Top / Bottom
For large-cap assets (e.g., BTC, ETH), price highs often form double tops/bottoms or minor fakeouts.
In such structures, the precise extent to which the second pivot penetrates or falls short of the previous level can only be determined using exchange order book data, which TradingView indicators do not have access to.
Therefore, the suggested order levels are fixed conceptual zones, designed to enhance order fill rates while maintaining risk neutrality.
Traders should always refine these levels according to the asset’s characteristics and current market structure.
Comparison with Traditional Structural S/R
MethodAlgo’s support/resistance system includes four categories:
| Feature | Time-Based S/R | Structural S/R | Momentum S/R | Liquidity S/R |
|---|---|---|---|---|
| Type | Fact-based | Predictive | Predictive | Hybrid |
| Factor Basis | Time cycle | Structure & trend patterns | Momentum / RSI-type signals | Open interest & volume distribution |
| Update Frequency | Fixed cycle | Dynamic (price-structure-based) | Based on sampling length | Exchange data |
| Breakout Validation | Requires confirmation | Requires confirmation | Not applicable | Not applicable |
| Stop-Hunt Frequency | High | Base on timeframe | N/A | High |
| Typical Use Case | Stophunt, strong S/R trades | Trend continuation, pattern trading | Entry timing optimization | Bottom-fishing, short squeeze |
Difference from “Timezone Bandit”
Both tools visualize time-based S/R structures, but serve different purposes:
Previous Levels(Time-Based S/R) focuses on mid-term structure and strong levels,
while Timezone Bandit emphasizes short-term intraday liquidity cycles.
| Tool | Time Cycle | Recommended TF | Strategy Type | Analysis Focus |
|---|---|---|---|---|
| Previous Levels | Custom (hour/week/month) | Any | Strong S/R, stop-hunt, breakout | General-purpose |
| Timezone Bandit | Global market sessions | 15m and below | Session pattern, session stop-hunt | Short-term |
Sample & Strategy
The following explains the behavioral characteristics and trading logic of Time-Based S/R from a time-sequence and market-structure perspective.
Core Characteristics
Since this tool is based on historical fixed time periods, it features:
- Time Anchoring — Reflects cyclical memory; e.g., this week’s range doesn’t alter last week’s.
- Stop-Hunt Priority — High probability of reversals after brief breakouts.
- Strong S/R Behavior — The longer the cycle, the stronger the level.
- Fakeout Tolerance — Minor breaches are still considered valid zones.
- Breakout Confirmation — Requires retest or validation by other MethodAlgo tools.
- Bias Shift — Once confirmed, resistance becomes support and vice versa.
Sample Analytical Flow
The tool is so versatile, so we pick the current BTC chart for illustration.
and because this tool is time-centric, the analysis follows a linear time logic.
By observing how price reacts around period highs and lows, traders can better identify liquidity structures and reversal momentum, forming a time-based decision framework.
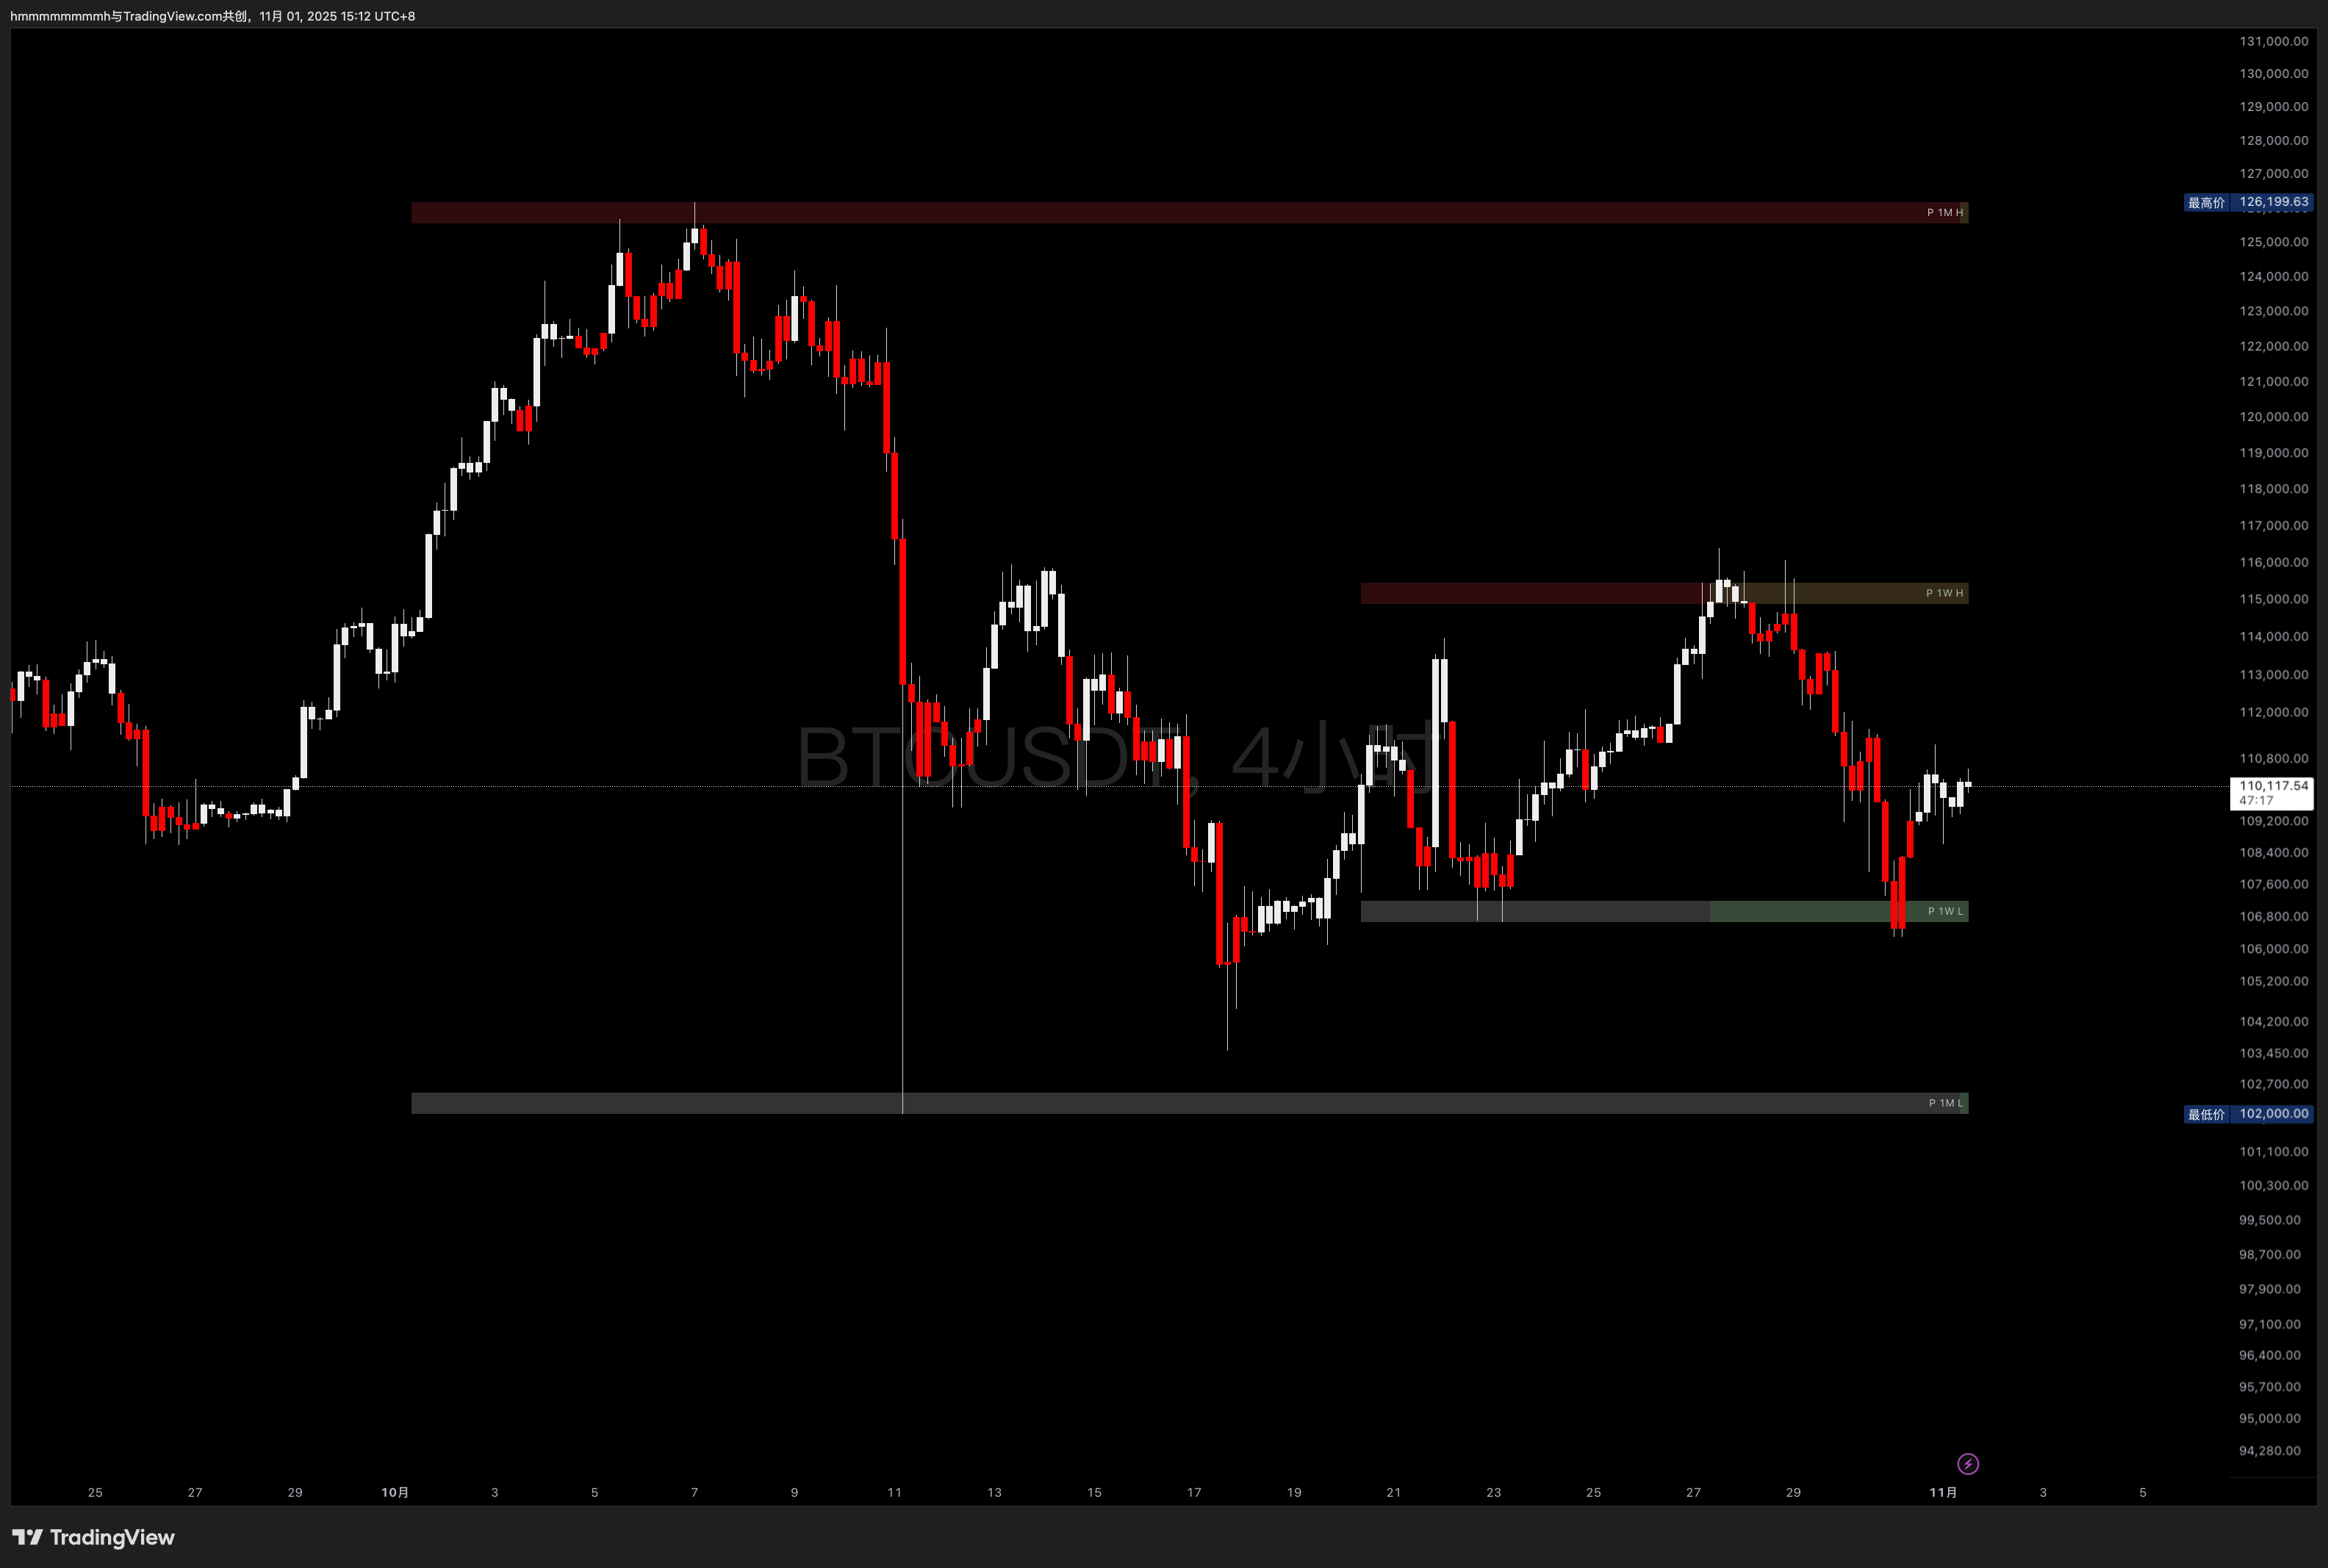
In the chart below:
- Green circles: previous month’s high & low
- Orange circles: previous week’s high & low
- If unsure how the tool distinguishes new vs. previous periods, refer back to Interface & Layers.
Chart context:
- The new month has just begun; current price oscillates in the lower-mid range of last month’s zone.
- In the begeinnig of the new week, price performs a stop-hunt to the last week’s high, then reverses sharply downward.
- The candle inside the top yellow circle marks the final candle of last week; the following higher candle starts the new week — a direct stop-hunt reversal.
- The reversal(week range) later confirms with a retest.
- Both the new week’s high and the previous-previous week’s high align near the 50% level of the prior monthly range (Fibonacci hidden in this chart, yet obvious to naked eyes).
- Subsequently, price performs another stop-hunt below last week’s low and bounces, retracing ~50% of that weekly range.
- Although the previous month’s low resembles a double bottom, a new month has just started — no stop-hunt confirmation yet.
 Figure 1 — BTCUSDT / 4H
As time progresses into the next week:
- Price drops immediately as the new week begins (blue arrow).
- Price consolidates at the previous month’s green support; though briefly pierced, it remains valid as no confirmed breakdown occurs.
- Despite a bearish flag pattern (yellow box), according to the Core Characteristics, the analytical bias still favors upward reversal — unless future price action confirms a downside continuation.
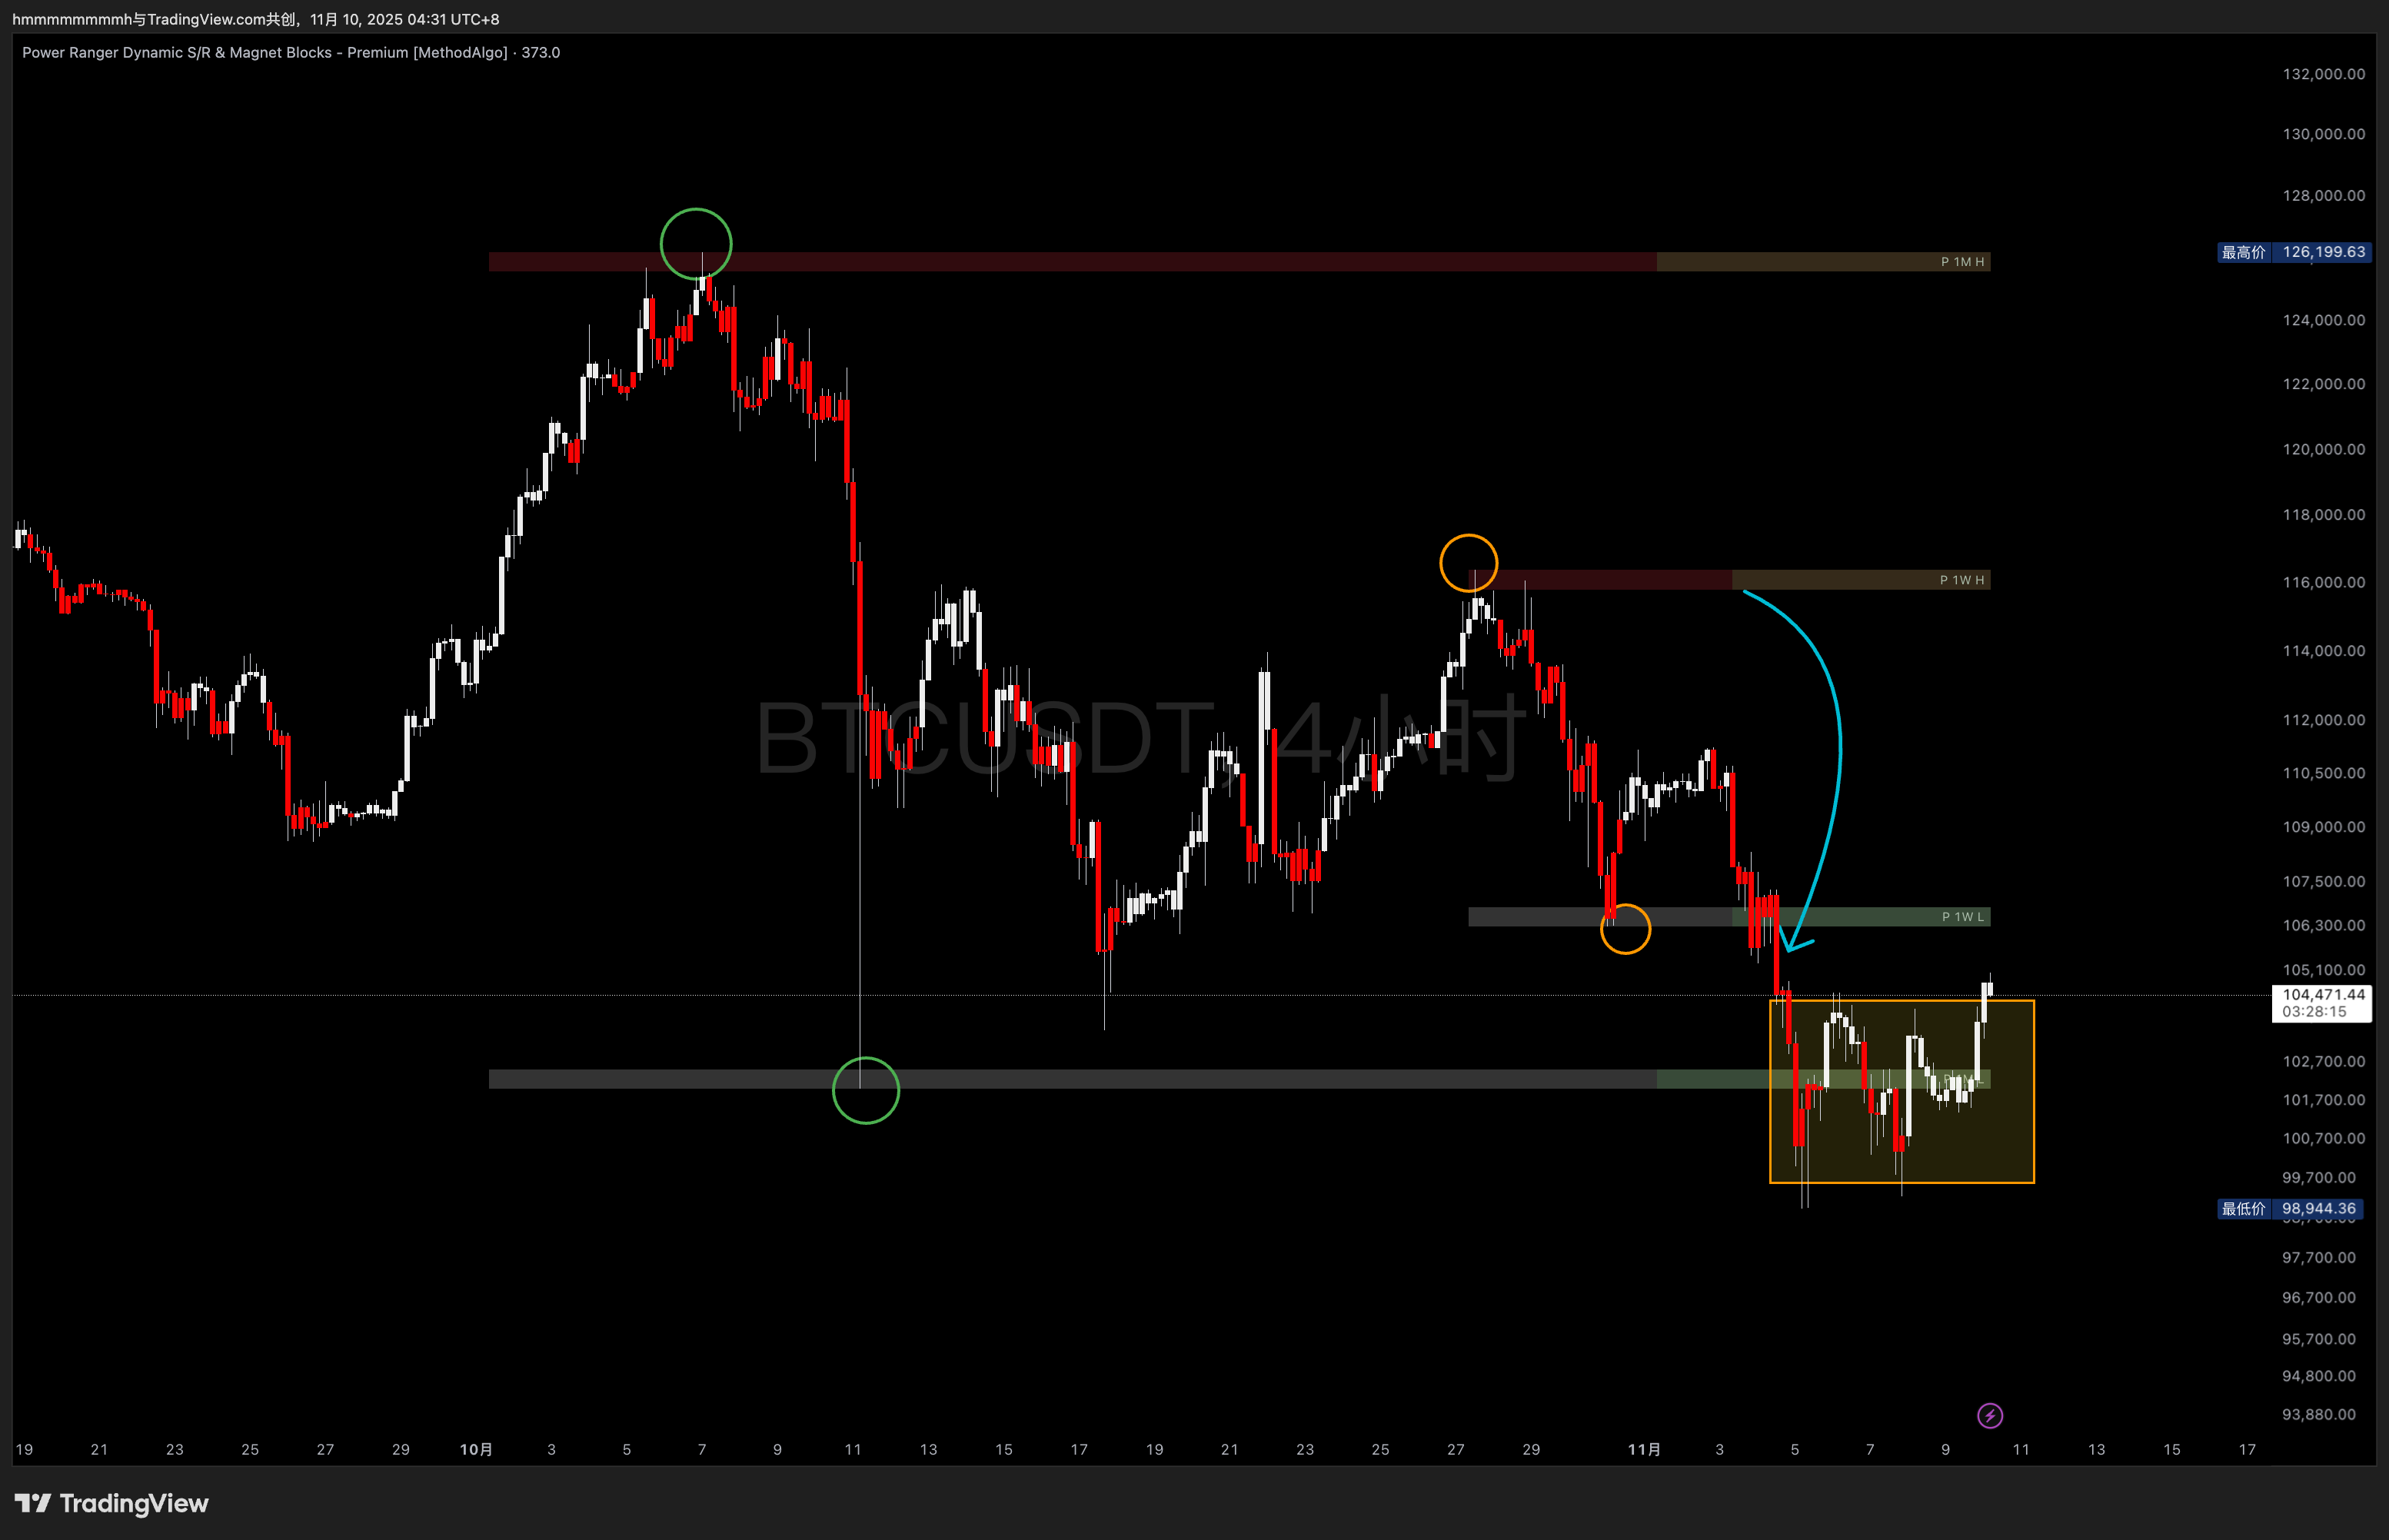 Figure 2 — BTCUSDT / 4H
Common Strategies
- General S/R Strategy
- Stop-Hunt Reversal Strategy
- Breakout Continuation Strategy
- Range-Bound Strategy
- Multi-Timeframe Confluence
Concept: Use previous week/month highs and lows as strong reference zones.
Use Case: Key level trading.
Execution Tips:
- Long TP near previous week/month high.
- Short TP near previous week/month low.
- For breakouts: wait for retest confirmation before entry.
- For reversals: trade opposite upon rejection from strong S/R.
Concept: Capture reversals triggered by fakeouts.
Execution Tips:
- Light short entries near prior highs.
- Light long entries near prior lows.
- Enter on quick reversal after brief breakout (Fakeout).
- Set entry inside the high/low zone to improve fill rate.
Concept: Follow the confirmed breakout move.
Execution Tips:
- Wait for retest confirmation or cross-tool validation from MethodAlgo.
- Confirmed breakout above previous high → long.
- Confirmed breakdown below previous low → short.
- Stop-loss inside the broken range.
Concept: Fade moves within defined ranges.
Execution Tips:
- Sell near resistance; buy near support.
- Reverse at range boundaries.
- Watch weekly resets (every Monday 0:00 UTC).
- Take profit at edges or key Fibonacci levels.
Concept: Combine multiple cycles for stronger confirmation.
Execution Tips:
- Use month/week as primary, week/day as secondary reference.
- Multi-timeframe confluence enhances reliability.
- Adjust reference period dynamically by volatility.
Settings
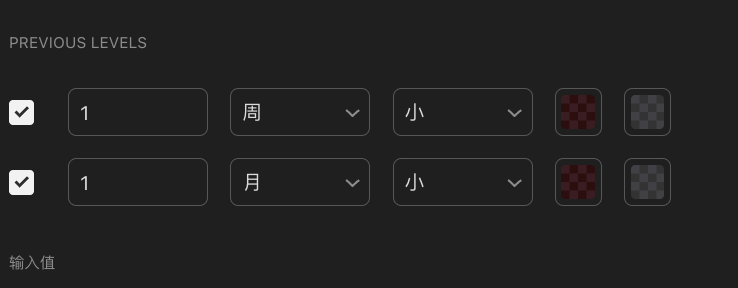
After enabled the PowerRanger → Features -> Previous Levels tool, locate Previous Levels in lower part of the setting to access configuration.
Currently, the tool supports two independent time-based S/R sets, each with flexible toggle control.
Each set includes:
- Checkbox: enable/disable
- Time quantity
- Time unit (hour/week/month)
- Font size
- Color
The engineers at MethodAlgo are proud of their work, but it's essential for you to understand that no indicator / algorithm can guarantee perfect success. Trading profits and losses are greatly influenced by the trader's psychology, knowledge, experience, and risk management.
The algorithmic interfaces we provide are all part of T.A.T.A. When trading in reality, traders should make their decision like T.A.T.A, considering various factors and signals from other tools to establish confluence system.