Pangolin Channel
Pangolin only supports Log Mode for charting. Please open Log Mode according to the Logarithmic mode tutorial. If using the default linear chart, the Pangolin channel will not display as parallel and may disintegrate.
Concept
Pangolin is an advanced real-time trend channel indicator designed based on the Standard Deviation algorithm.
Firstly, Pangolin calculates the parameters data set of different historical distances from candles to compute the mean and standard deviation in the trend. Then, based on the calculated mean line and the standard deviation multiplied by a multiplier value (default parameter in PowerRanger is 2, which means 2 standard deviations), it expands the upper and lower sides, providing traders with a trend channel calculated based on standard deviation offsets.
This calculation dynamically computes results for 56 different parameter sets in real-time intervals of seconds based on the timeframe the trader is currently viewing in your TradingView App. Finally, it displays the most accurate channel on the chart according to the following criteria:
- Relevance to recent trends
- Strength
- Ongoing trends
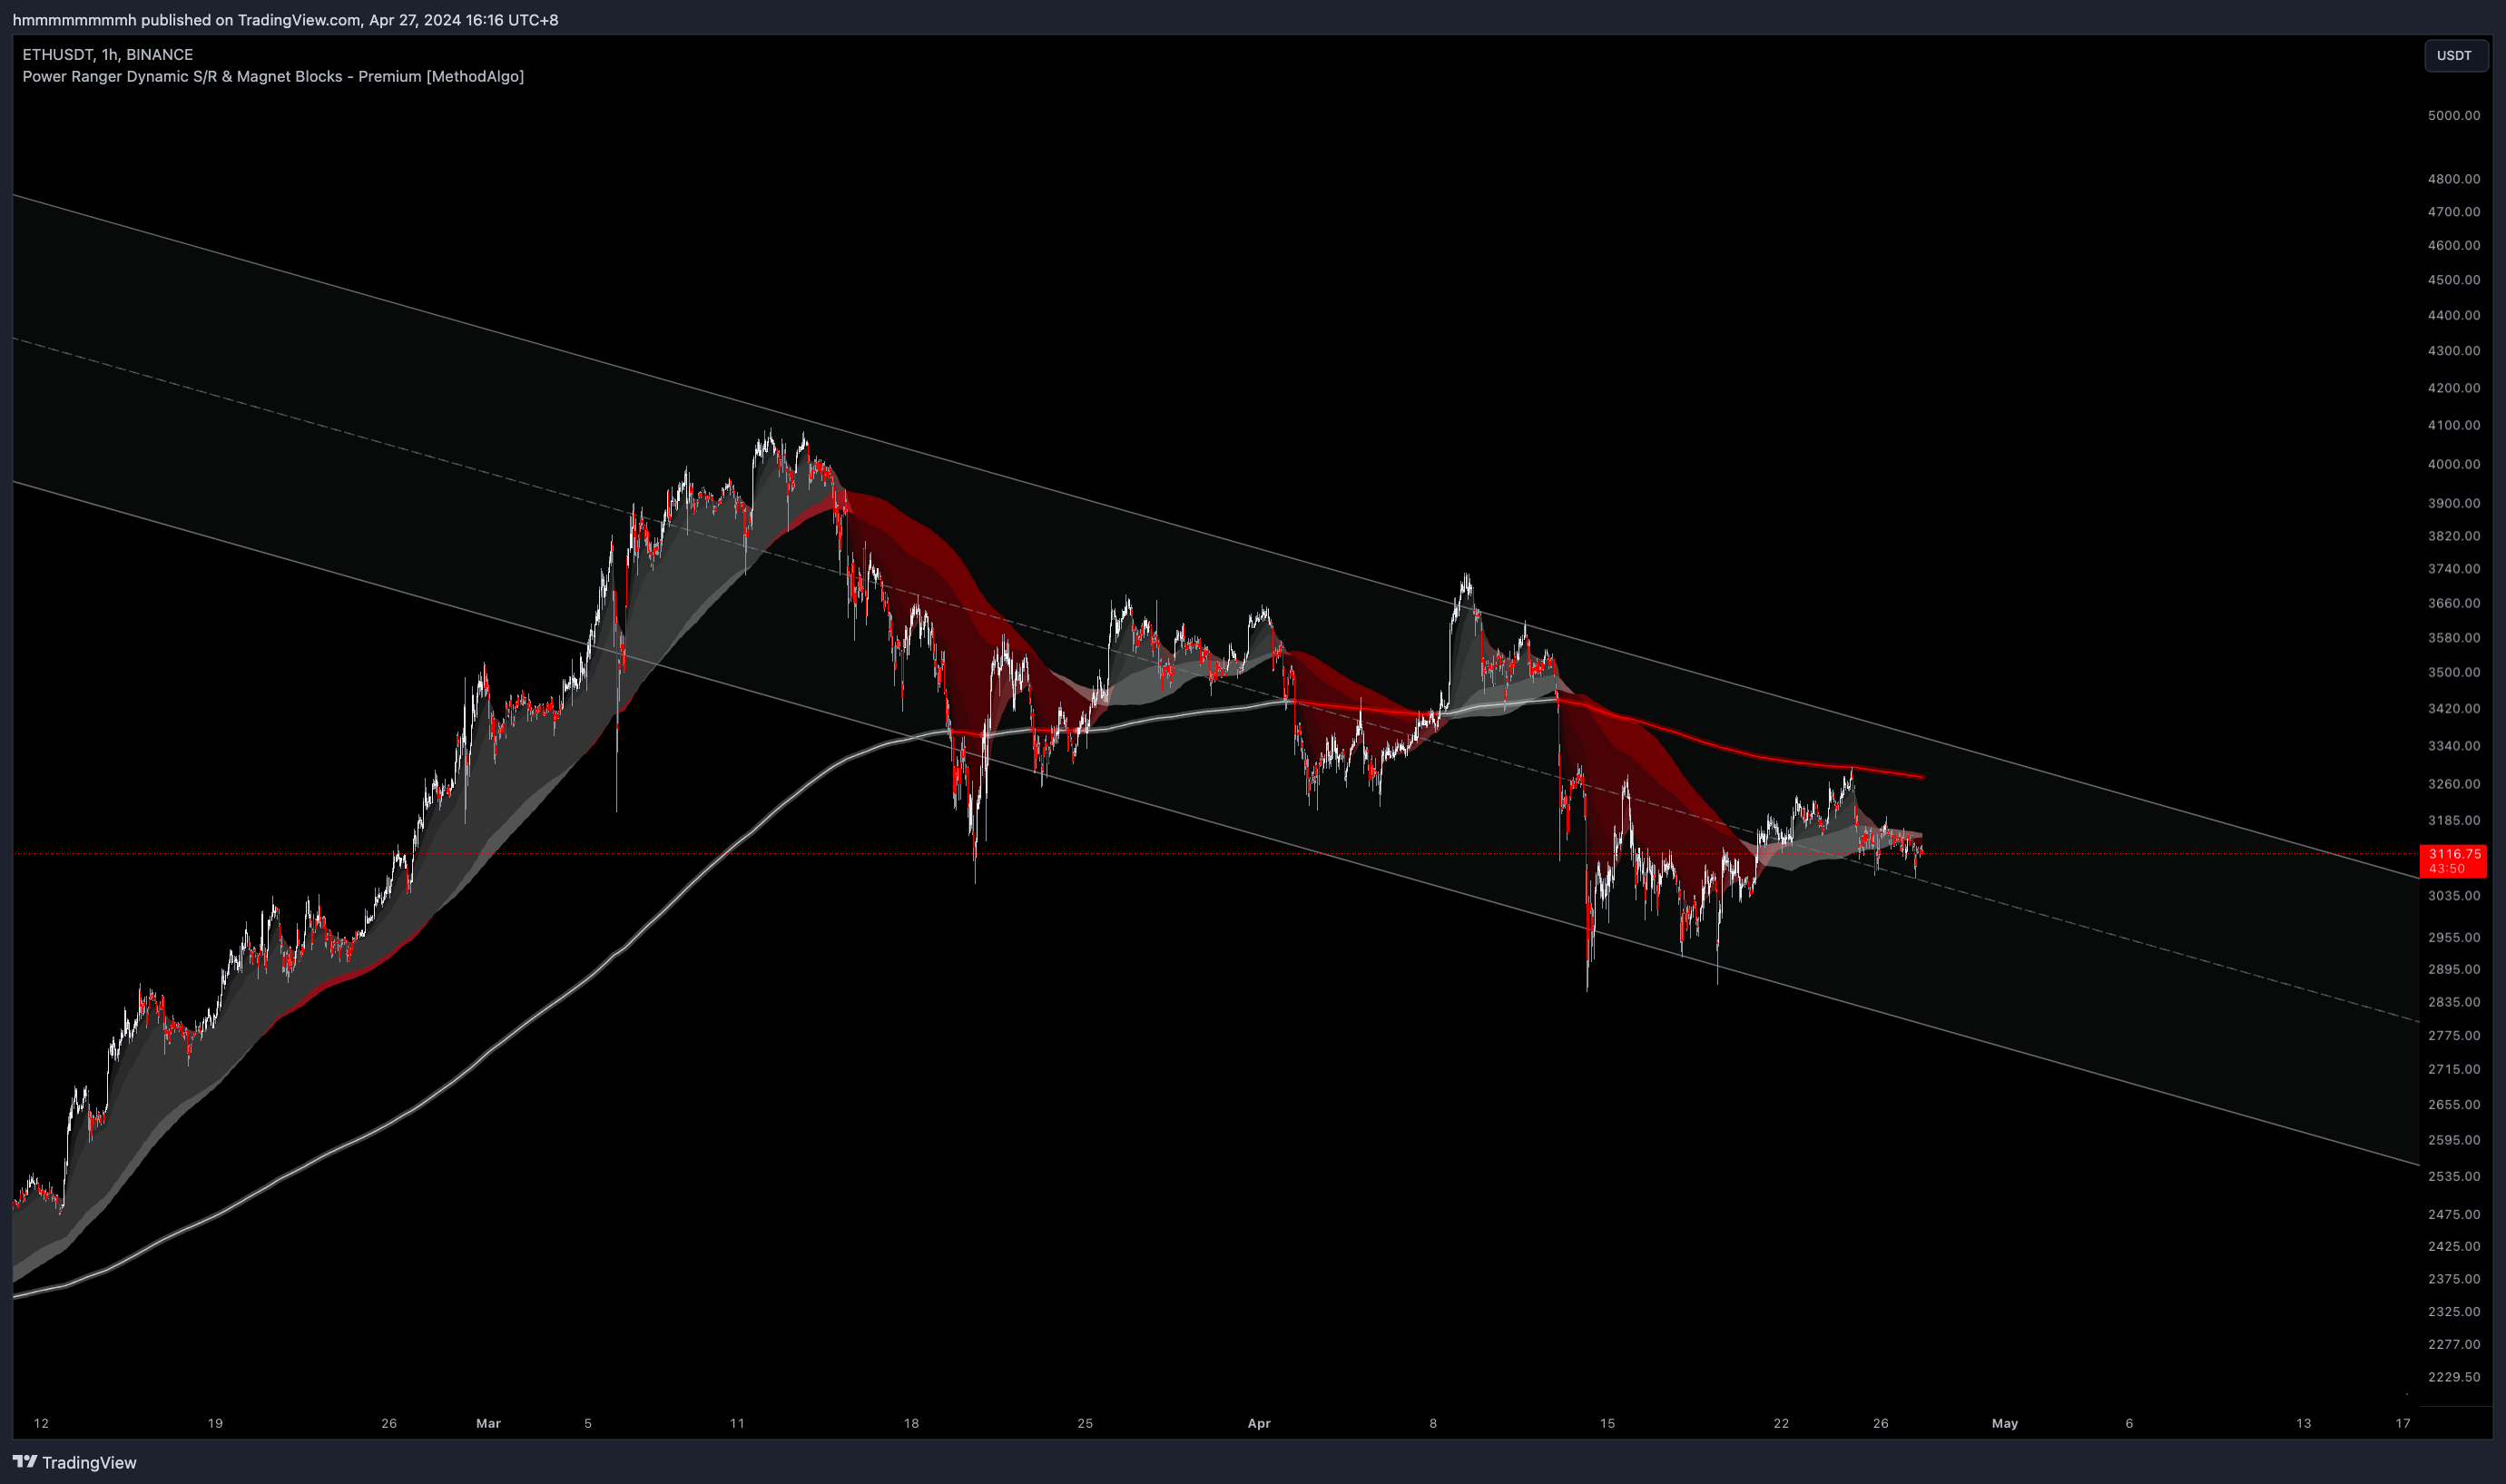
The channels calculated by this algorithm are entirely different from the channels drawn manually based on ranges and swings in our daily routines. It provides us with richer information such as trend midline, volatility range, and volatility framework, bringing immeasurable assistance to traders in trend and timing analysis.
In the graph above, it shows the channels calculated using our algorithm. As long as the correlation between our calculated Mean and the trend is high enough, we predict the price:
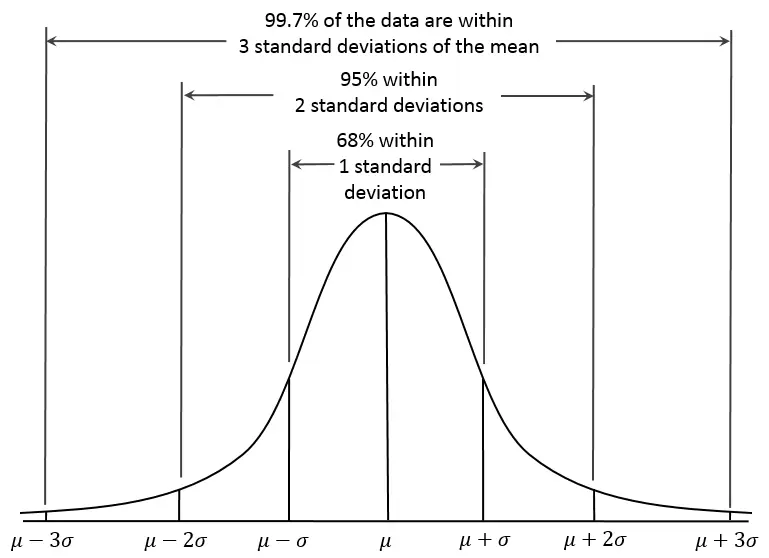
- Using 1 standard deviation: There's a 68% chance/time of volatility within the channel.
- Using 2 standard deviations (default parameter): There's a 95% chance/time of volatility within the channel.
- Using 3 standard deviations: There's a 99.7% chance/time of volatility within the channel.
*Currently, the 56 sets of parameters we use are the best-tuned parameters. The simplest way to verify the efficiency of the mean line is to check whether the midline of the channel has been respected as support and resistance by prices.
When Does the Channel Change?
If you use TradingView's Replay function, you'll notice that the channel adjusts itself in real-time with every price fluctuation. The current displayed channel might switch to a new trend channel based on algorithm scoring when:
- Prices spend a significant amount of time on single side, such as staying above the channel for longer periods, prompting the channel to adjust its slope accordingly to steeper inclines.
- A more precise Mean calculated from the new trend fluctuations, prompting the algorithm to automatically select and display the better, more accurate channel.
- Current micro trend fluctuations align with the overall trend fluctuations, prompting the algorithm to display a larger trend channel.
*As it's not a signal-type indicator, real-time adjustment of the channel doesn't count as repaint; it ensures that traders see the most accurate trend and slope predicted based on historical data at the observation time.
Confluence
- Assess overbought and oversold conditions.
- Quickly assess volatility and volatility range.
- Identify reversal opportunities.
- Identify suitable entry areas.
- Use the trend midline(Mean) as support/resistance.
- Strengthen the confluence of other indicator produced signals.
Interface
The Pangolin channel consists of three lines: the midline and upper and lower edge lines, forming a gray channel. Its style can be customized in the indicator settings.
If Max dev. in settings is enabled, a set of additional two line of 3 stddev from mean will be added to chart along with the customizable stddev channel.
Analysis Strategies
Swing Reversals: When prices touch the upper and lower ends and return to the channel, profit-taking at the midline often has a good success rate.Trend Trading: Long positions are only opened in the lower part of the ascending channel, while short positions are opened only in the upper part of the descending channel.Grid Robots: The channel range can be used as a reference for grid robot range, saving margin funds.DCA Robot Ranges: Use the Pangolin channel range on a higher timeframe to determine the buying range for DCA orders.
Examples
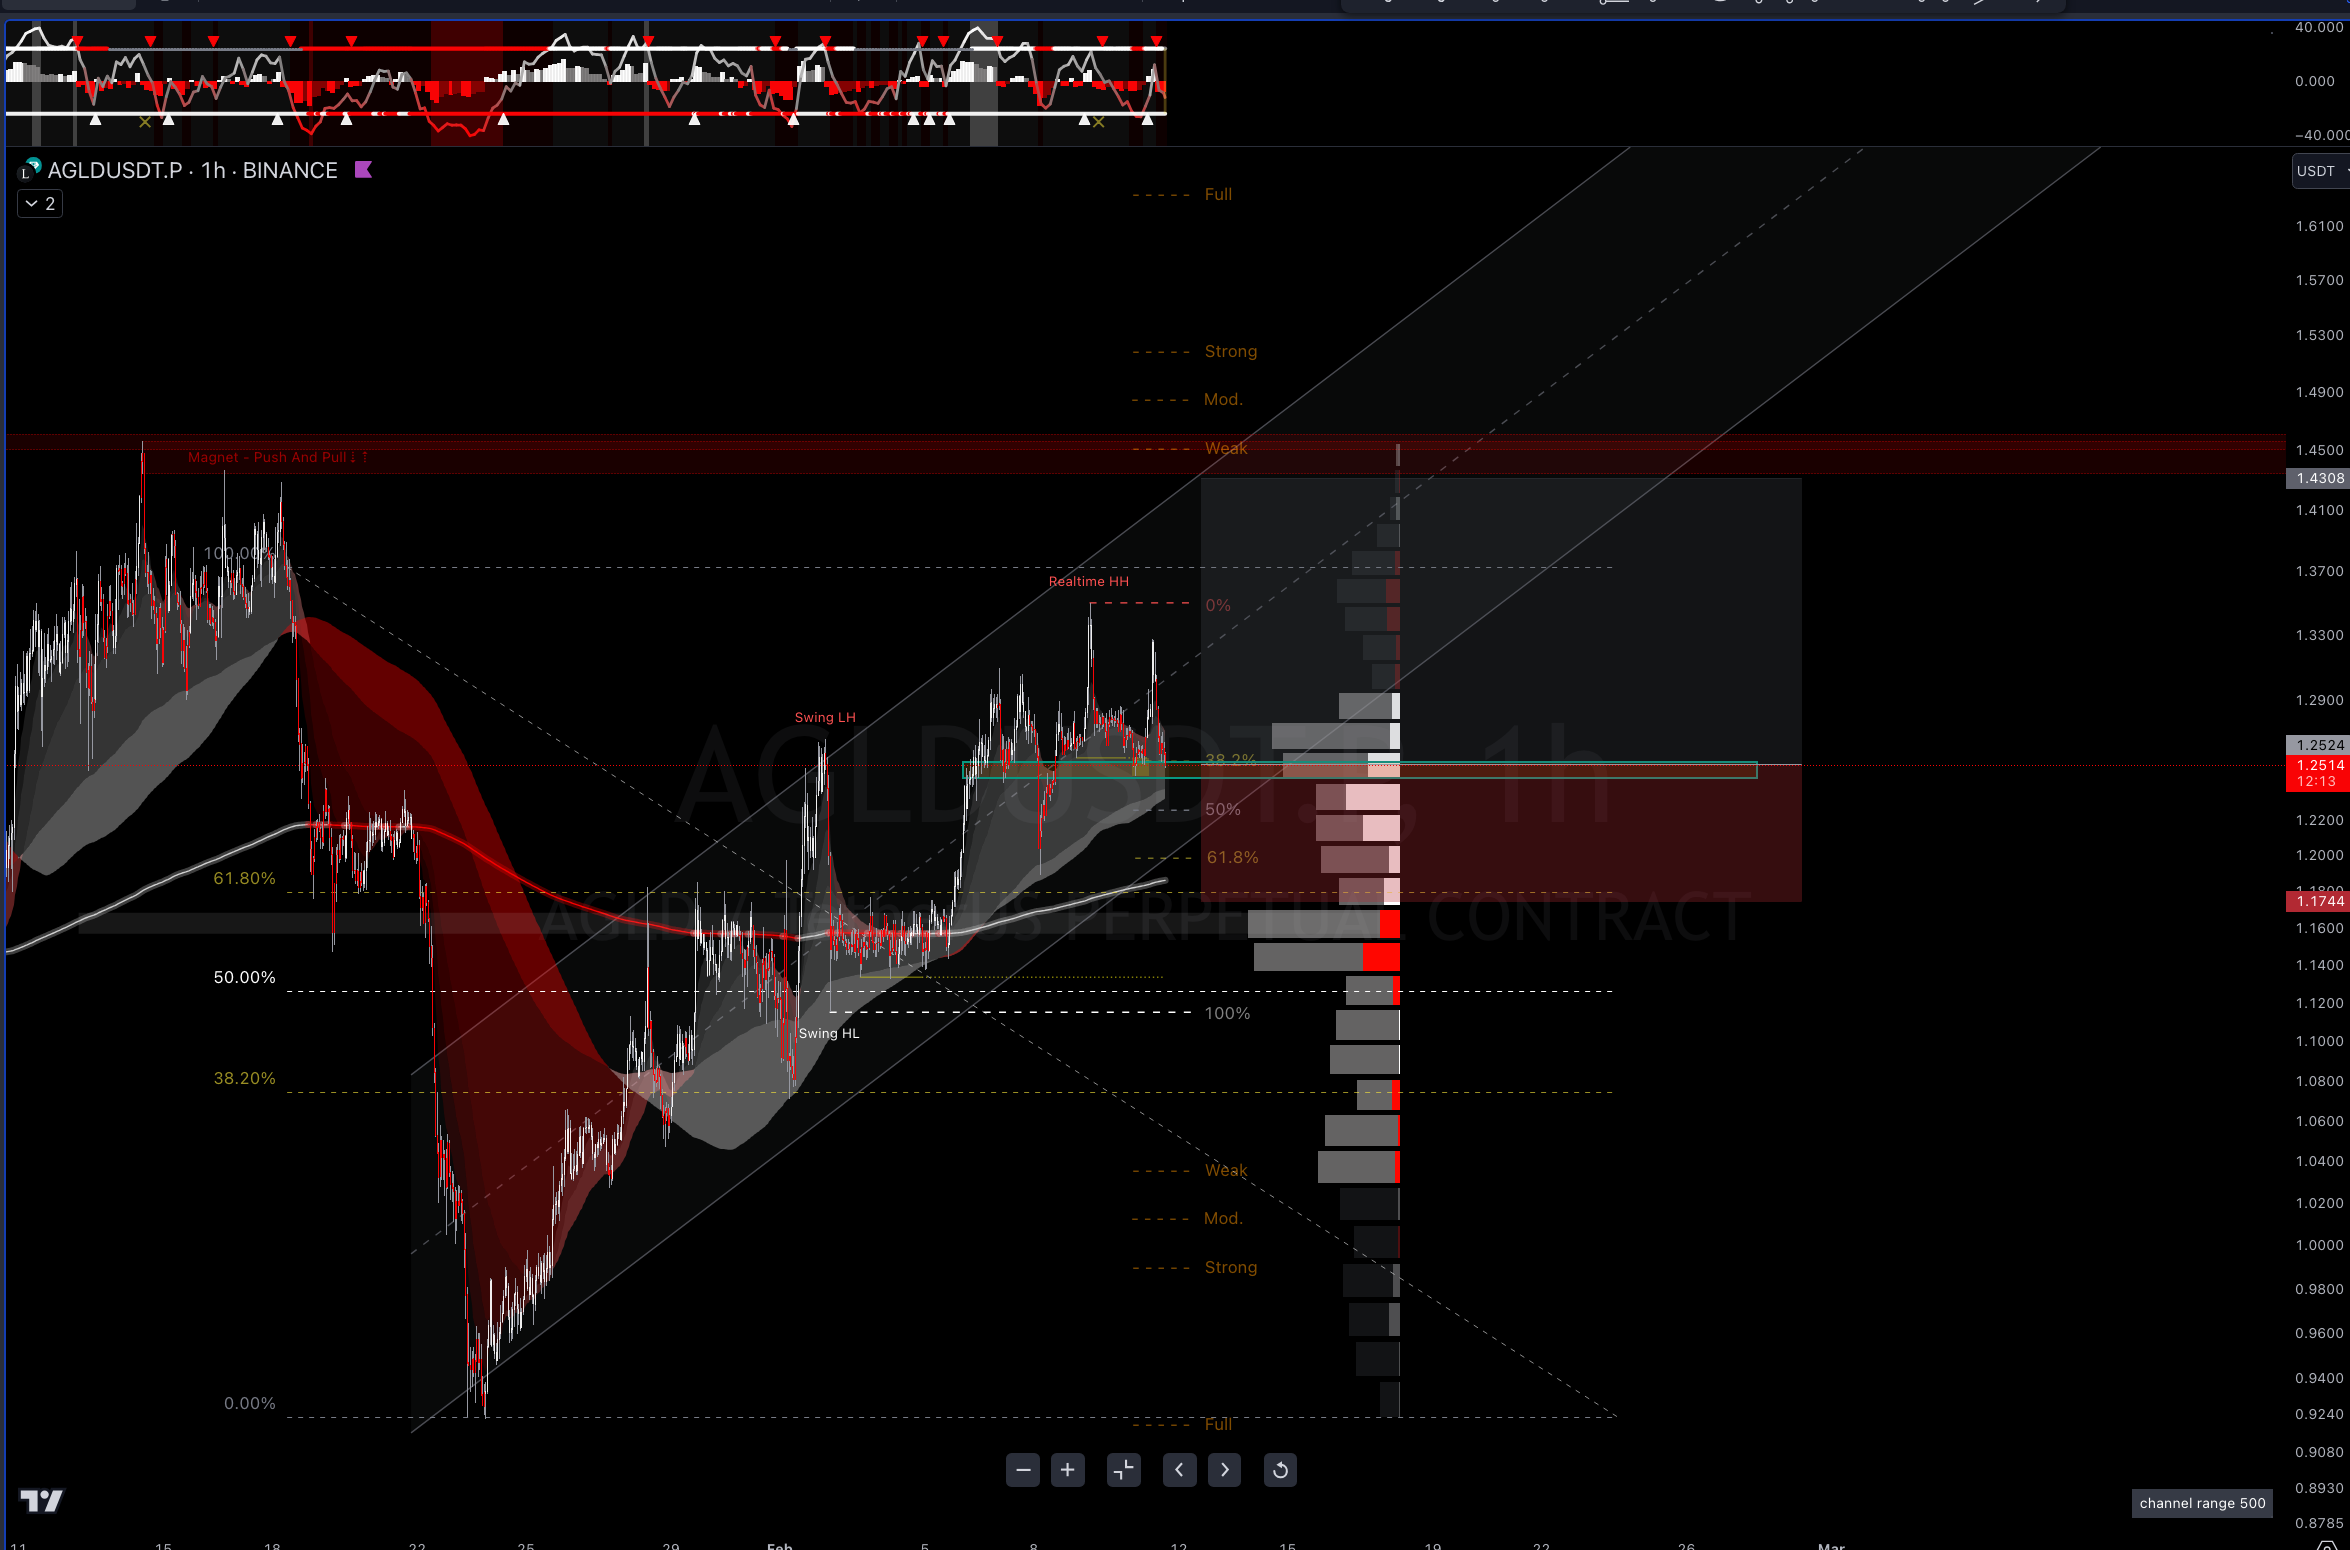
Trade Setup
The following long setup example is from the AGLDUSDT.P 1H chart on February 11th.
It's featuring an RR of 1:2.29, combining confluence of PowerRanger's Swing Fibonacci, manually drawn Fibonacci, Trendline, and SmartCloud's confidence, plus the channel is crossing above the red magnet. This trading plan later hit its TP target.
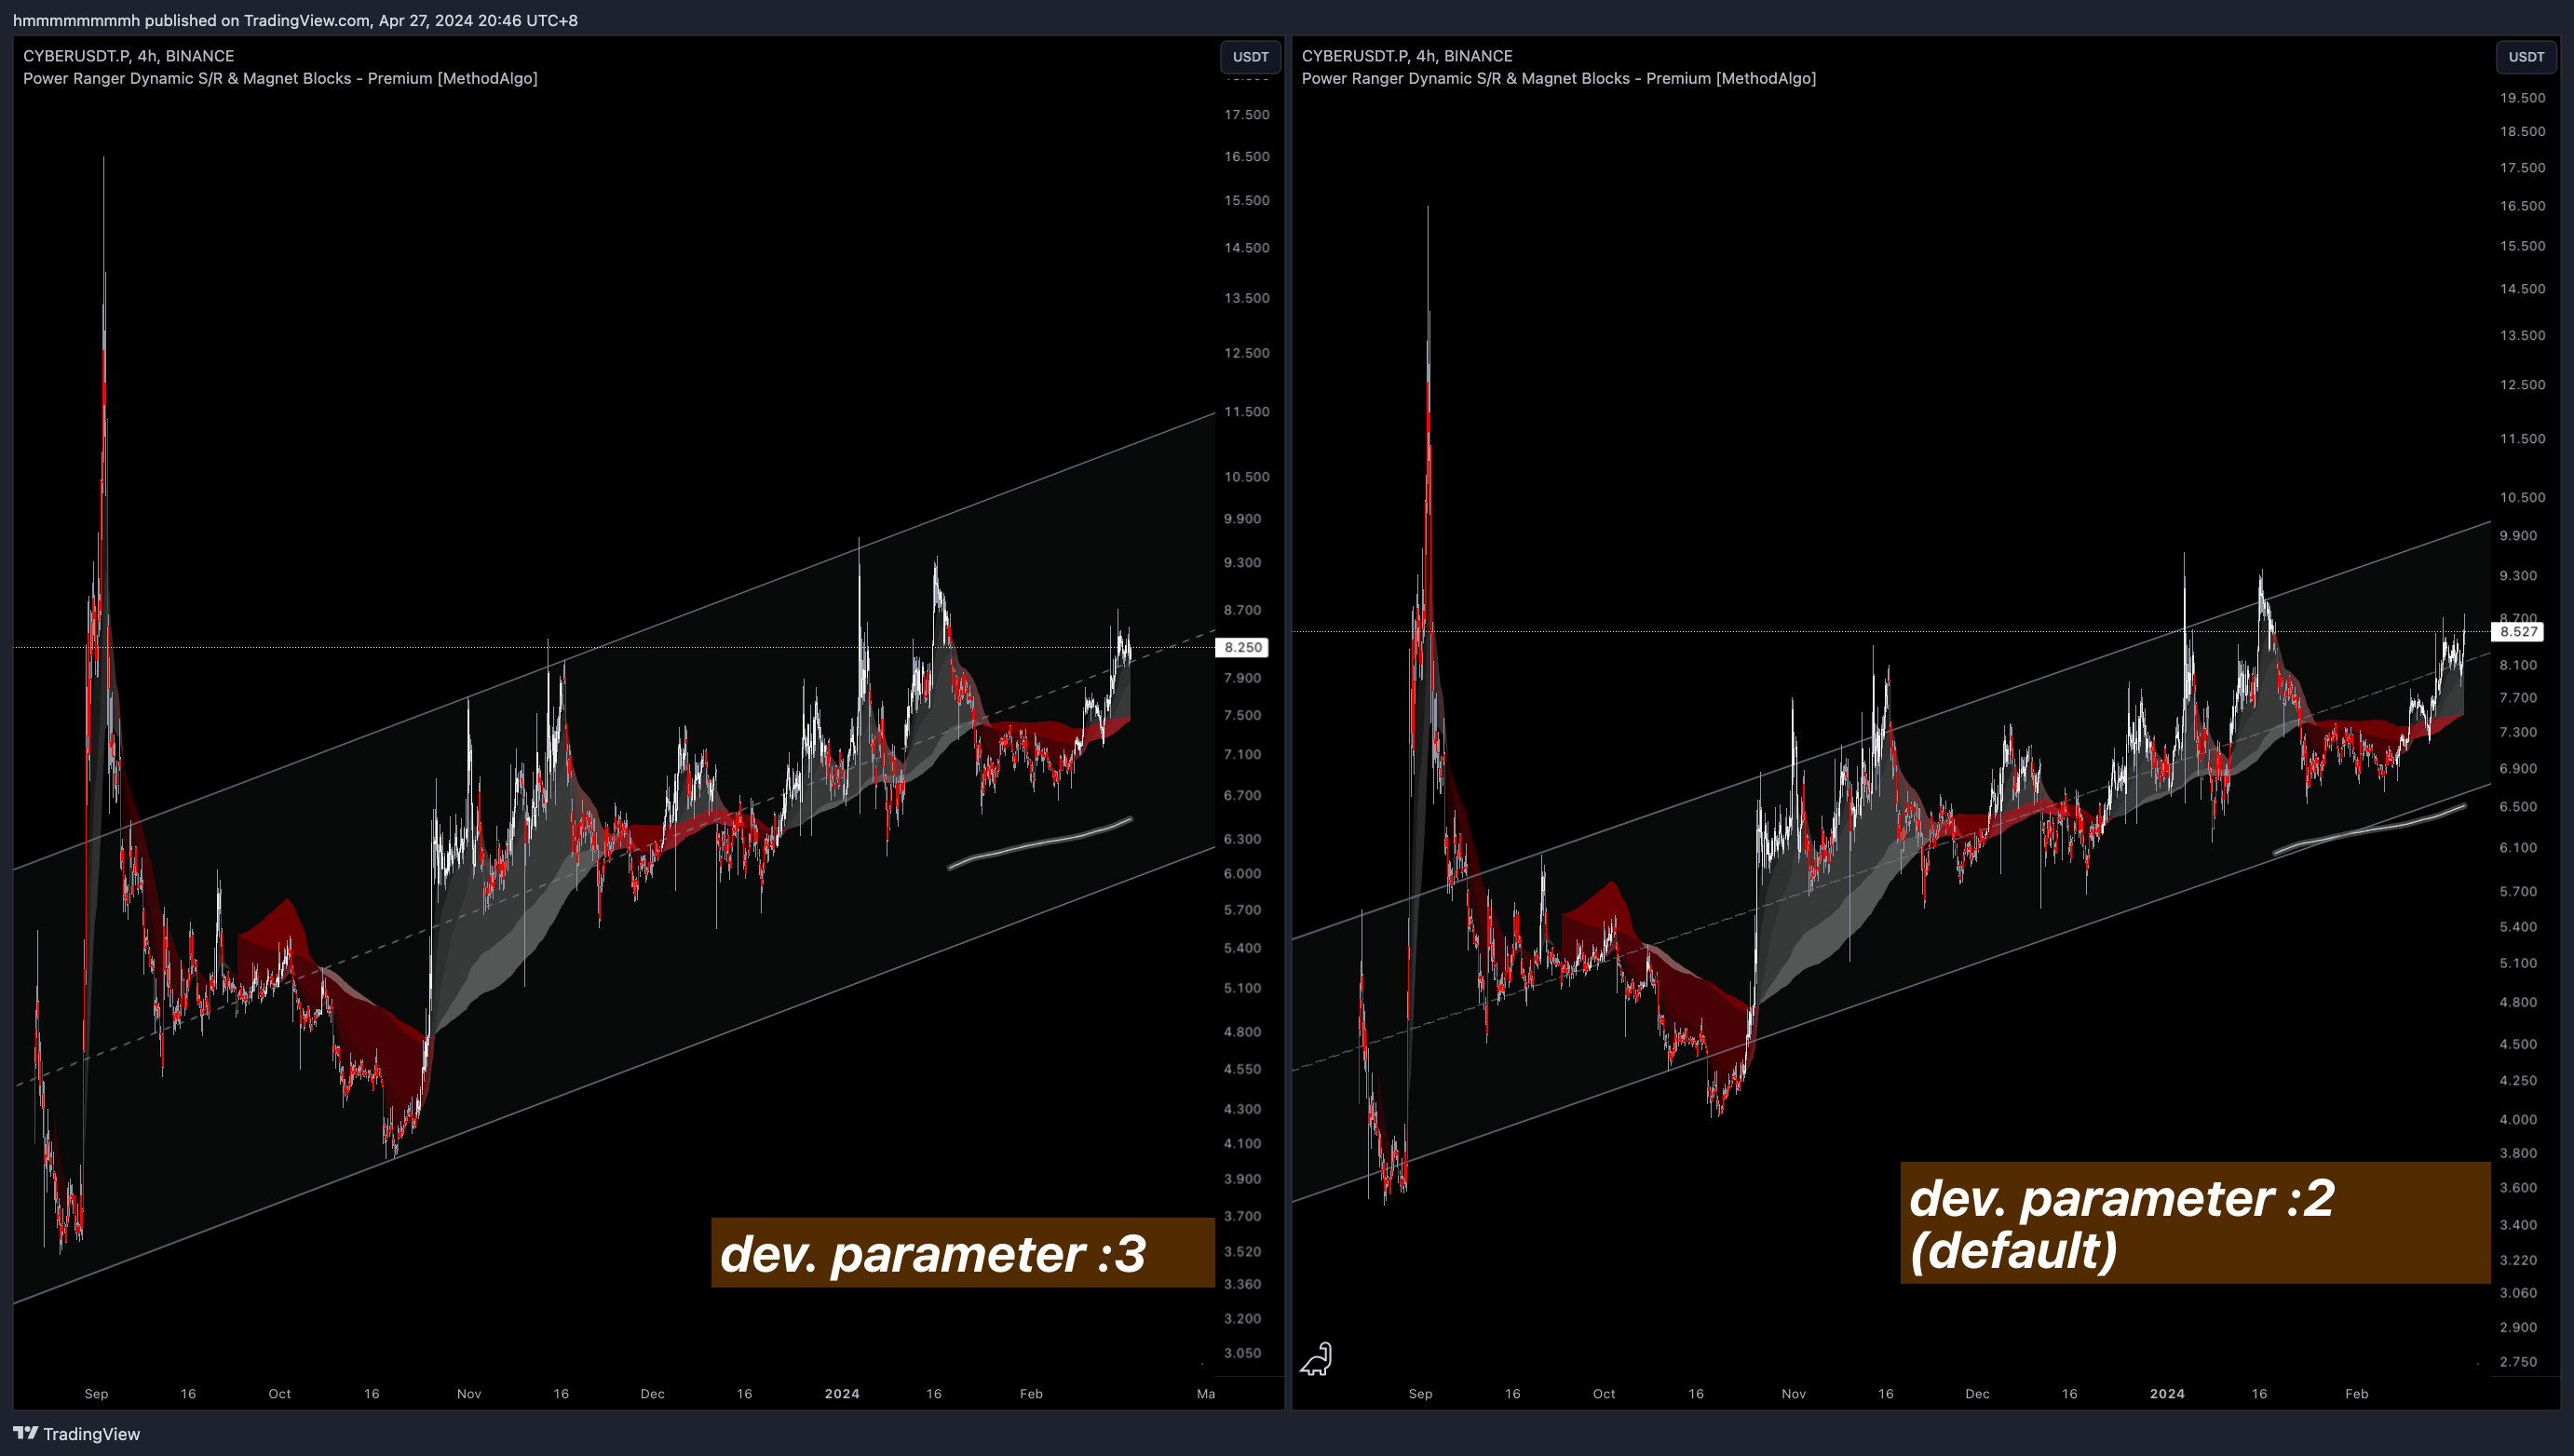
Out-of-Range Deviation
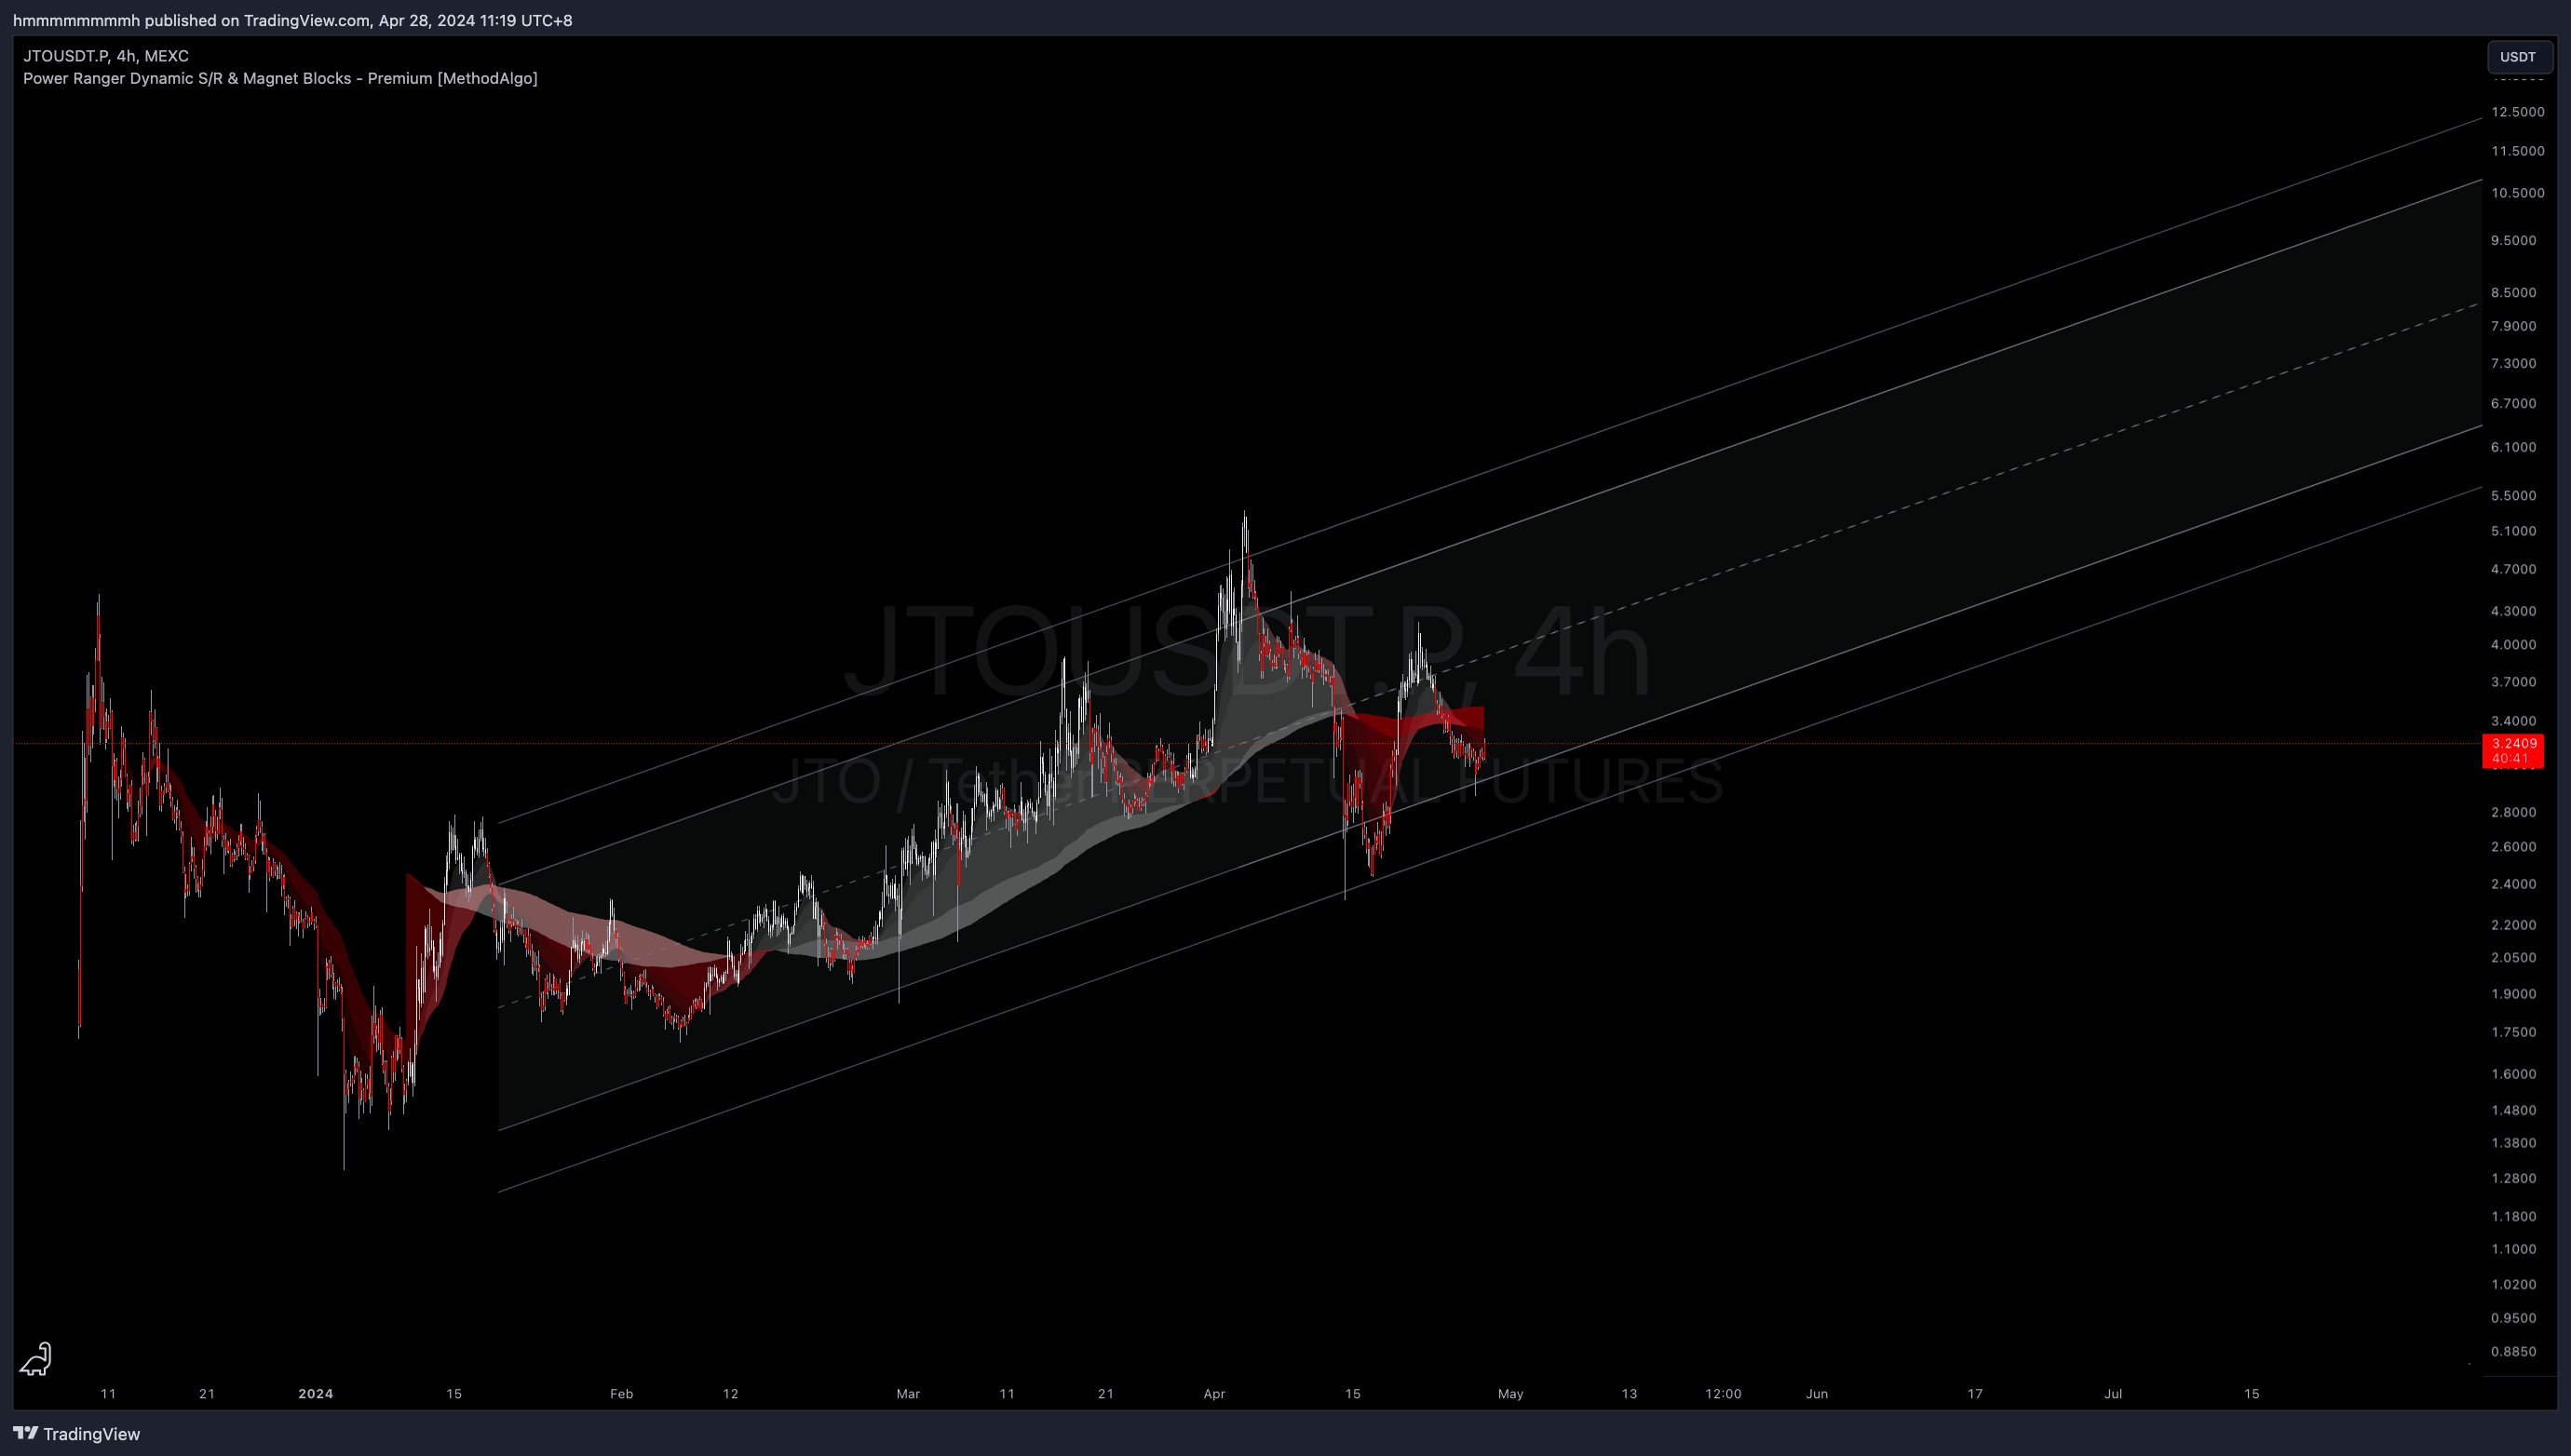
In below example from the CYBERUSDT.P 4H chart, different parameter deviations of the channel are shown. Both charts are 4-hour charts, with the left showing the effect of a custom range multiplier of 3 (3 stddev.), and the right showing the effect of the default parameter 2(2 stddev.). We observe that:
- When set to
3 standard deviations: Prices rarely deviate from the channel range (the time within the channel range statistically accounts for 99.7%). - The channel set to
2 standard deviations on the right: We can find many shorting opportunities due to multiple small probability breakthroughs beyond the deviation range (as explained in the Concept, when set to 2 and the midline is valid, the probability of breaking the channel range by 2 deviations is 5%). These breakthroughs are often false or momentary, rather than indicating an organic upward trend.
The parameters: 2 or 3 or both
The indicator's default parameter is 2 because occurrences like the one with CYBER are relatively rare. With a setting of 2, traders can be cautious by default to not use the upper and lower edges for SL target, and adopt these edge price levels for entry and TP targets, as the probability of touching 2's edges is higher than 3.
You can choose to keep the parameters at 2 and keep the option Max Dev. enabled in the settings. When this option is enabled, pangolin will display both 2 and 3 standard deviations channel, providing the most comprehensive insights.
Validating Mean's Effectiveness
As explained in the Concept, the effectiveness of the channel primarily comes from the midline(Mean) calculated by the algorithm. Currently, the algorithm's built-in 56 sets of parameters, optimized, can find perfect data for the price trend of the chart in most of the time.
Here is a chart of BNBUSDT 4H, where we can verify the effectiveness of this channel by checking if the midline of the Pangolin channel has been accurately respected in the trend history. While checking, it's also an opportunity to verify the support and resistance price levels displayed by other support/resistance tools provided by PowerRanger.
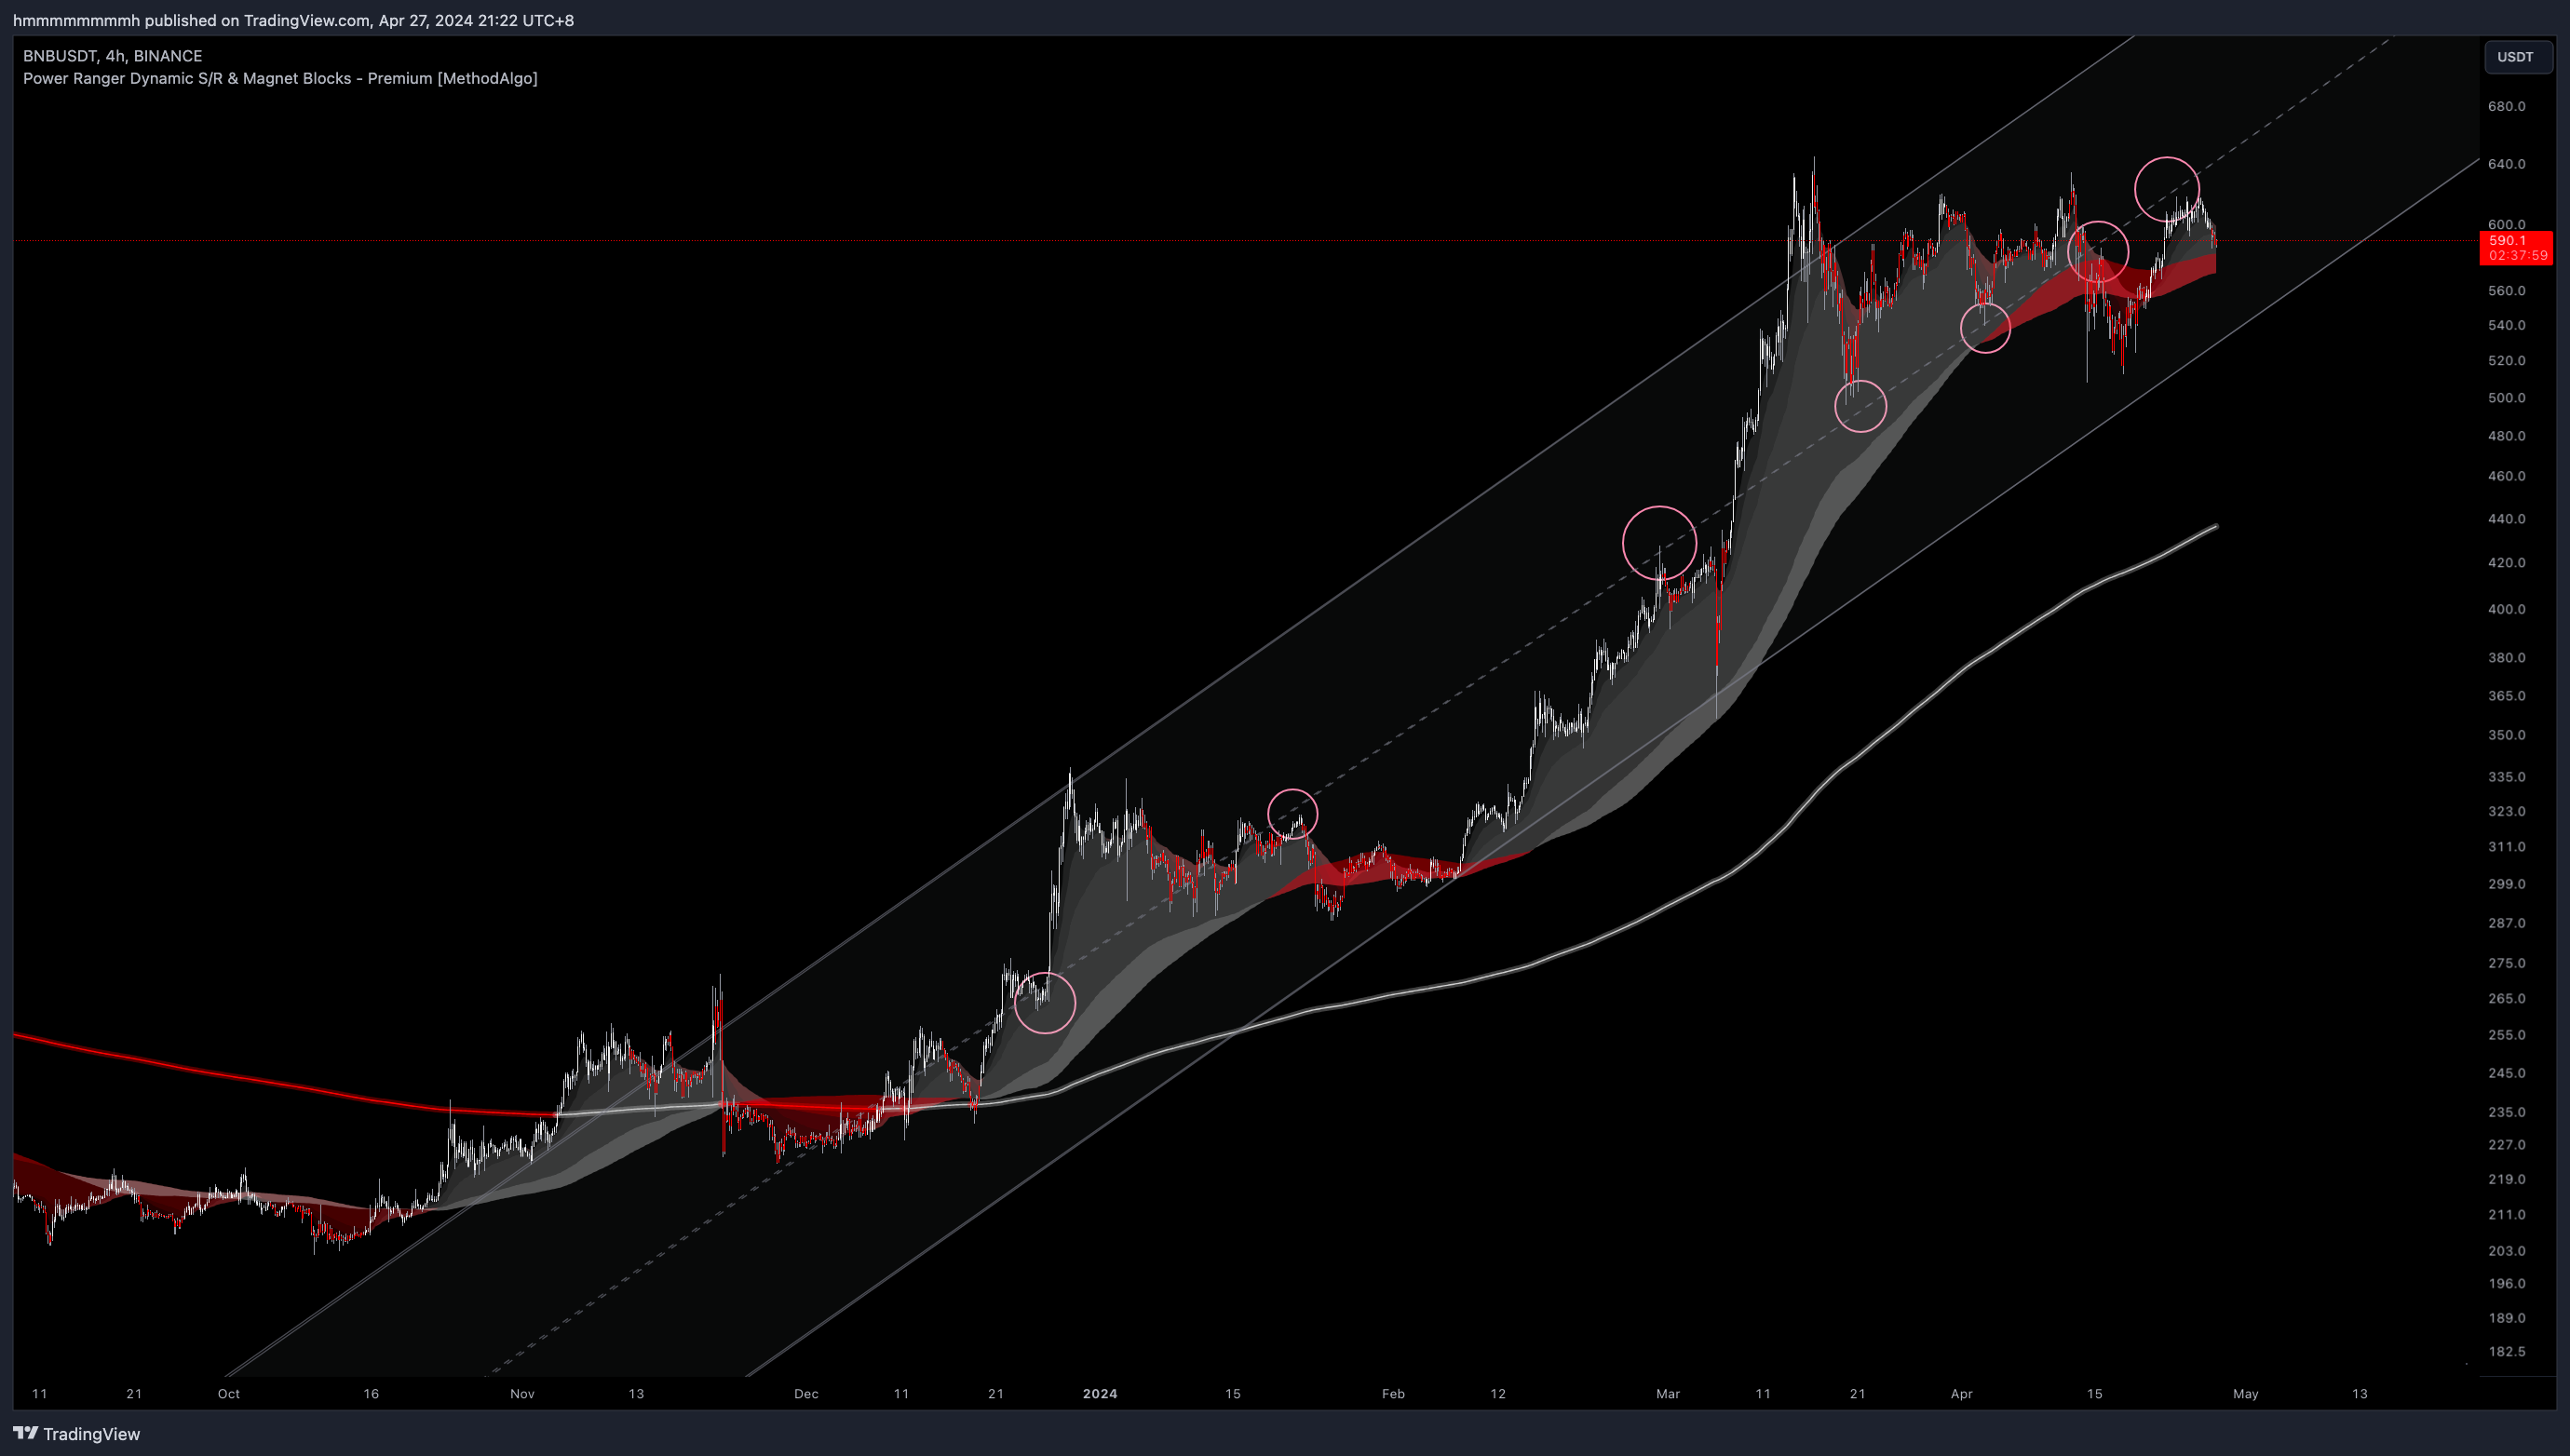
when price spend more than 1% of the time outside from the 3 Stddev range or 6% of the time outside from the 2 stddev range may suggest invalid channel. trend might change or have major slope adjustment from the algorithm.
What to Do When the Channel's Effectiveness Can't Be Verified?
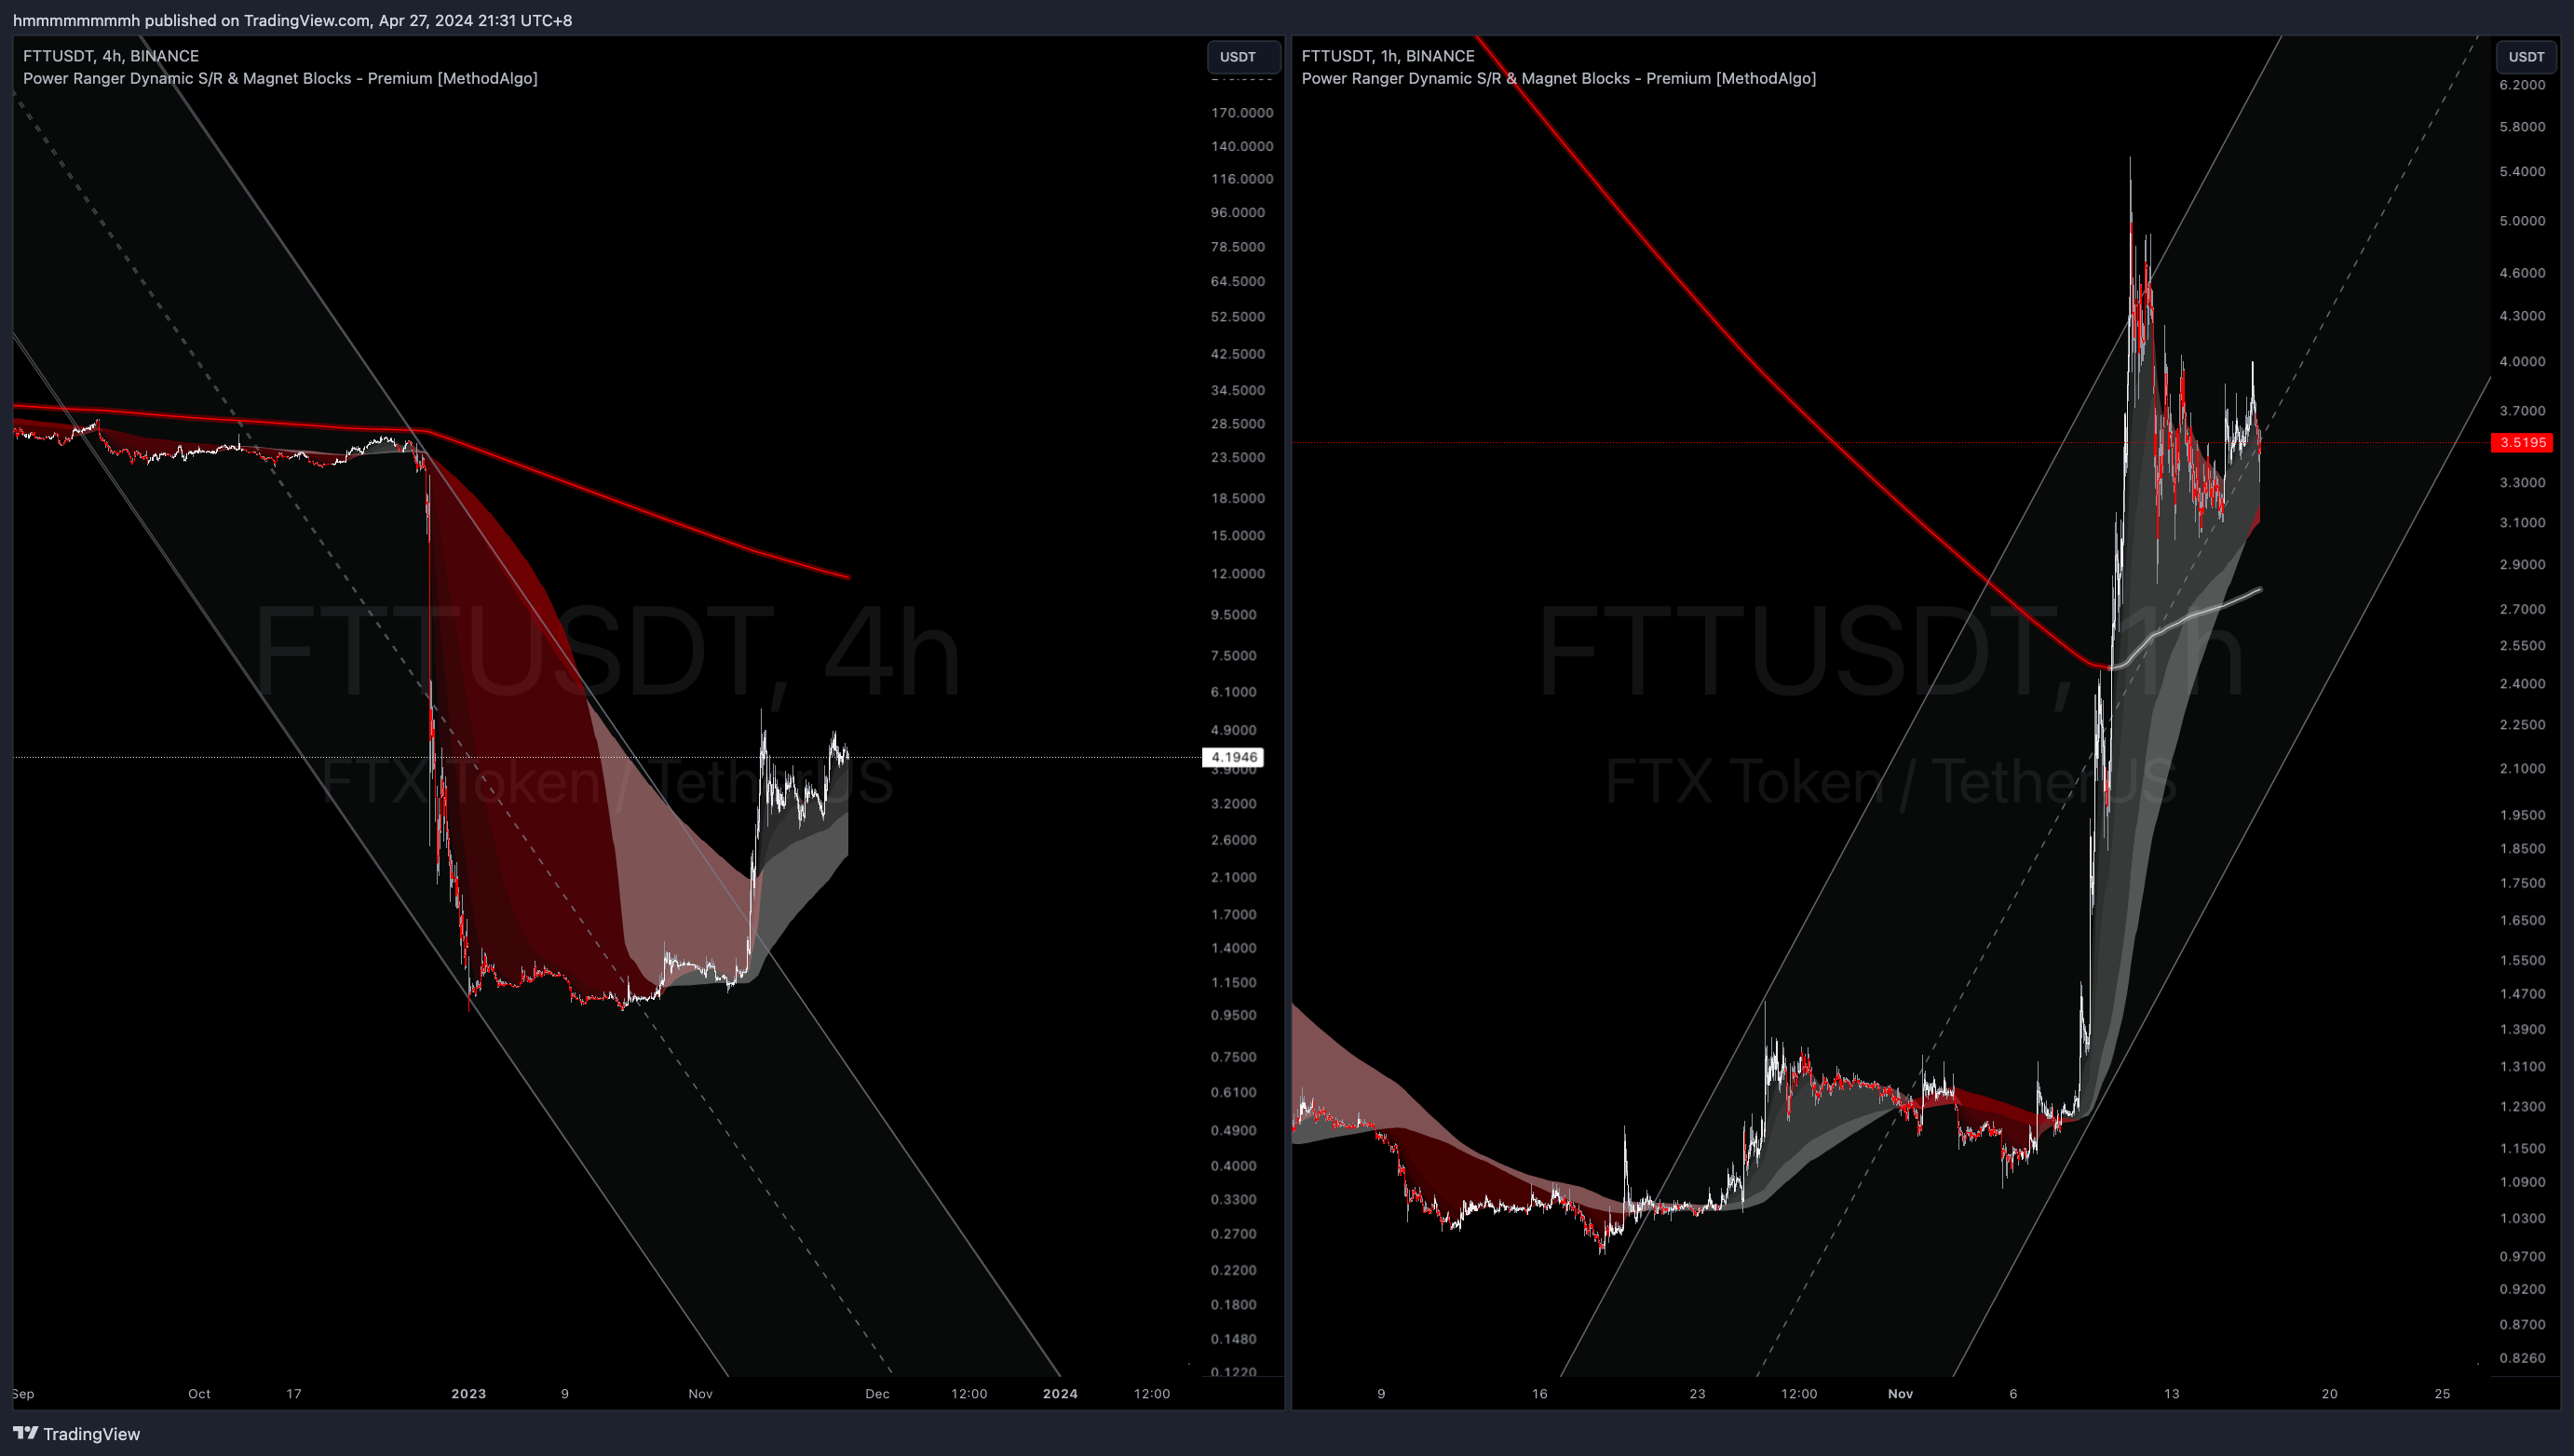
Although rare, it's essential to remember that the indicator analyzes price behavior entirely from a technical perspective and cannot predict sudden news changes. As seen in the example below of the FTT's bankruptcy plummet and the surge from FTT's restart rumor, although unable to predict such abrupt price actions, Pangolin still provides a reliable range for subsequent trends.
For instance, in the left chart's downturn breakthrough, and the peak in the right chart. In cases where the channel cannot be verified through the midline, you can switch timeframes to find a verifiable channel. For example, switching from the 4H chart on the left to the 1H chart on the right, or even further down to 15m.
Parameter Settings
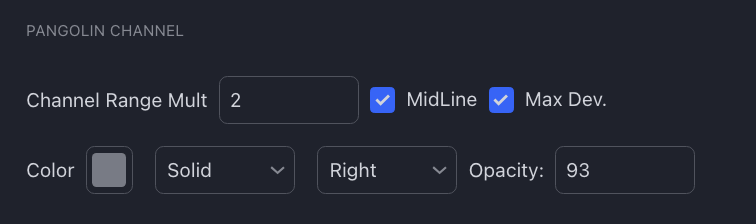
- `Channel Range Mult: Channel range multiplier, default value is 2, which is 2 standard deviations.
- This means the upper and lower channel lines are drawn based on 2 standard deviations from the mean line. It can be finely tuned as needed, but it's unnecessary to exceed 3
Max Dev.: Display channels for '3 standard deviations' alongside custom standard deviation parameter channels.Midline: Option to disable displaying the midline of the channel. You can disable it for a cleaner chart.Color & Opacity: Color, style, and transparency of the channel.
Note
- It's recommended to use TradingView's Replay function to observe how the channel adjusts itself during trend transitions and to understand the channel's latency during trend changes. For example, when transitioning from an ascending channel to a descending one, the strongest trend calculated at that time is still the longest-lasting ascending channel. Even though our algorithm has weighted relevance to recent trends, until it completely transitions to a strong downward trend, the algorithm still considers the strongest channel to be the ascending one (even though the price has deviated from this ascending channel but has not yet transitioned to a downward channel).
- The upper and lower edges of the channel are not suitable for placing stop losses but are suitable for taking profit and entering positions because, as explained in the Concept, the edges of the channel are not designed based on support and resistance. Pangolin is an L2 leading indicator, not a passive indicator that reflects facts like VolumeProfile. However, the midline can be considered as support, resistance, or point of control (POC) because it's the midpoint of oscillating fluctuations, which often acts as support and resistance multiple times.
- If the channel is not displayed, simply drag the chart to the right, as the channel is calculated based on the last candle pushed backward. If the first candle of the channel's start is not loaded on the chart, the channel will not be displayed.
- If you notice that the channel lines are not parallel, it means you haven't turned on Logarithmic mode for the chart.
The engineers at MethodAlgo are proud of their work, but it's essential for you to understand that no indicator / algorithm can guarantee perfect success. Trading profits and losses are greatly influenced by the trader's psychology, knowledge, experience, and risk management.
The algorithmic interfaces we provide are all part of T.A.T.A. When trading in reality, traders should make their decision like T.A.T.A, considering various factors and signals from other tools to establish confluence system.