RSH & ColorBars
Concept
The RSH (Relative Strength Histogram) is an effective trend momentum tool that translates the RSI from higher timeframes into a layer-2 indicator, addressing the low success rate and high false positive of simple RSI strategies. By observing the length and color of the histogram bars, traders can intuitively understand strength changes in buy/sell cycles, identify shifts in trend momentum, and detect early reversal signals, providing opportunities for early market entries and exits.
Data Frame
For optimal results, it's recommended to keep the AutoPilot feature enabled. This feature automatically adjusts the data Timeframe based on the current chart's Timeframe, or sets it to three times or more of the current Timeframe.
Candle Color
By default, the ColorBar is Enabled and the indicator changes the chart's candle color to match the RSH color. you can disable in Setting. We offer four different styles of algorithms to suit various trading strategies, as detailed below.
You Can Use It To
- Analyze bullish and bearish momentum
- Implement short-term small trend strategies
- Provide reversal risk warnings
Interface
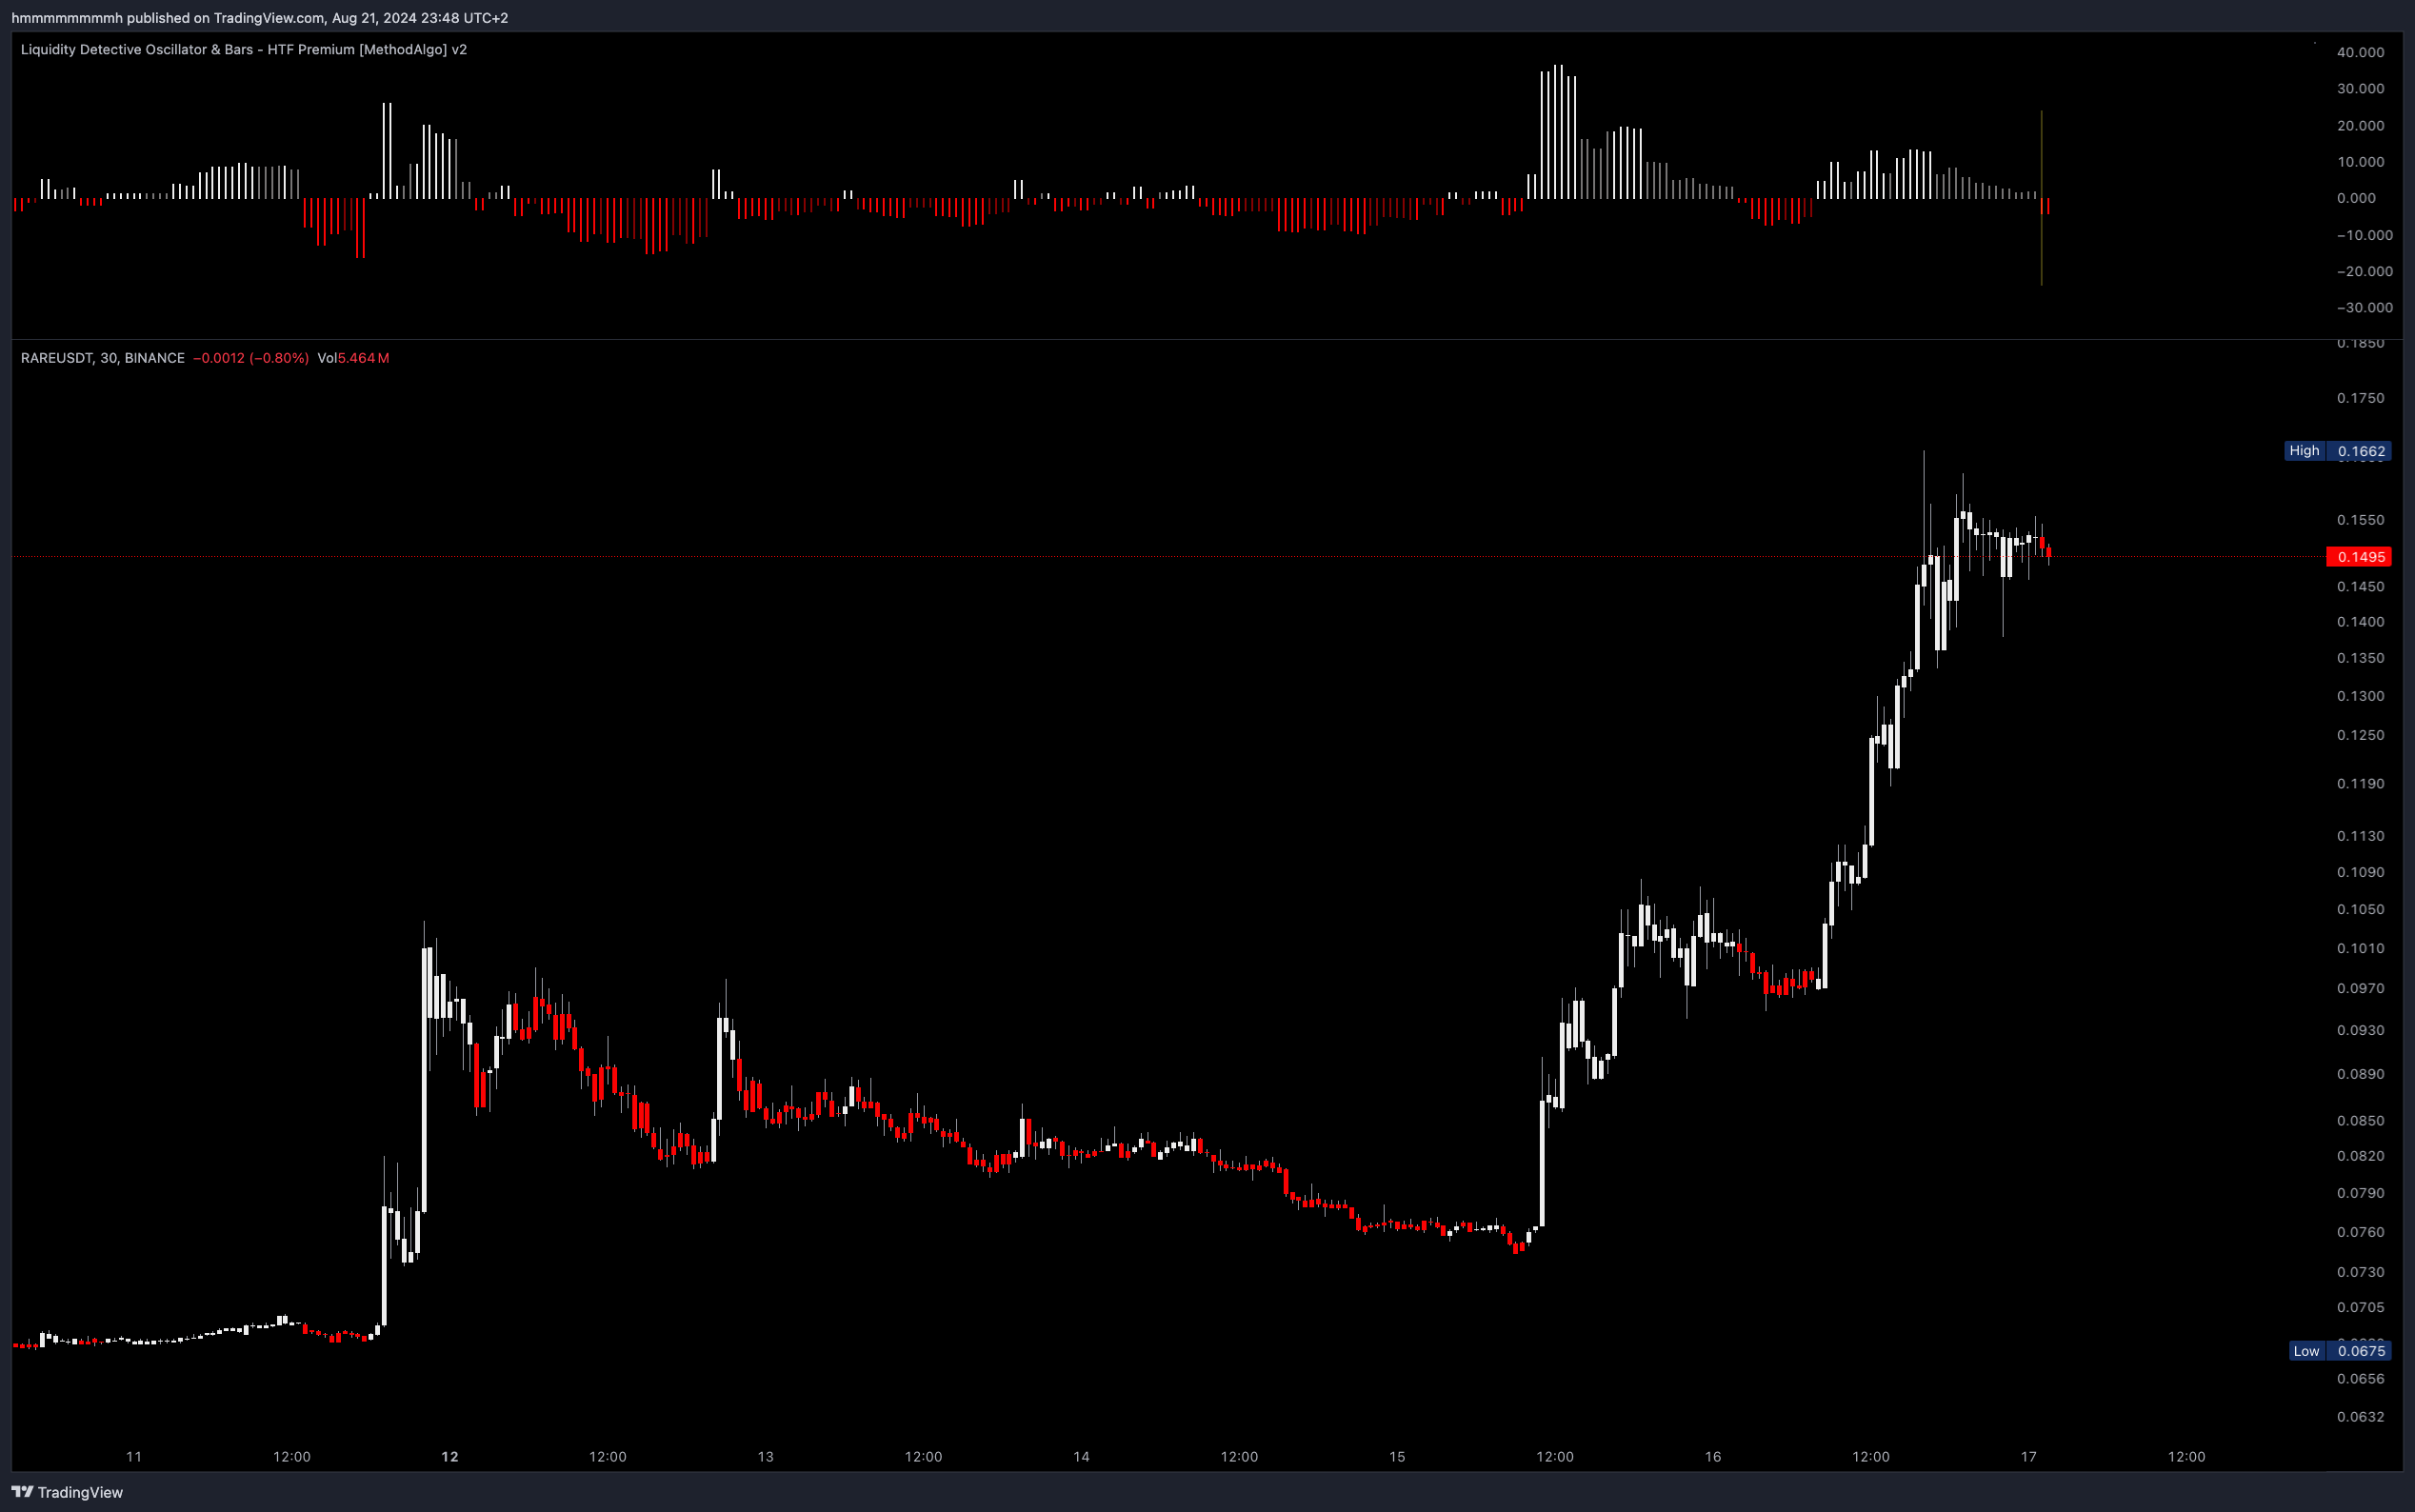
RSH Histogram Bar Length (Dominant Force)
- The longer the bar, the stronger the trend; conversely, the shorter the bar, the weaker the trend.
- Gradually lengthening bars indicate growing momentum; gradually shortening bars indicate waning momentum.
RSH Histogram Color (Dominant Strength)
- White represents bullish momentum, Red represents bearish momentum.
- Bright colors indicate impulsive momentum with rapid price movements.
- Dark colors represent consolidative momentum, with slow price fluctuations, usually following an impulsive move or in pullback.
Candle Color
- White is bullish, Red is bearish .
- Trend (default): The candle is white when RSH is white, and red when RSH is red.
- BuyBias: The candle is red only when RSH is Bright Red, otherwise white, filtering out fluctuations in an uptrend.
- SellBias: The candle is white only when RSH is Bright White, otherwise red, filtering out fluctuations in a downtrend.
- Scalping: Candles are the opposite color when RSH is dark; this is suitable only for ultra-short-term scalping strategies tracking just a few candles.
- RSI: Based on RSI data, the candle is white when RSI above 50, and red when below.
Data TimeFrame
By default, the AutoPilot automatically selects the appropriate RSH data Timeframe based on the current chart's Timeframe. Traders can also disable AutoPilot in the Parameter Settings and manually select a data timeframe. The following examples illustrate the impact of different data Timeframes on signal generation.
Data Timeframe used when Autopilot TF is ON
| Chart | Data Timeframe |
|---|---|
| 1m | 10m |
| 3m | 15m |
| 5m | 30m |
| 10m | 45m |
| 15m | 1h |
| 30m | 2h |
| 45m | 4h |
| 1h | 4h |
| 2h | 8h |
| 3h | 1d |
| 4h | 1d |
| 6h | 12h |
| 12h | 1d |
| 1d | 3d |
Examples
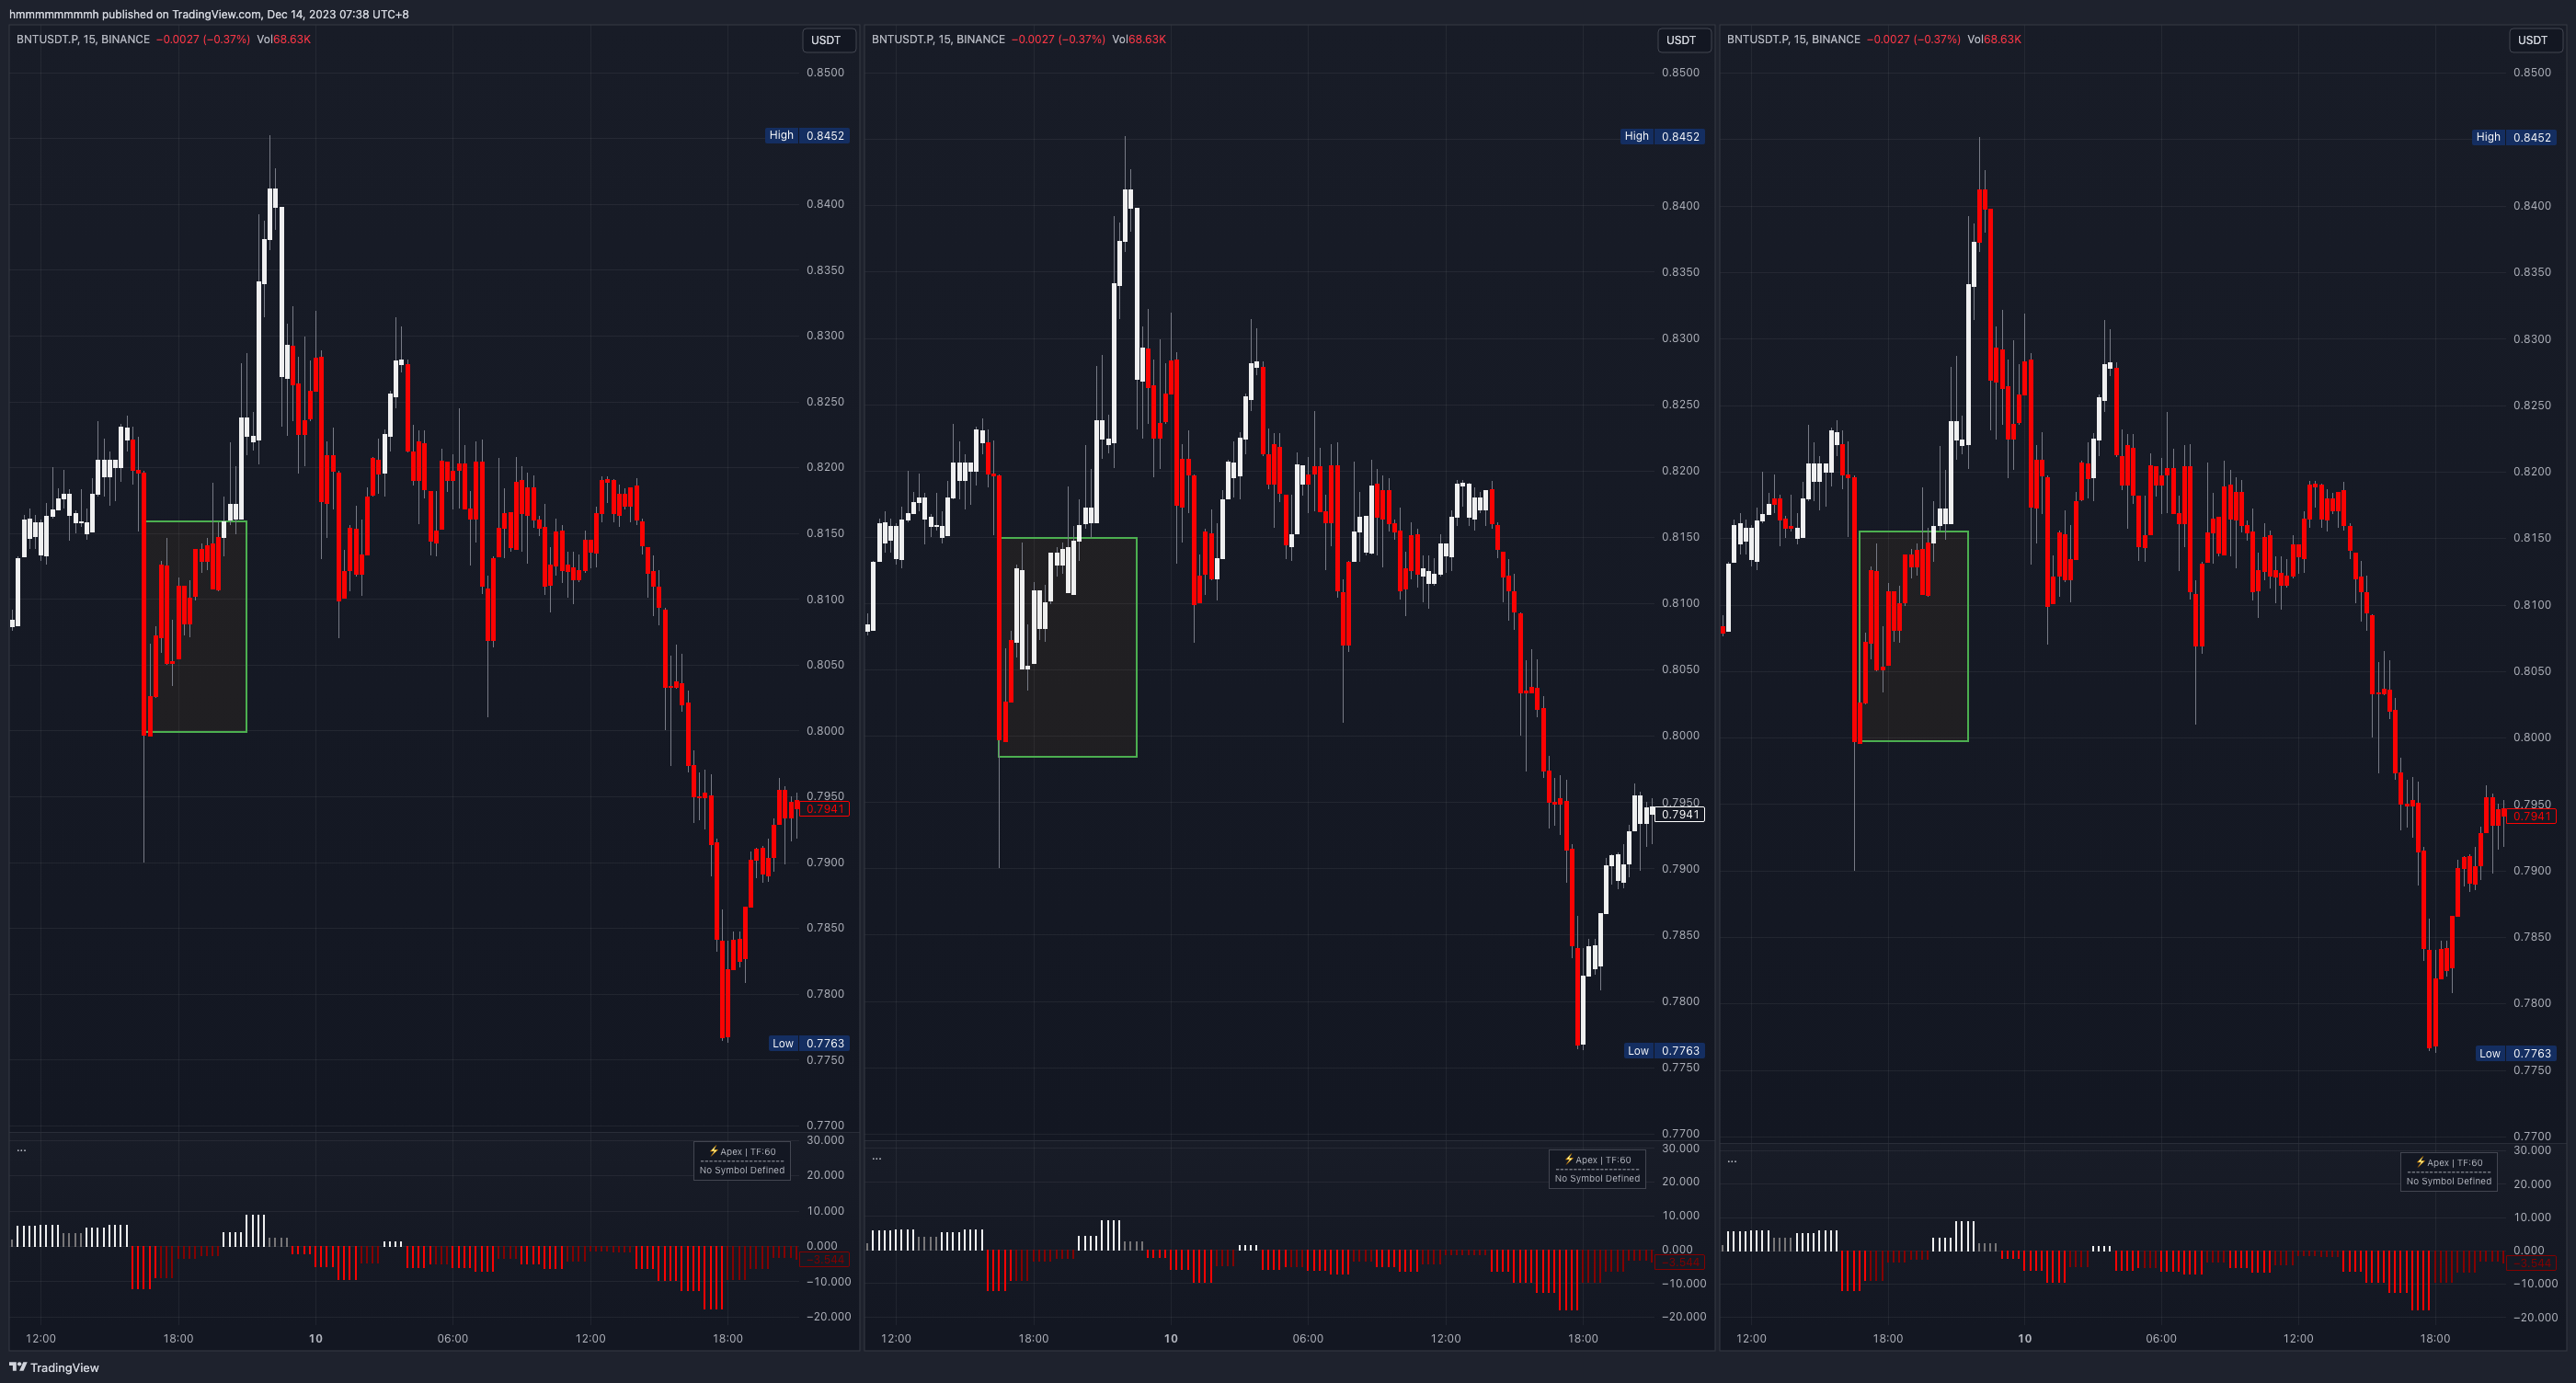
The chart below shows the difference in entry signals with different data Timeframes:
- Left (3H data): Uptrend signal at 8:15
- Middle (1H data): Uptrend signal at 3:45
- Right (45m data): Uptrend signal at 2:00
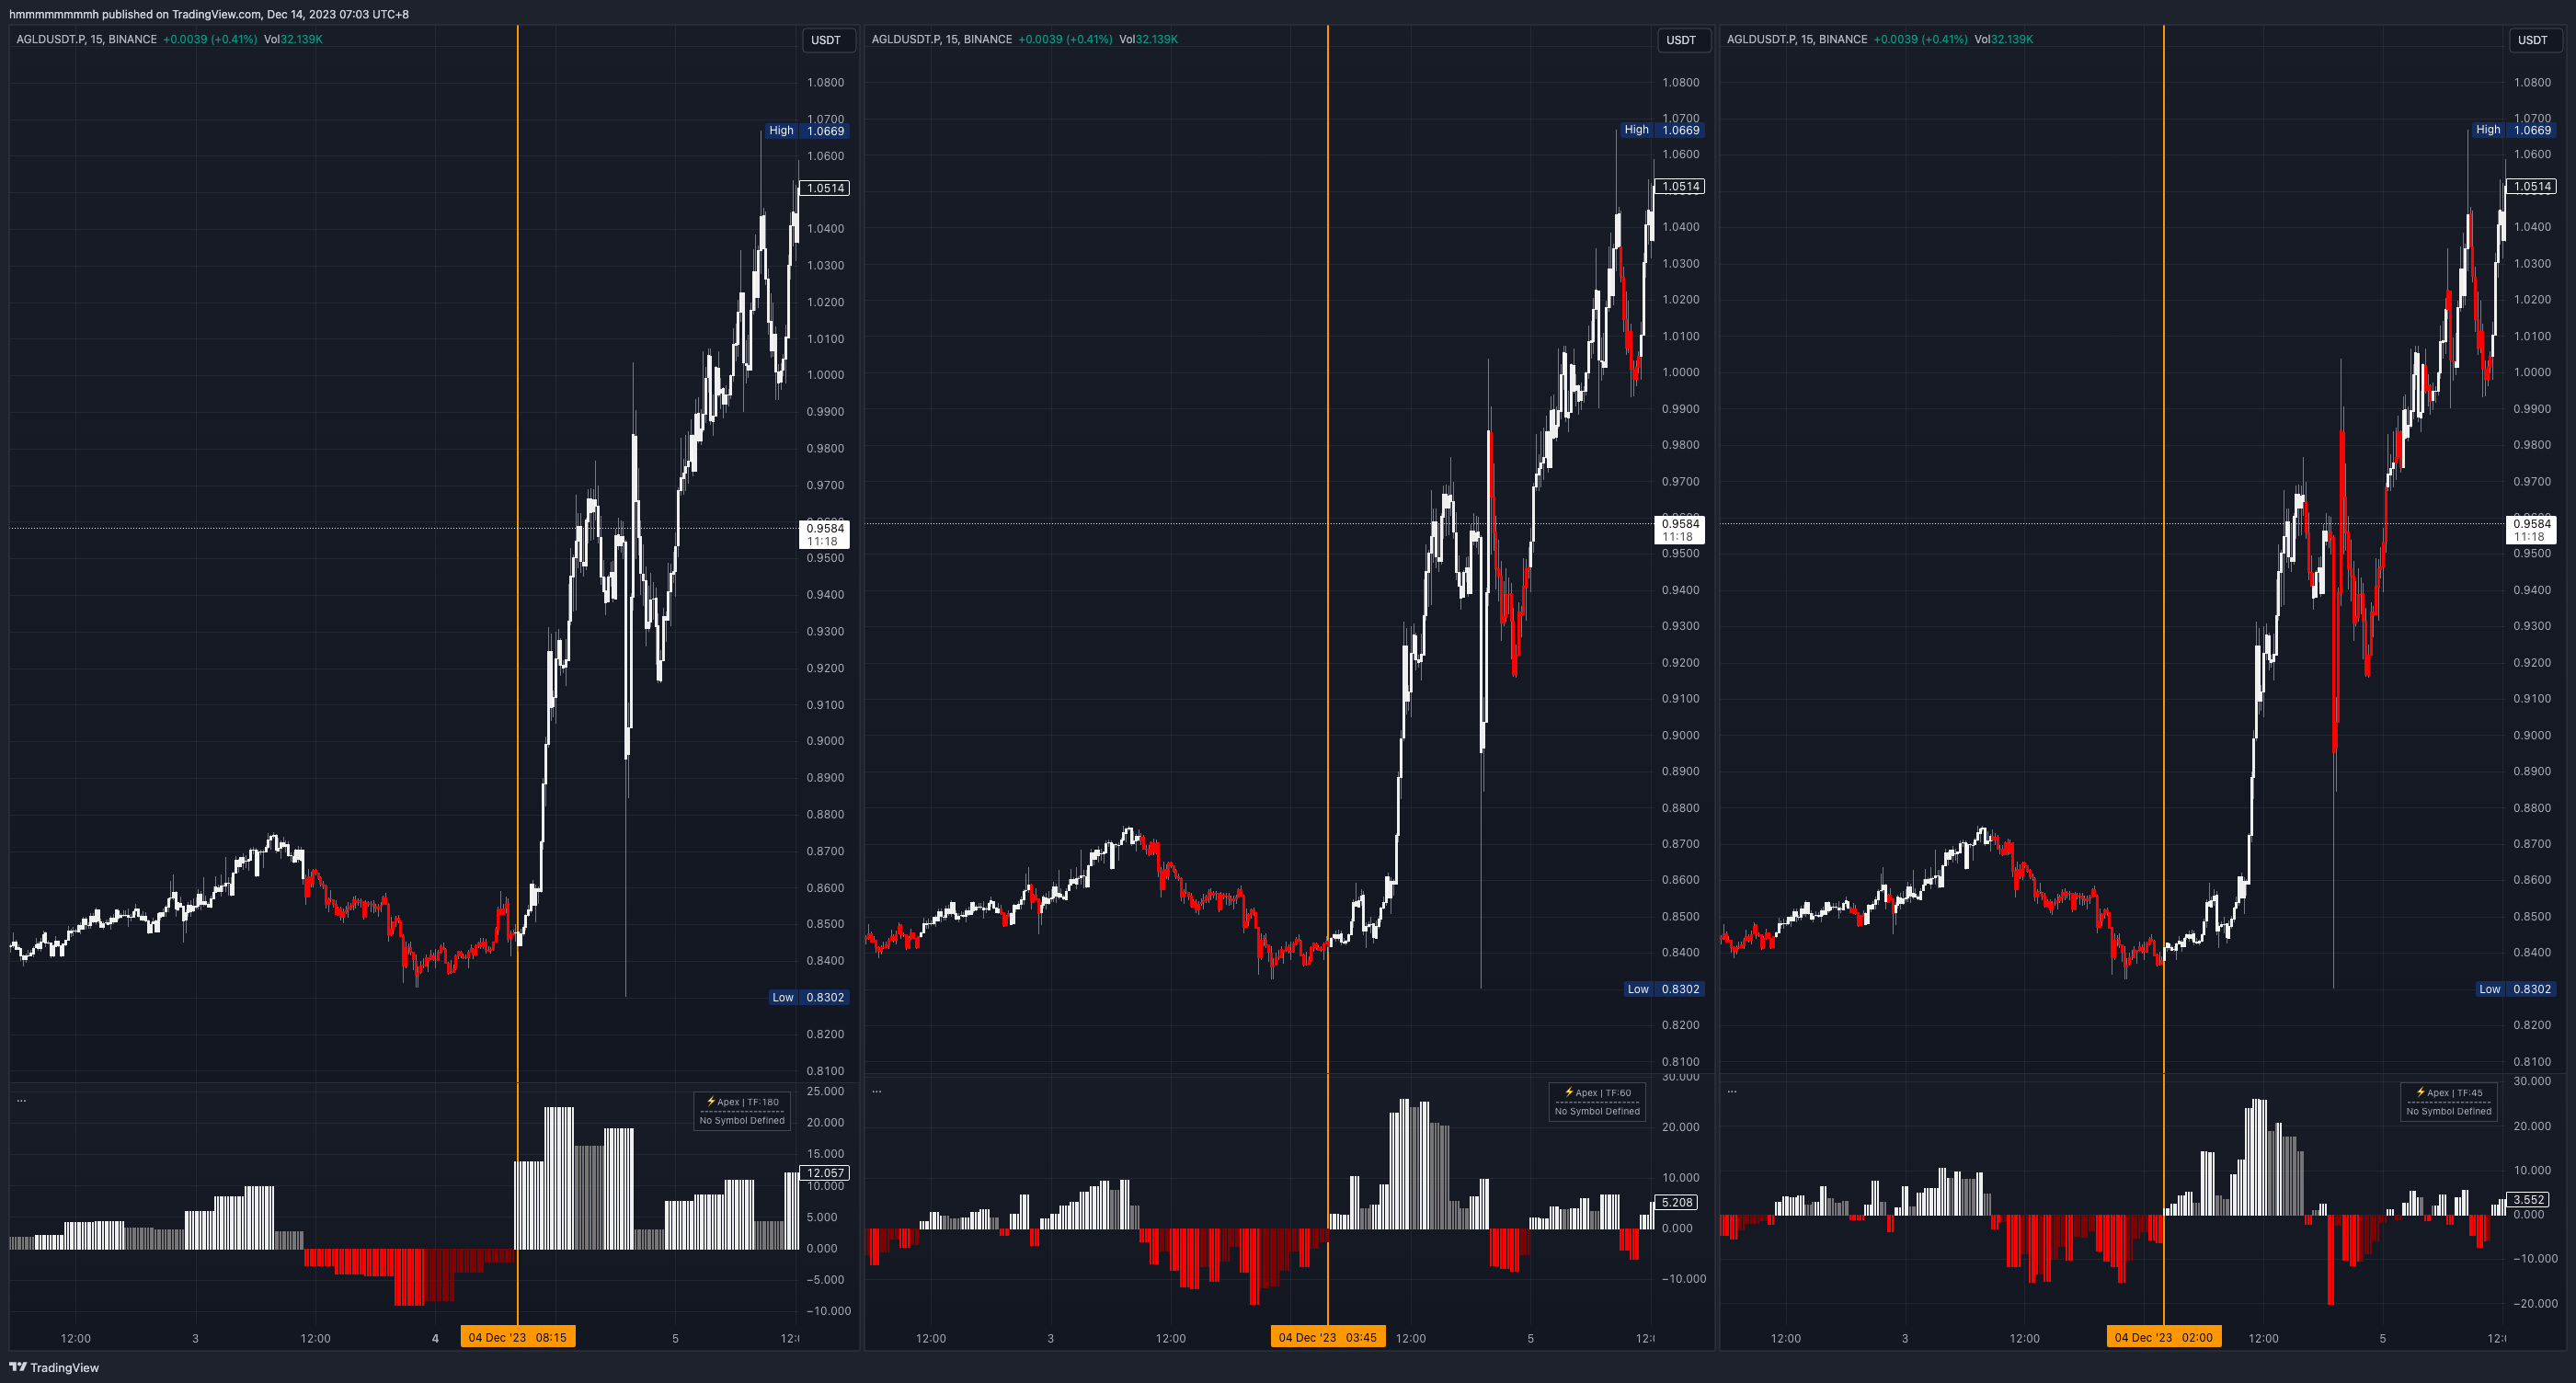 Chart:
 AGLDUSDT; Time Frame: 15m; RSH Data Frame: Left 3H, Middle 1H, Right 45m (AutoPilot); Candle Color: Trend mode
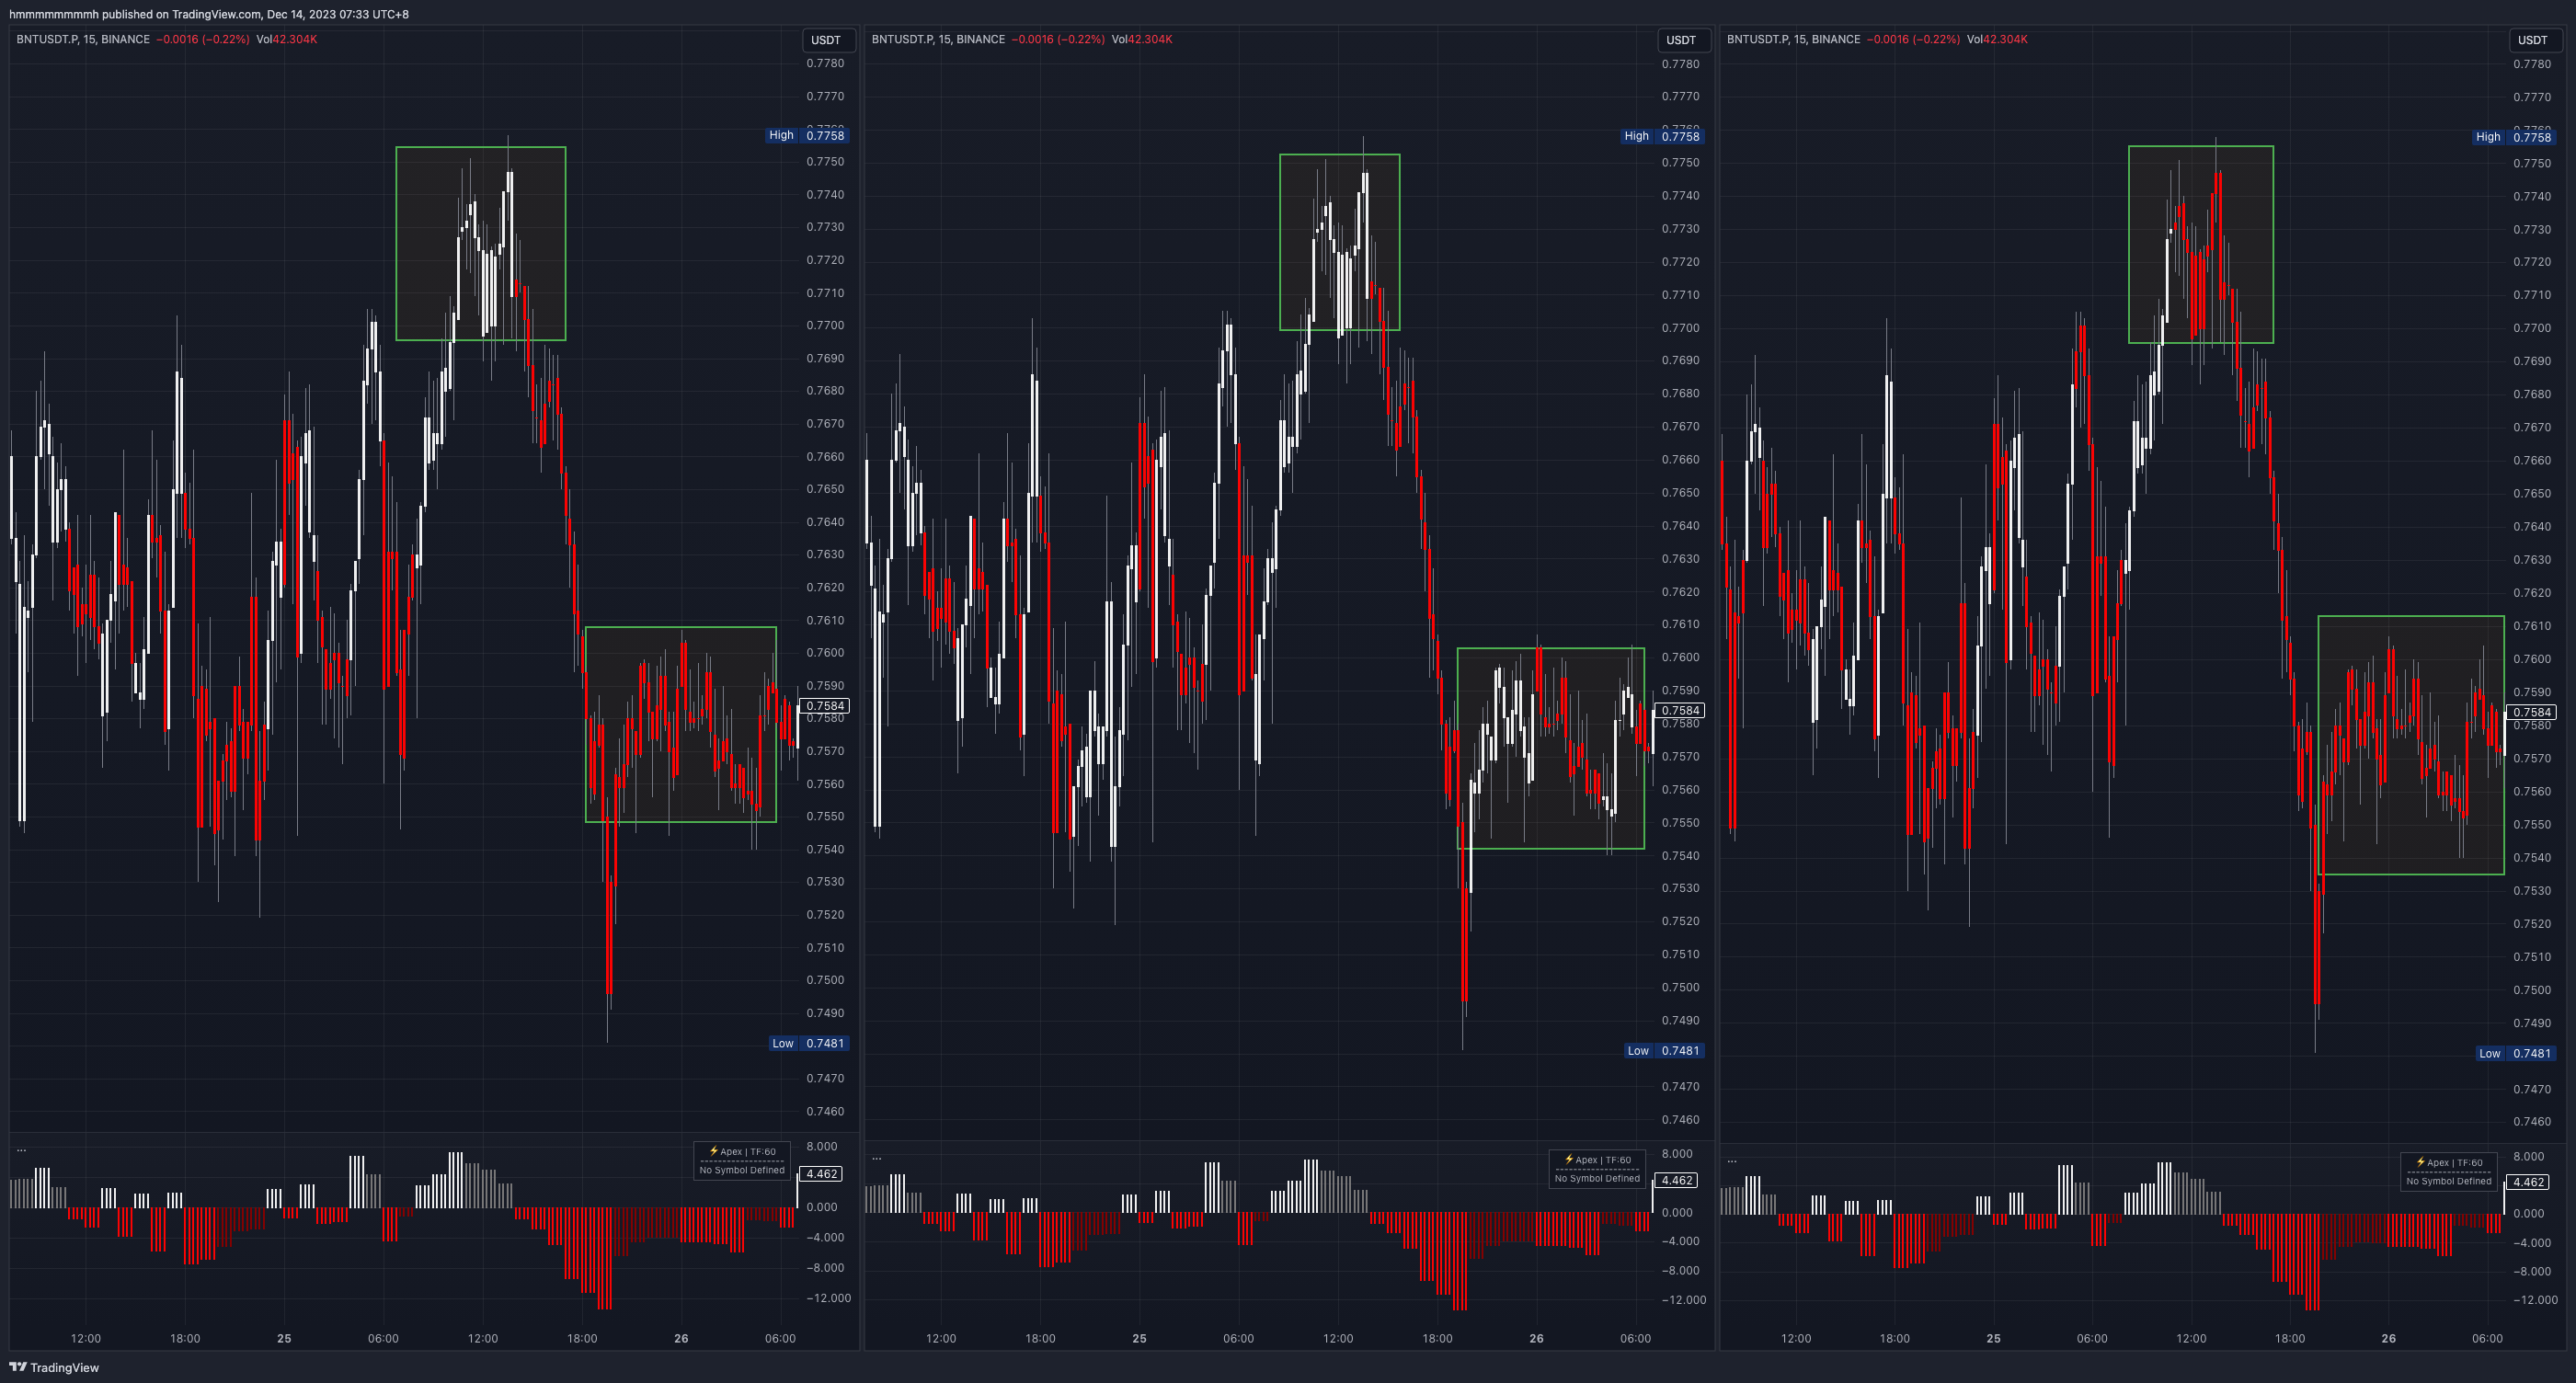
The following example shows the differences in signals during climbing, topping, and consolidating stages with different data Timeframes:
- Yellow Box: Climbing and Consolidation Area
- The smaller the data time Timeframe used, the greater the RSH fluctuation and sensitivity, providing more precise entry and exit detection.
- The larger the data time Timeframe used, the better the filtering of small fluctuations, allowing for a longer stay in the trend.
- Green Box: Topping Area
- The 3H data frame is more delayed but more confirmed.
- The 1H and 45m data frames provide earlier top-out color change signals.
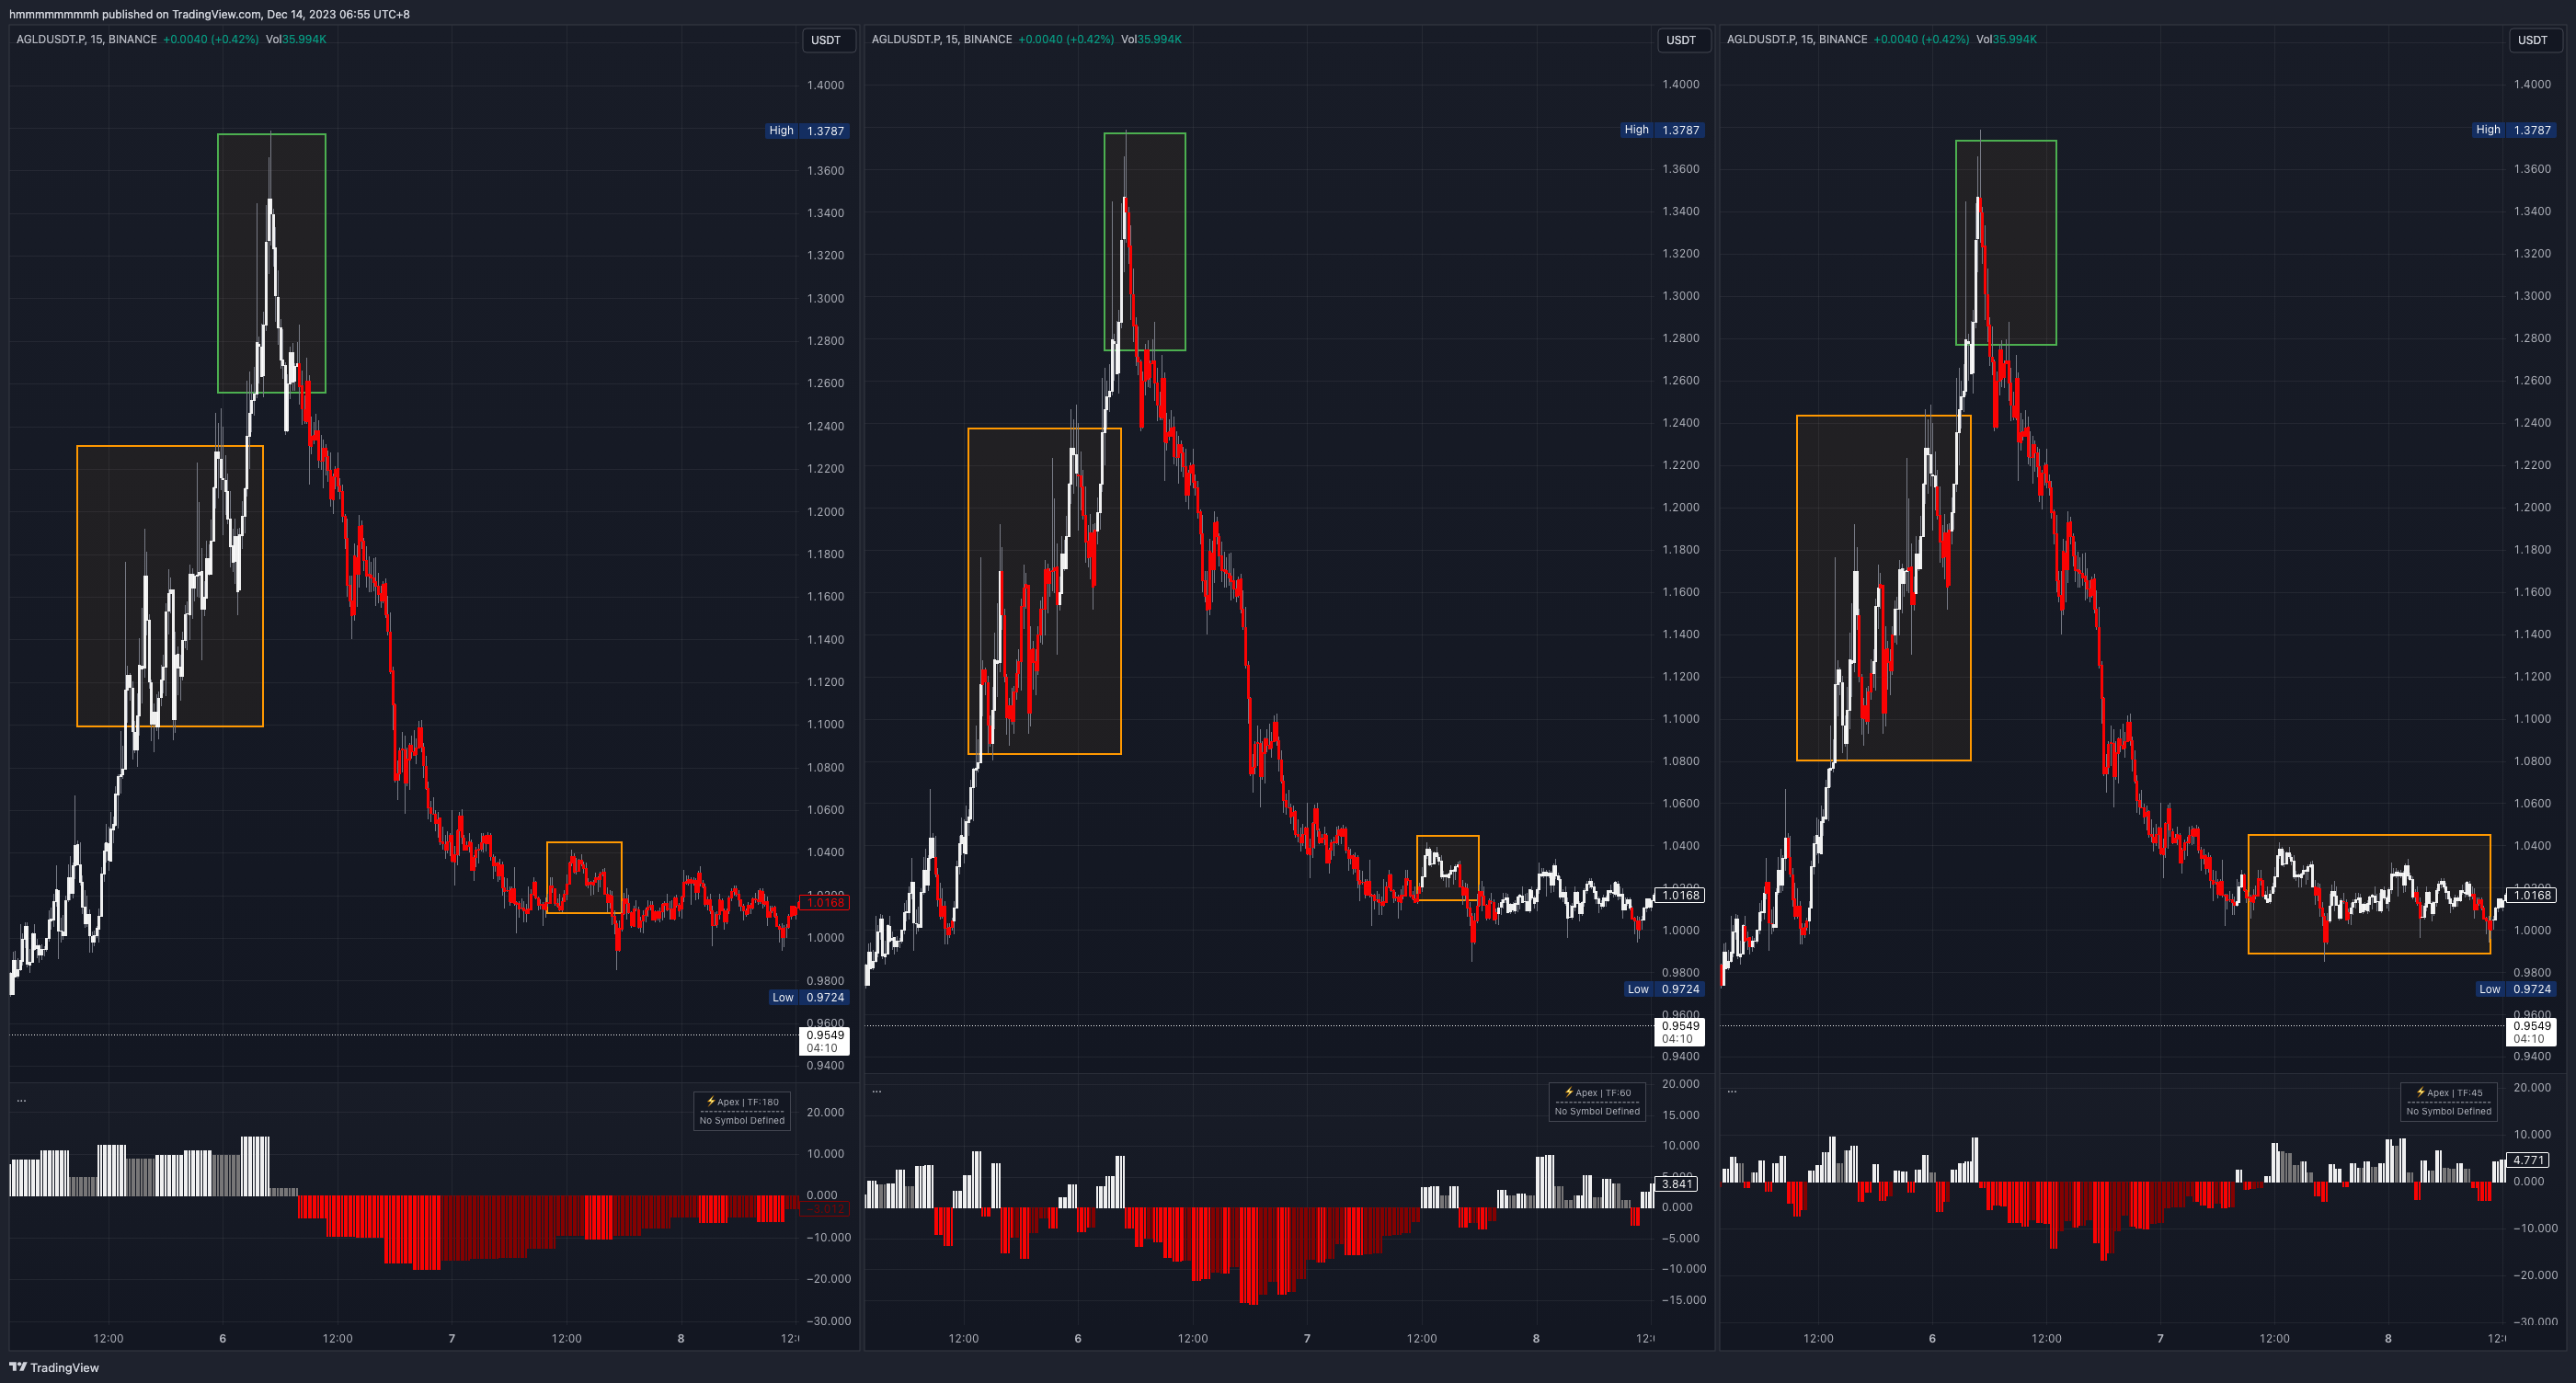 Chart:
 AGLDUSDT; Time Frame: 15m; RSH Data Frame: Left 3H, Middle 1H, Right 45m (AutoPilot); Candle Color: Trend mode
Summary
- Large Timeframe Data: Suitable for medium to long-term trading, filtering out small fluctuations and maintaining trend continuity, but entry and top-out signals may be less precise.
- Small Timeframe Data (still three times the current chart): Suitable for short-term trading, with quick signal responses but less continuity in strong trends.
The choice of an appropriate time frame mainly depends on your trading style. AutoPilot defaults to using a timeframe 3 times the current chart. we will continue to optimize it.
Please note that the larger the timeframe used in RSH, the longer the period of unconfirmed real-time signals you'll have to endure. For example, using 45m data on a 15m chart may result in a signal that can vary over a maximum of three candles, as discussed in the section on "Signal Confirmation."
Candle Color
Modes
- Trend: The default, neutral mode, using RSH colors to reflect trends.
- BuyBias: Displays dark red RSH bars (during rebound stages ) as white, providing greater upward bias.
- SellBias: Displays dark white RSH bars (during pullback stages) as red, providing greater downward bias.
Different Modes in Different Trends
The four examples below show how different candle color modes perform in upward, downward, and consolidating trends.
By examining different trend examples, you should get a general understanding of how different candle color modes are primarily targeted toward a trader's TRADING strategy. The Trend mode is neutral, while the Bias modes tilt in one direction, optimizing the start time by showing color when the opposite side weakens. This is suitable for traders looking only for shorting opportunities or looking only for buying opportunities.
 Uptrend, left Trend (RSH), middle BuyBias (long bias), right SellBias (short bias)
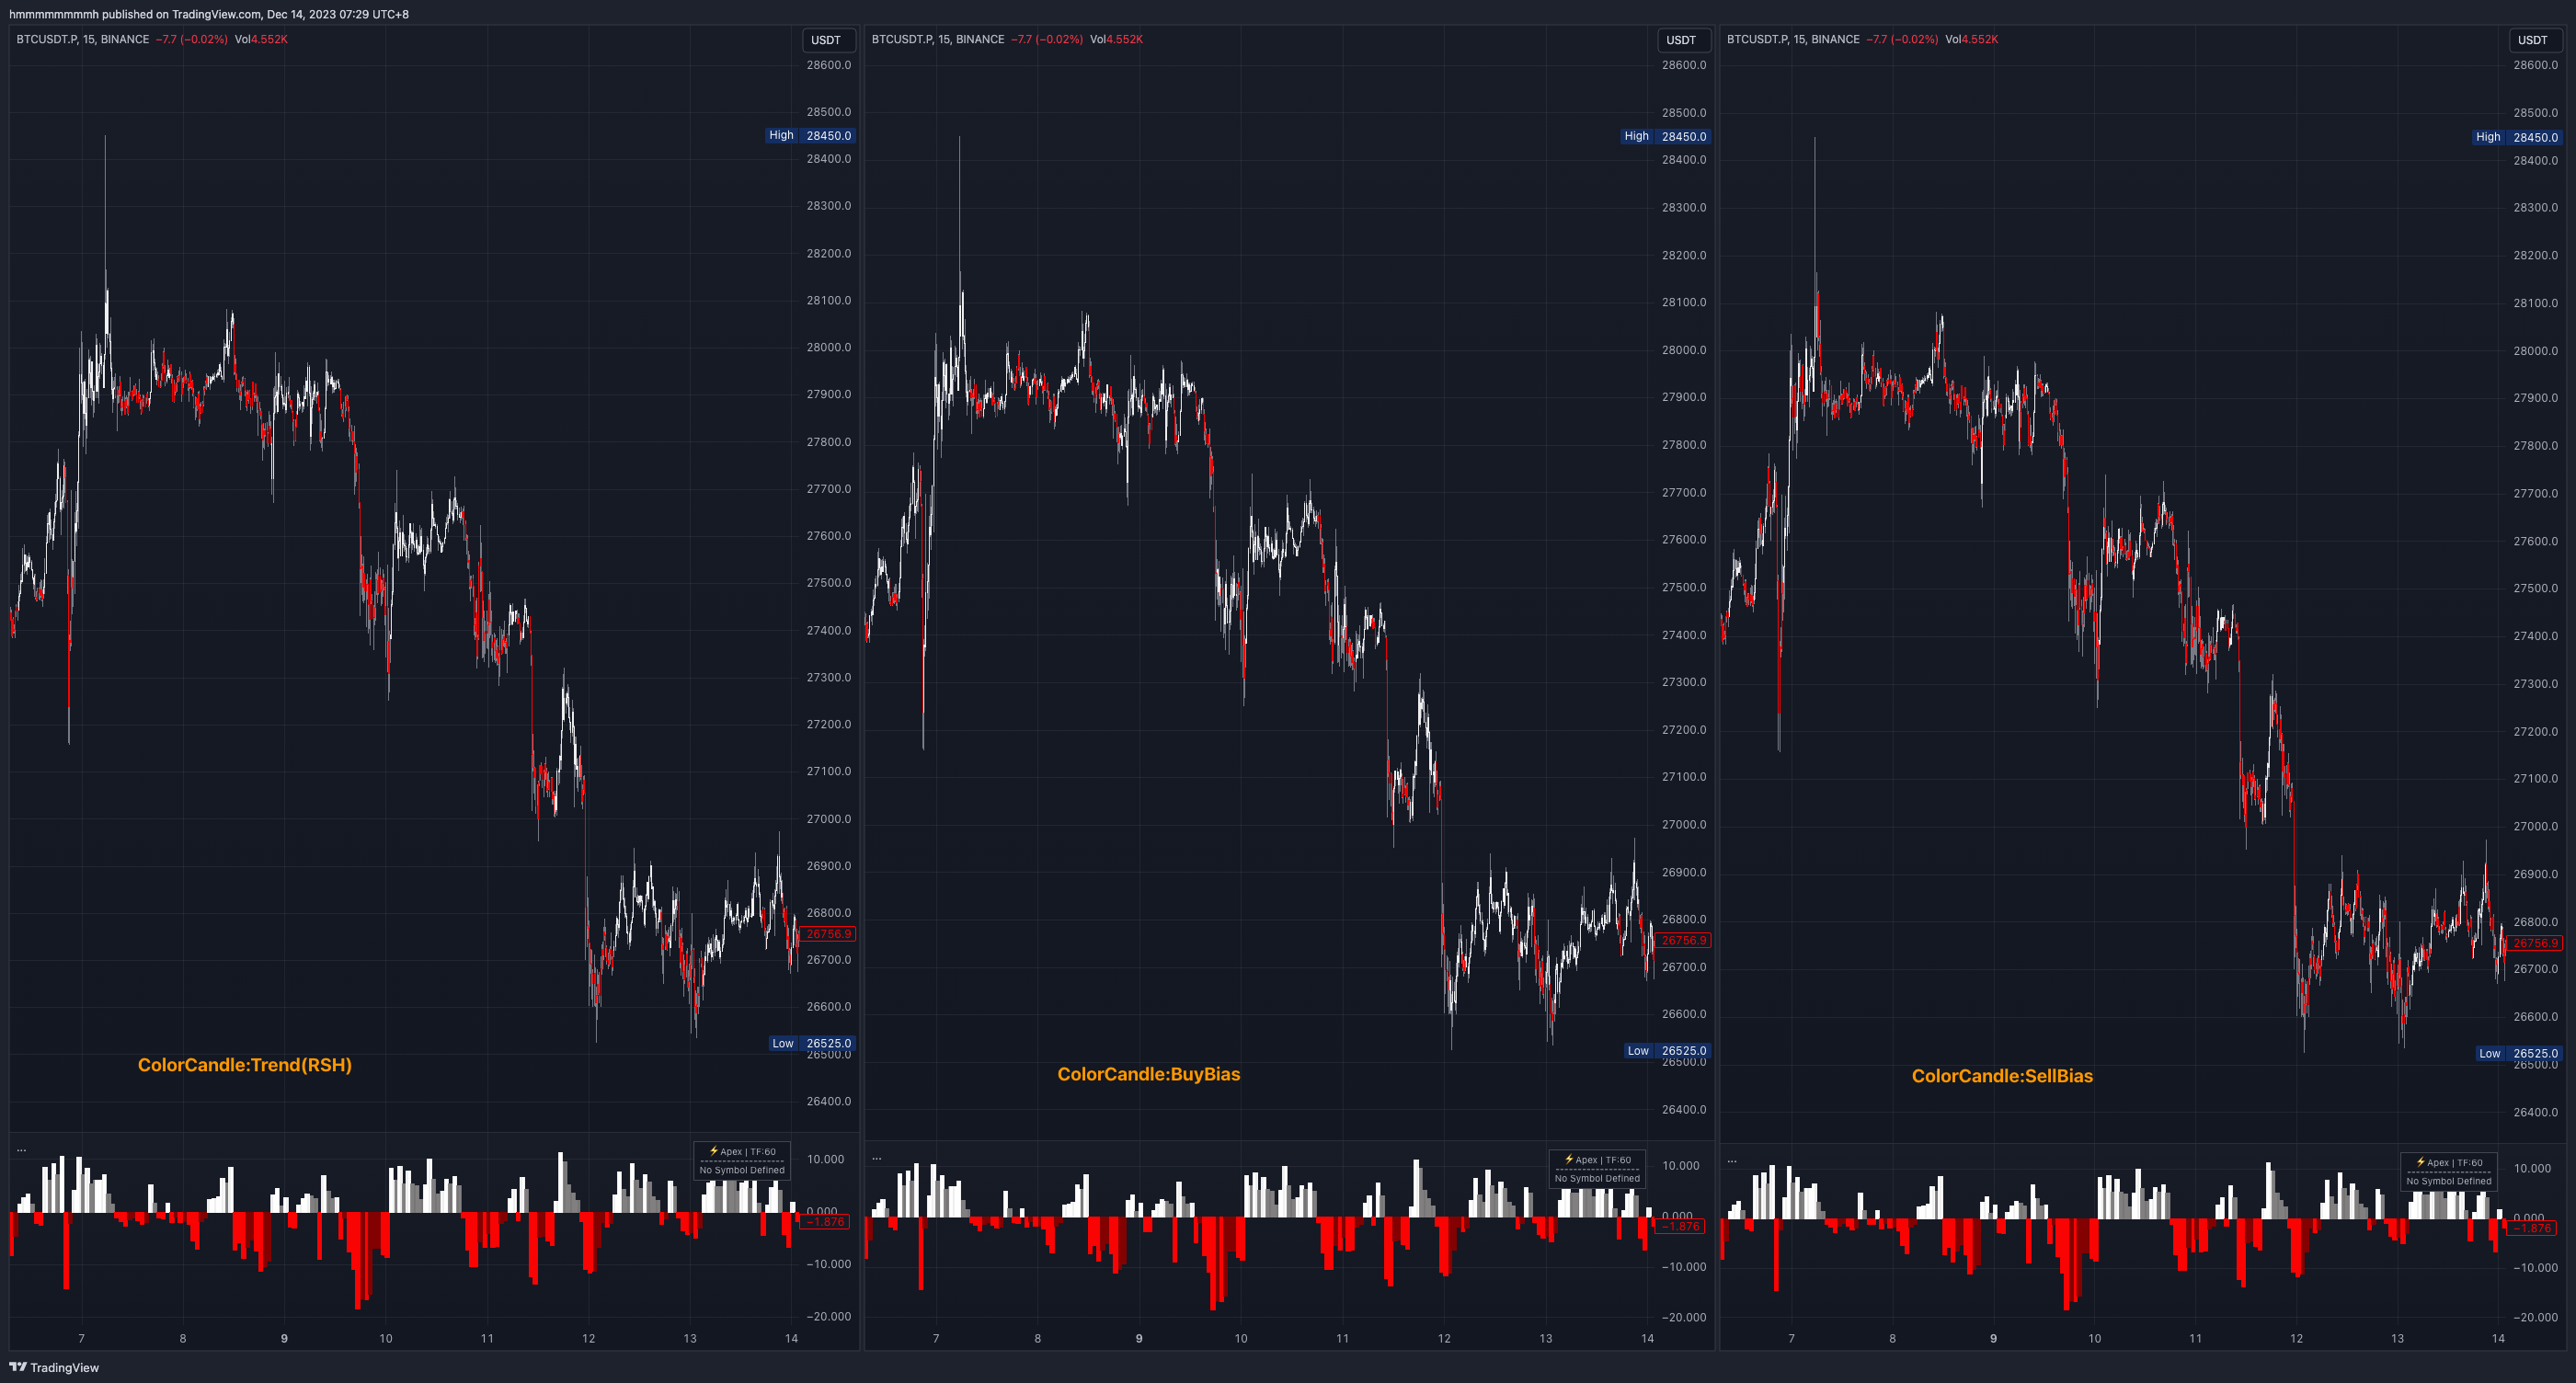 Downtrend, left Trend (RSH), middle BuyBias (long bias), right SellBias (short bias)
 Consolidation, left Trend (RSH), middle BuyBias (long bias), right SellBias (short bias)
 Consolidation, left Trend (RSH), middle BuyBias (long bias), right SellBias (short bias)
Examples
Trend Following
Since RSH is a trending indicator, after understanding the Data Frame and Candle Color, trading becomes straightforward. Simply trade based on the candle/RSH color.
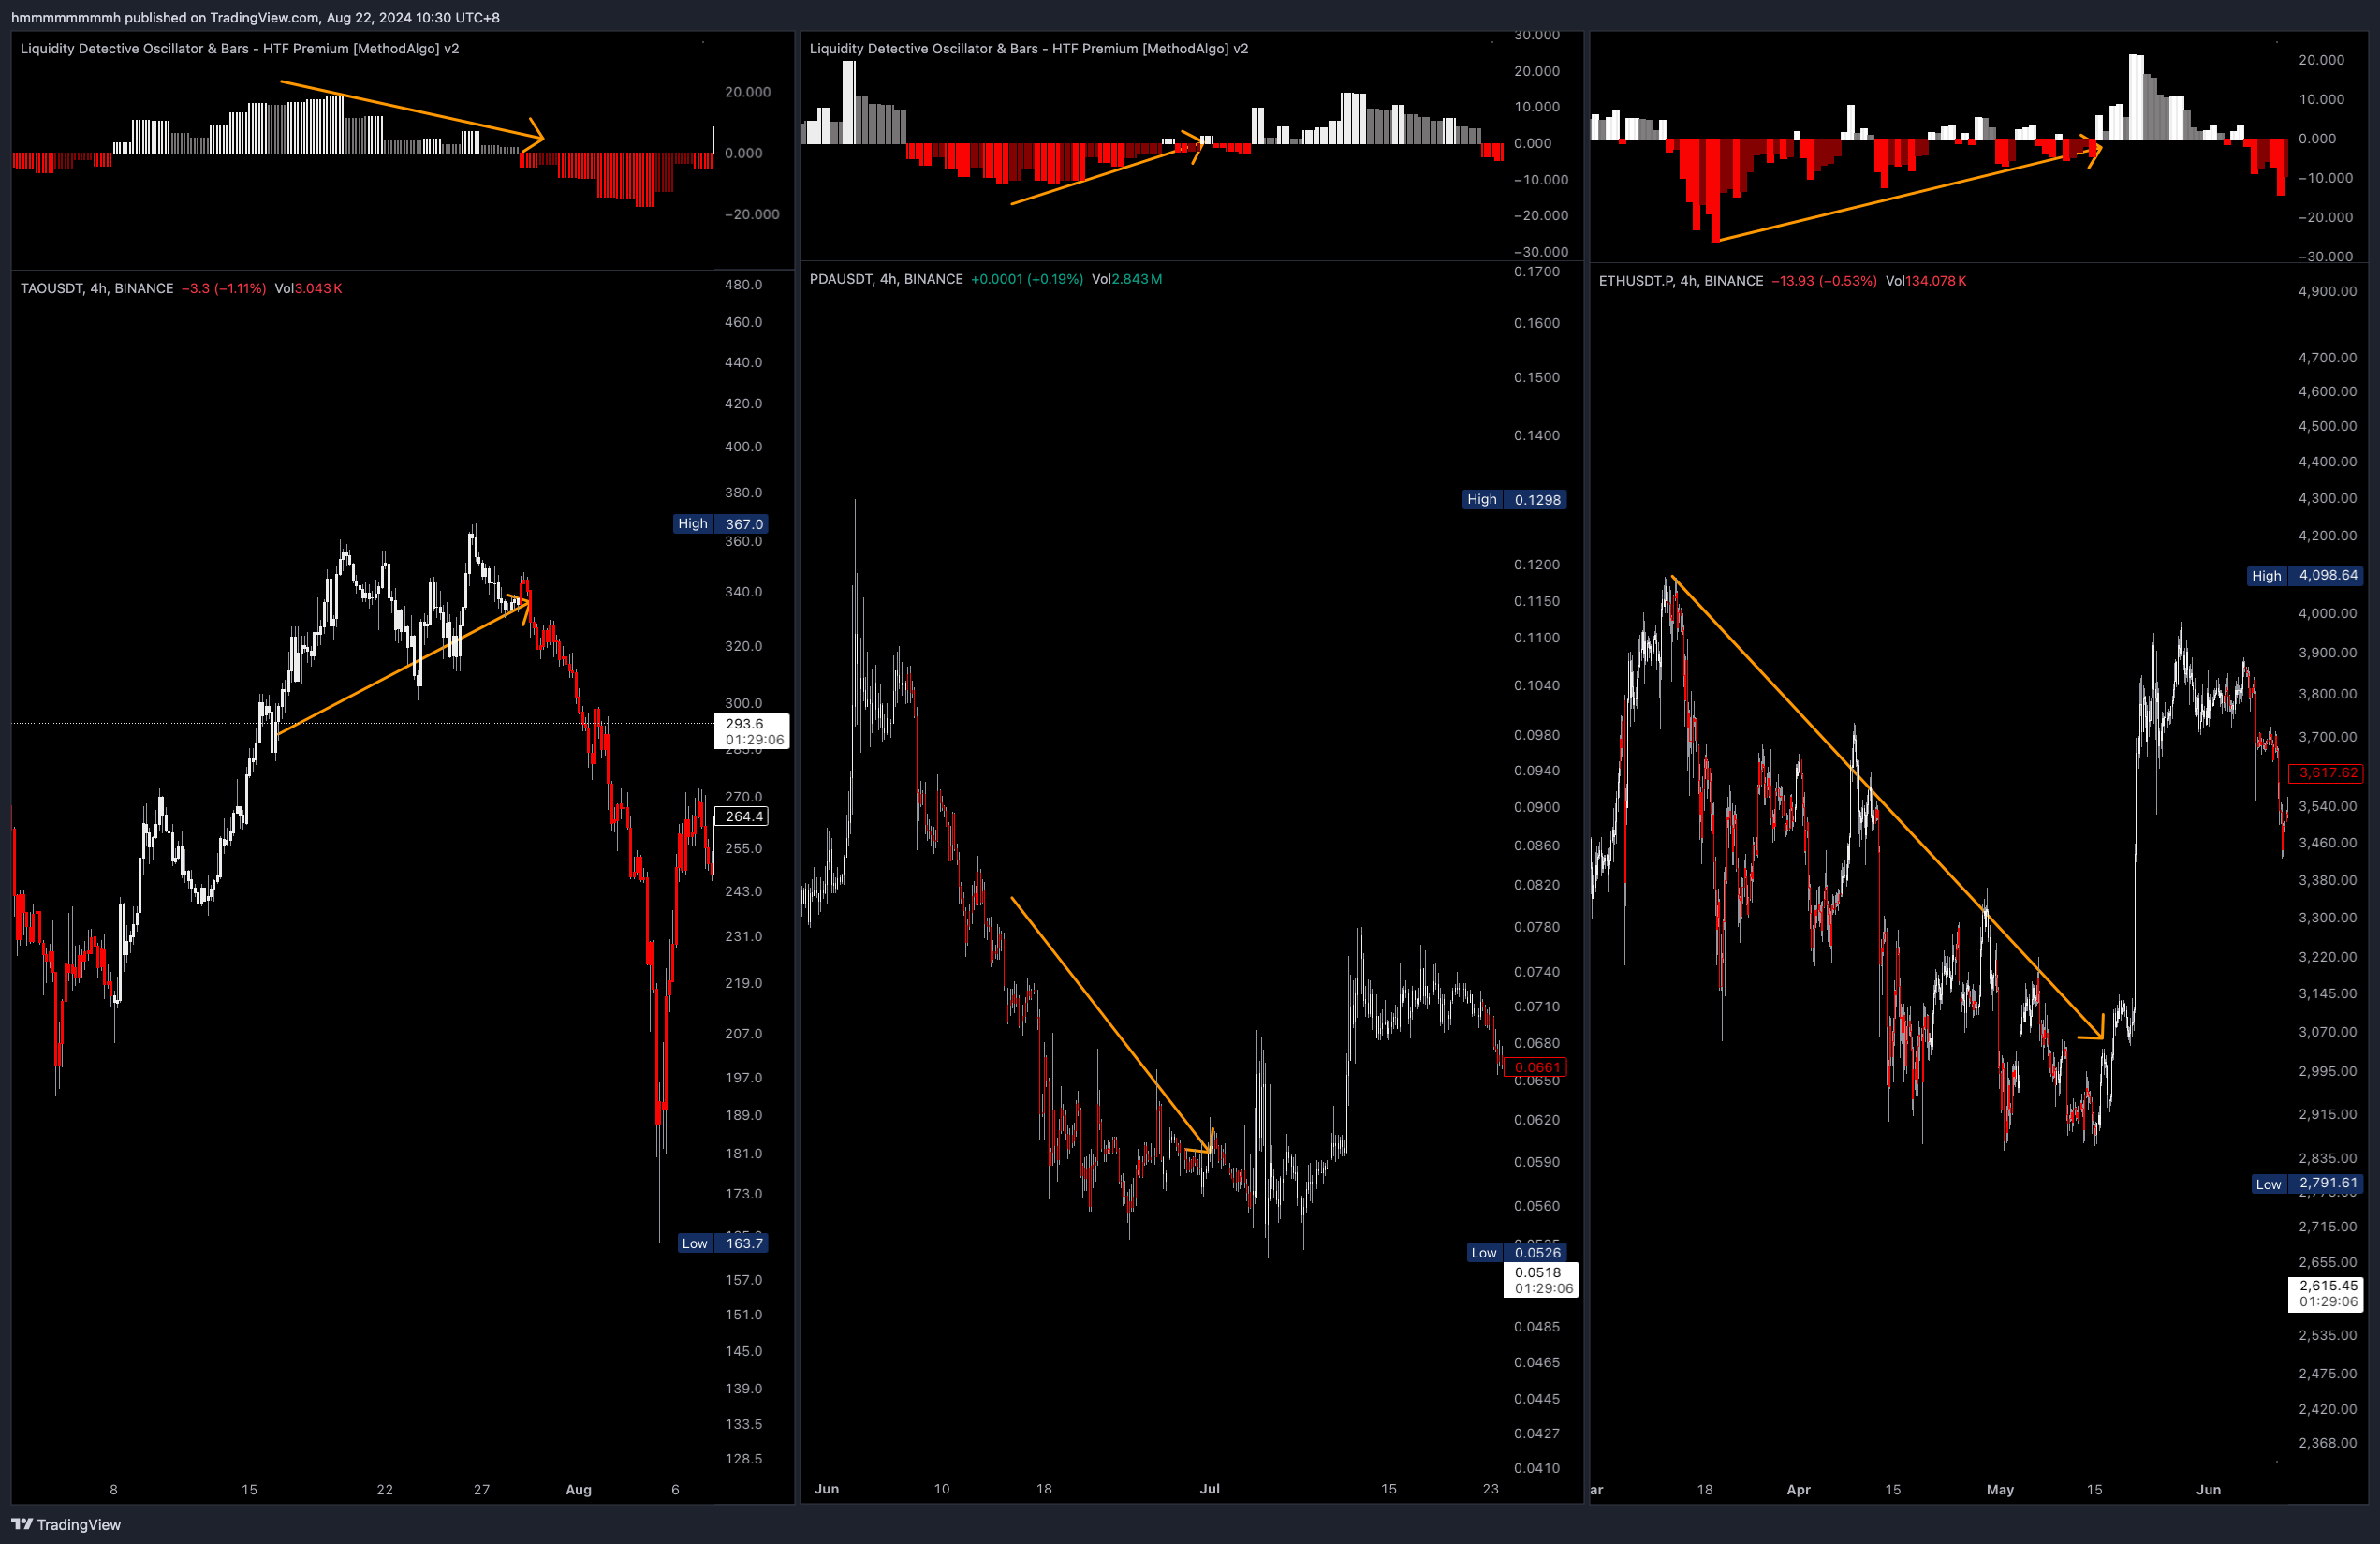
Divergence
"These violent delights have violent ends."
Traders can identify and utilize divergence signals when the momentum bars visibly start weakening. Typically, you can trade in the opposite direction when the RSH changes to the opposite trend color after you spot a divergence, but it is recommended to confirm the signal with other tools and not rely solely on RSH.
Parameter Settings
RSH
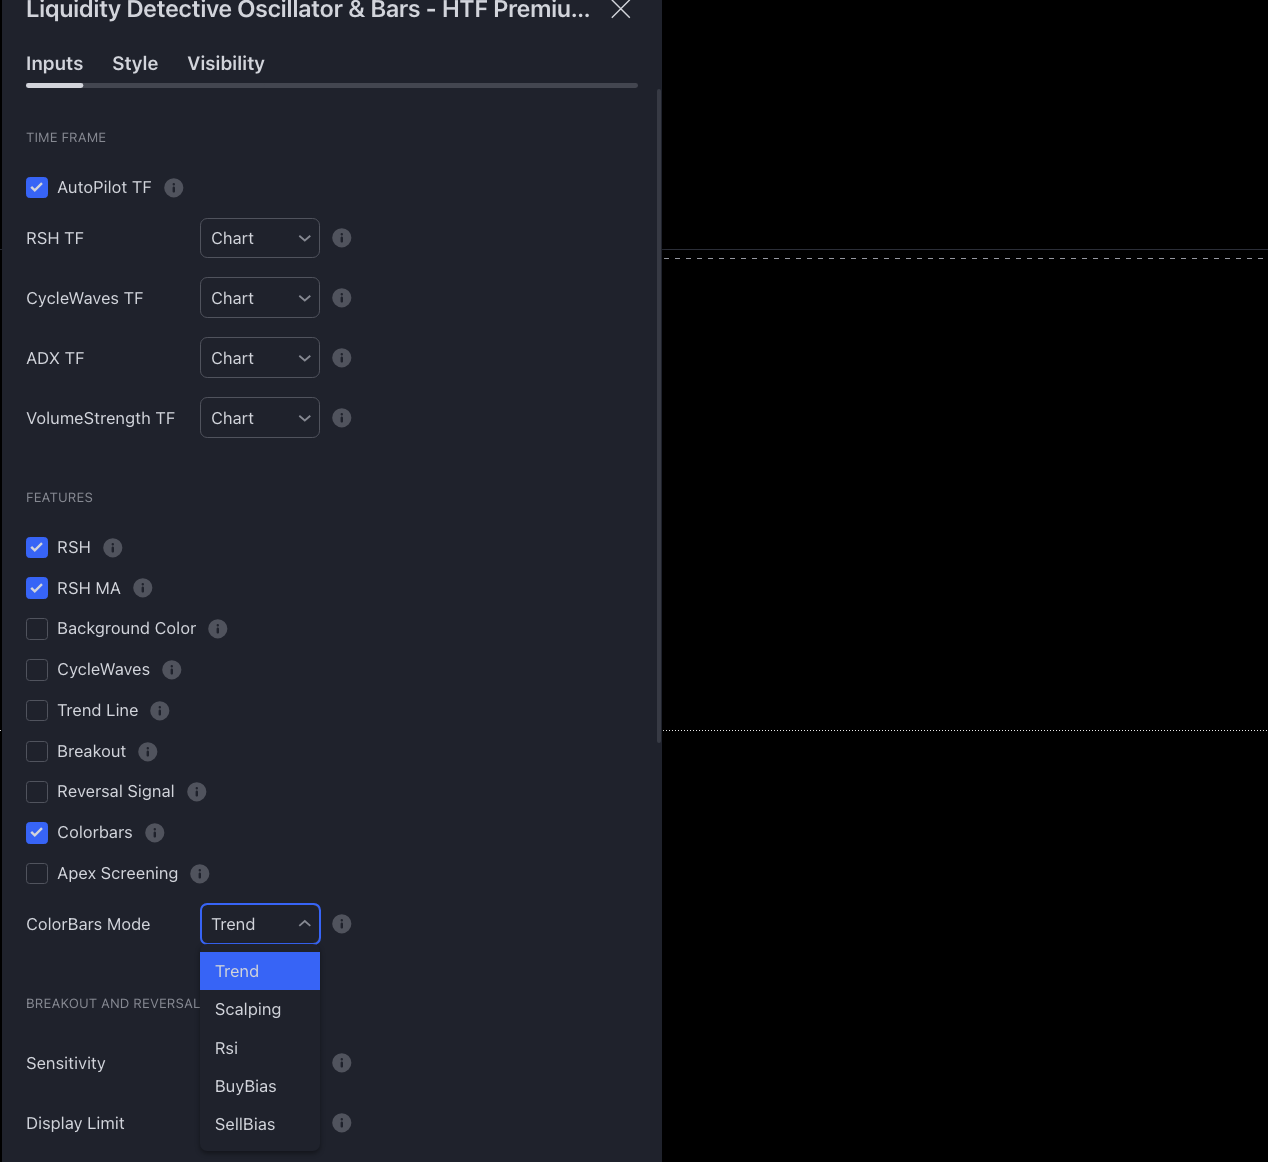
Autopilotand RSH are enabled by default.- To change the data frame, first turn off AutoPilot TF, and then select a custom time frame in RSH TF.
- RSH offers an RSH MA (Moving Average) , which can be enabled in the settings to help display the increasing or decreasing trend of the RSH.
Candle Color
- Candle color is enabled by default, but can be turned off in the Feature settings.
- Choose the Candle Color Mode in the
ColorBar Modesetting.
Remarks
- The midpoint of the RSH is also the midpoint of the CycleWave line and the RSI indicator line.
- RSH breaks down large trend data into smaller trend momentum for your analysis.
- Since RSH is a relative indicator, the bar length and color do not directly determine the magnitude of price movement.
- When using HTF (Higher Time Frame) candle data, be mindful of the difference between confirmed and unconfirmed signals as discussed in the section on Realtime vs Confirmed Signals
- RSH is primarily used as a trend indicator.
The engineers at MethodAlgo are proud of their work, but it's essential for you to understand that no indicator / algorithm can guarantee perfect success. Trading profits and losses are greatly influenced by the trader's psychology, knowledge, experience, and risk management.
The algorithmic interfaces we provide are all part of T.A.T.A. When trading in reality, traders should make their decision like T.A.T.A, considering various factors and signals from other tools to establish confluence system.
Any unclear explanations or errors in this tutorial? Please contact MethodAlgo's @Staff on the Discord Trading Terminal for corrections.