Reversal Signal
Concept
The Liquidity Detective is an oscillator that combines multiple scientific analysis methods and second layer data signals. While it integrates various factors and data from the market, its core task is to validate and provide timing signals for traders.
In Liquidity Detective, all signals and states generated by tools such as ADX, trend lines, RSH, RSI breakouts, CycleWave breakouts, and volume harmony are re-analyzed and integrated. This has created a relative sentiment analysis system based on timing, which constructs a composite reversal signal to help traders achieve balanced trading decisions by considering multiple aspects and factors.
How You Can Use It
- Signals for stopping declines or rallies
- Reversal timing
Interface
Red Triangle: Indicating a possible end to an uptrendWhite Triangle: Indicating a possible end to a downtrendX Mark: Premature end signal, indicating that the current data no longer supports the direction of the previous triangle but does not yet meet the conditions for the next reversal.
For Existing Biases
Like other tools in the Liquidity Detective, the reversal triangle signal is a timing signal. Therefore, before using the reversal triangle signal, you should already have a primary bias regarding the current trend and use it during the stage of looking for entry opportunities.
Choosing the Right Timeframe
When swing trading on a 4-hour timeframe, you shouldn't look at 1-hour reversal signals because smaller timeframes provide more analysis data and volatility signals, while larger timeframes filter out the fluctuations in smaller timeframes.
Similarly, when trading on a 1-hour chart, you shouldn't reference 4-hour reversal signals because the larger timeframe filters out the fluctuations in smaller timeframes, which might cause you to miss more detailed entry opportunities.
Note: This refers to the chart's timeframe, not the data timeframe settings within Liquidity Detective.
Proof of Concept
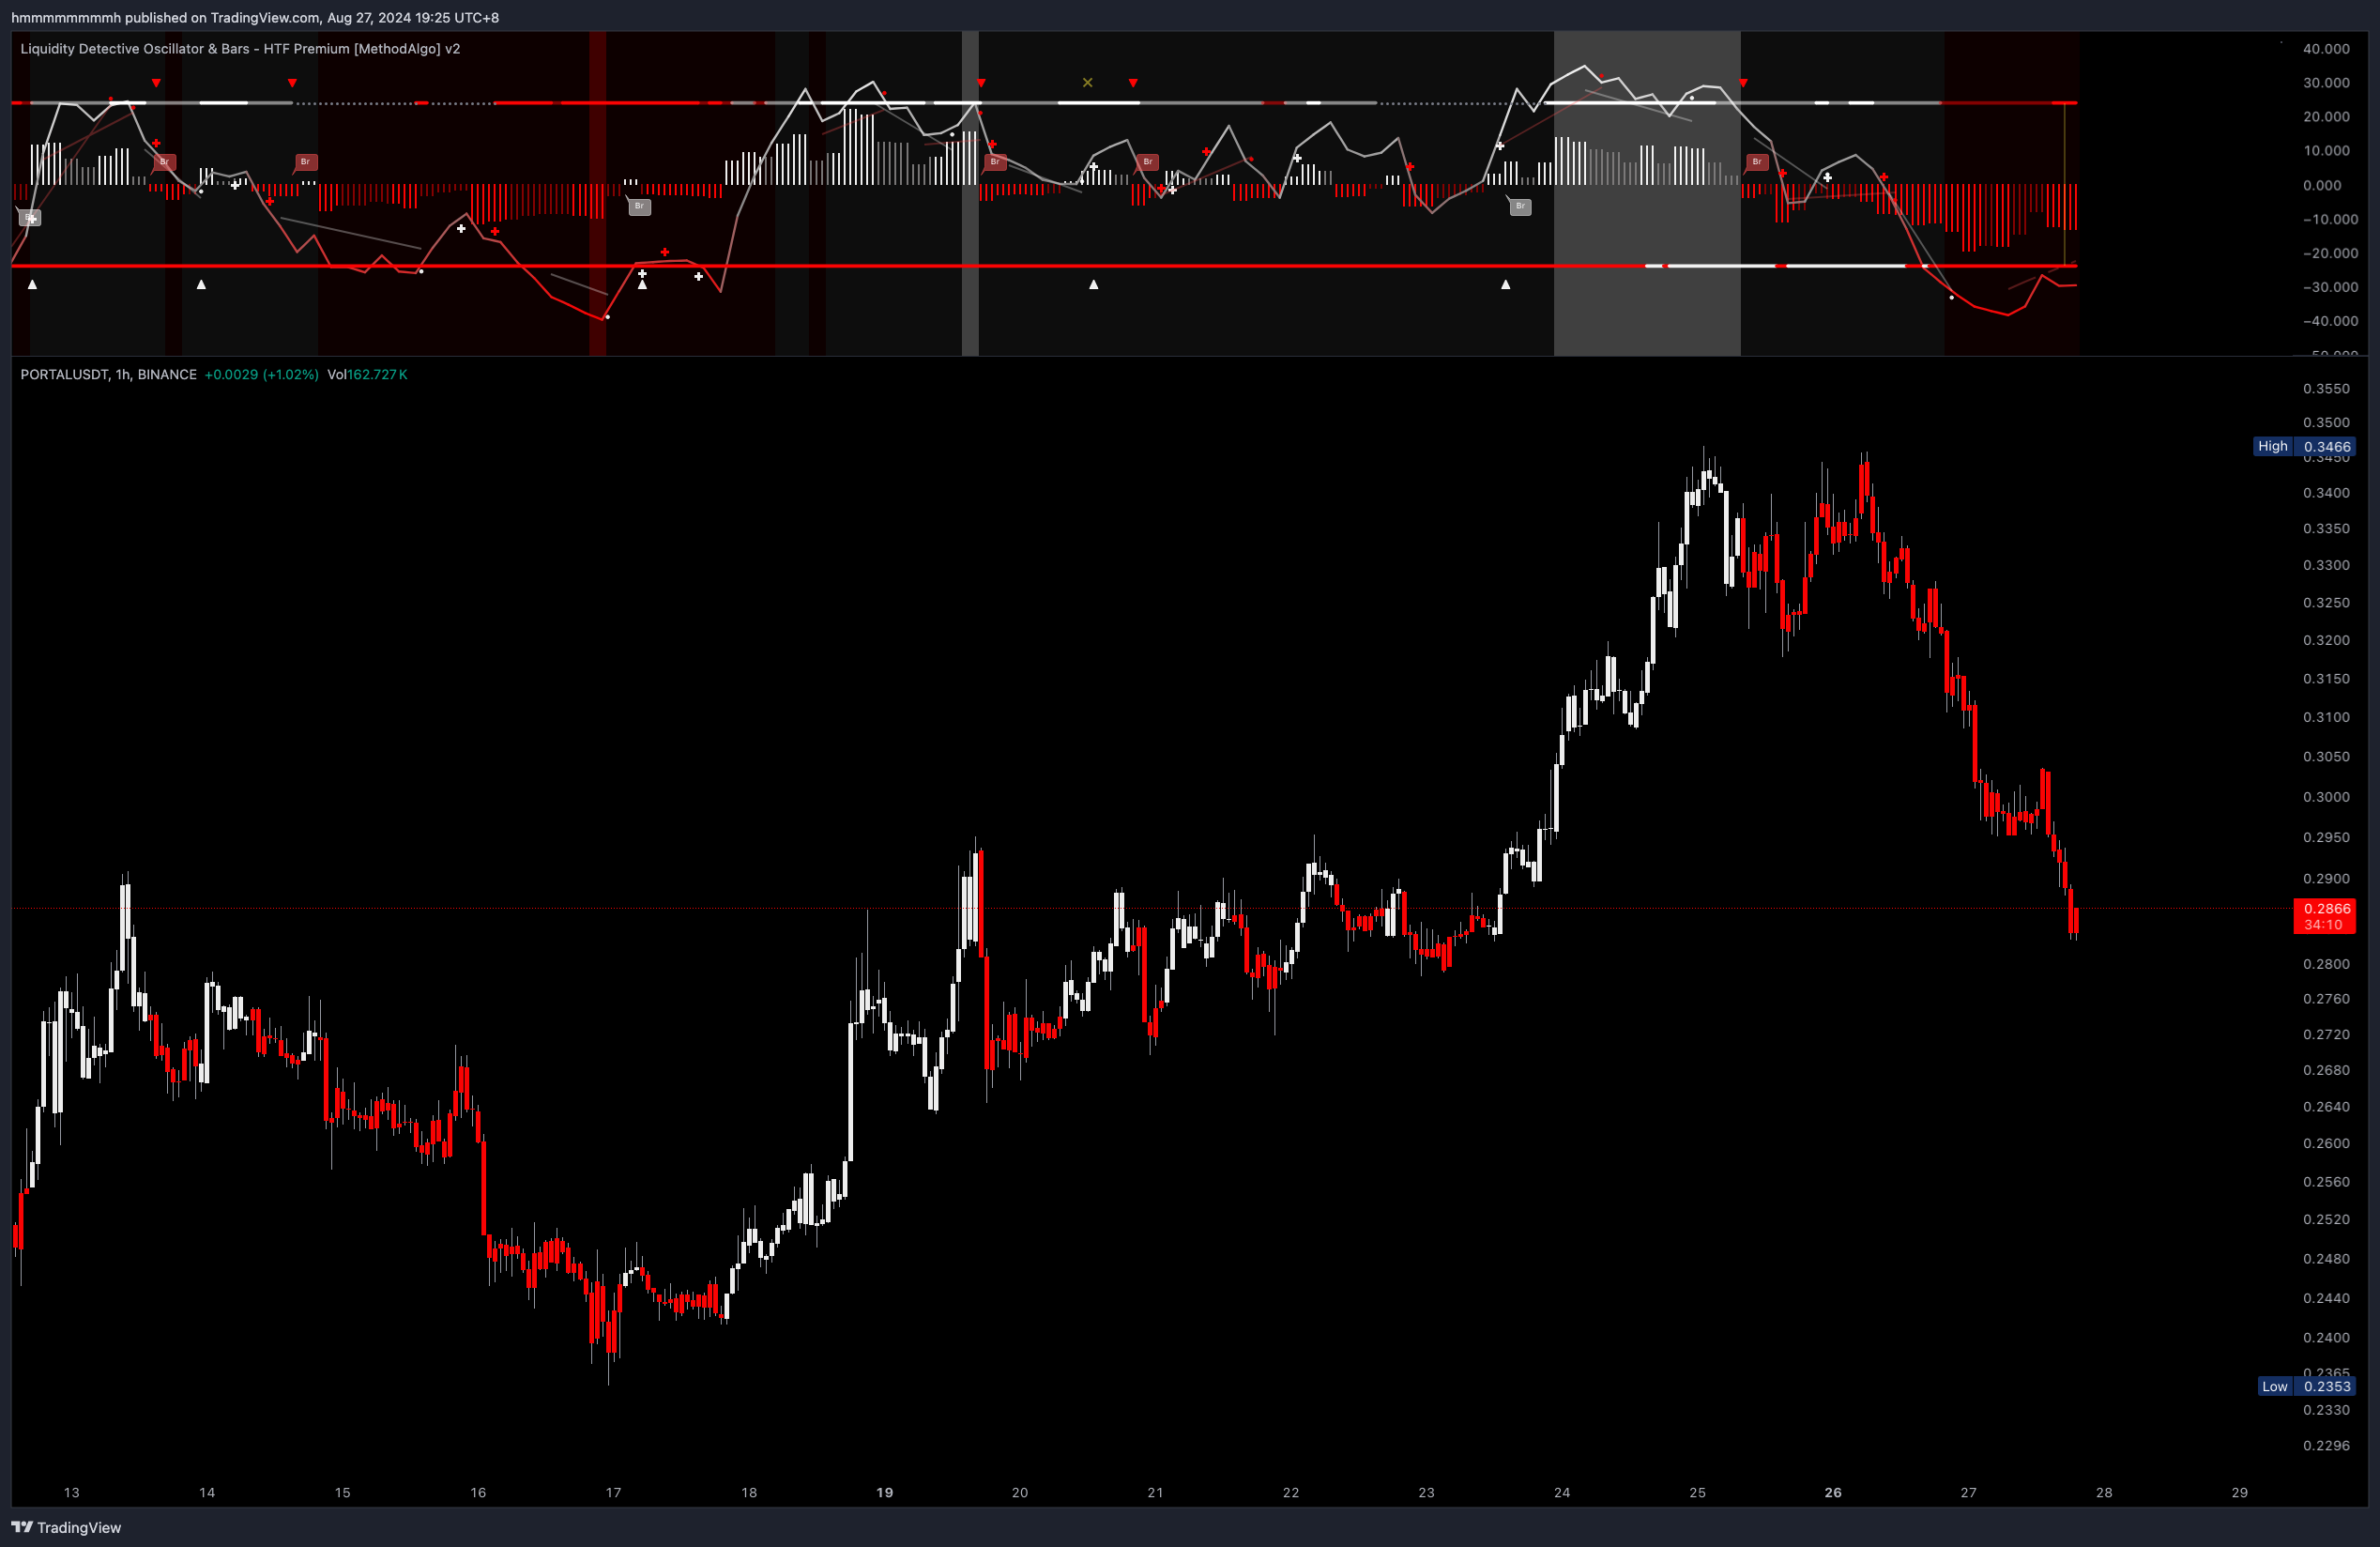
The following two example charts are ETHUSDT 1-hour and 4-hour charts. We drew a yellow resistance line on the 4-hour chart, aiming for a trend breakout. After determining this trading bias, we observed the Liquidity Detective's reversal triangles on the charts of both timeframes.
It's clear that the signal on the 4-hour chart is more distinct and continuous, while the 1-hour signal appears intermittent. This is because the 1-hour chart shows a range-bound area near the breakout zone, unrelated to the resistance line on the 4-hour chart. Additionally, since the 4-hour timeframe covers a broader range of data, the various tool signals that make up the reversal triangle within the Detective are symmetrically analyzed.
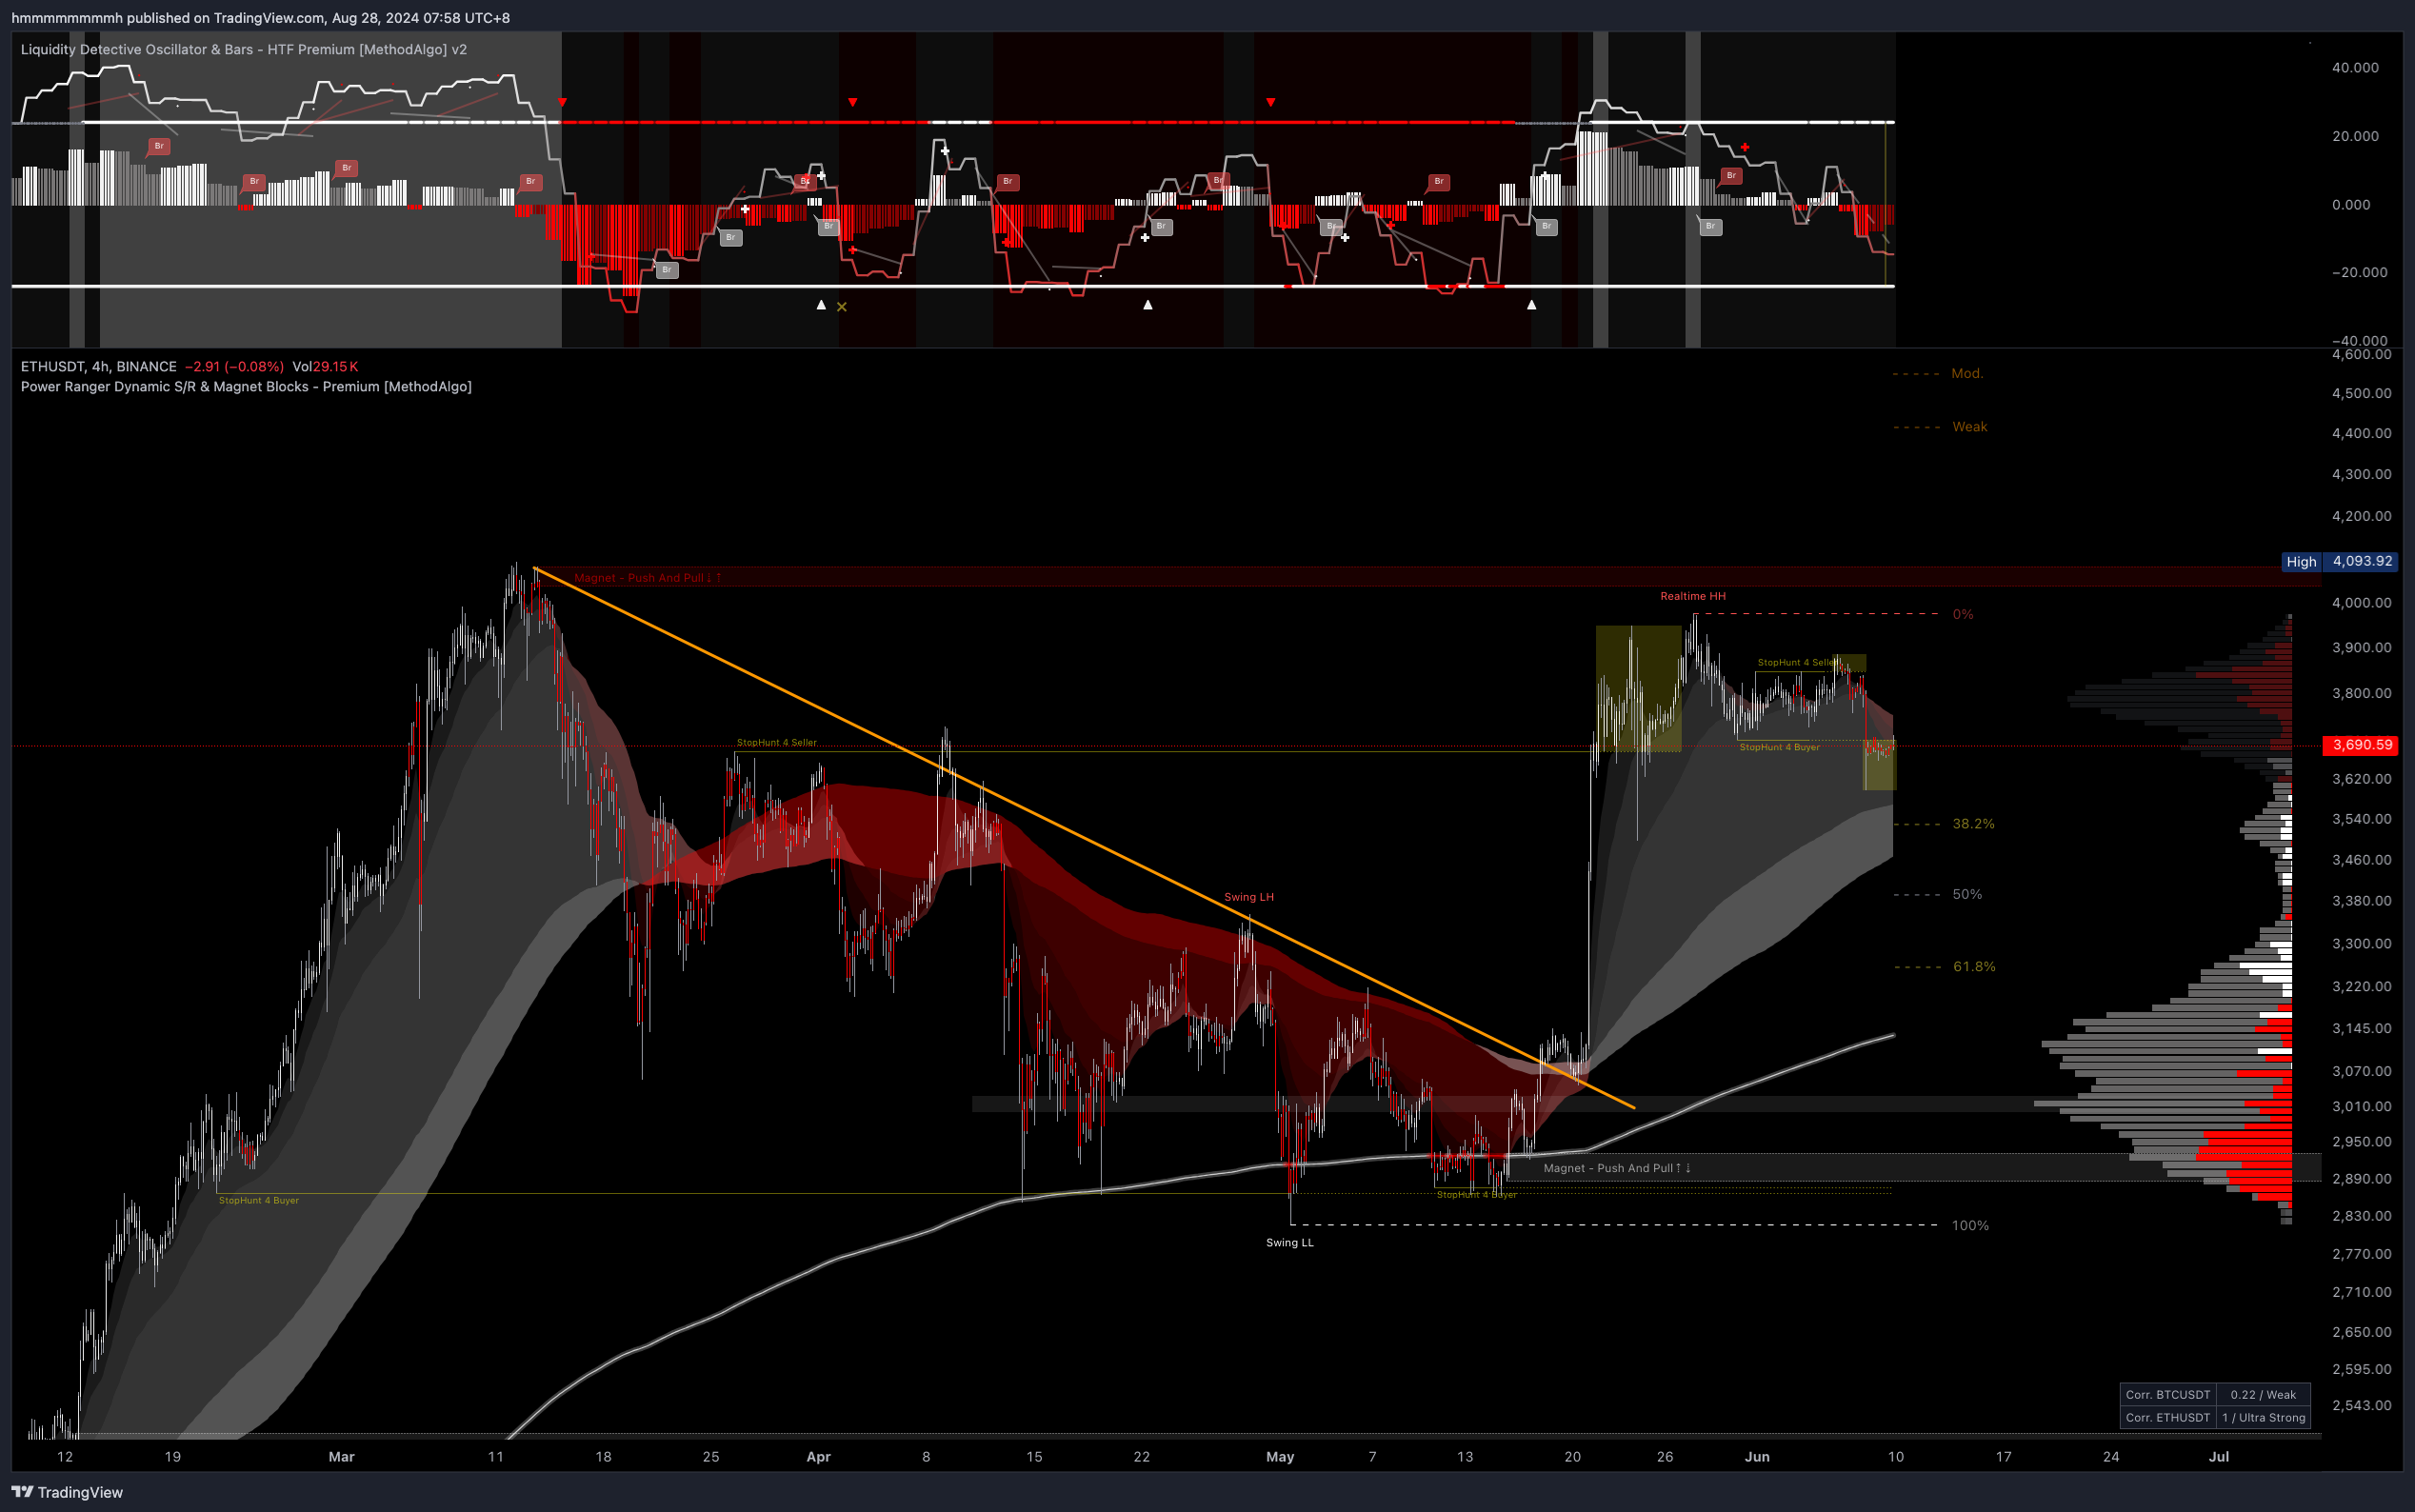 ETHUSDT 4-hour
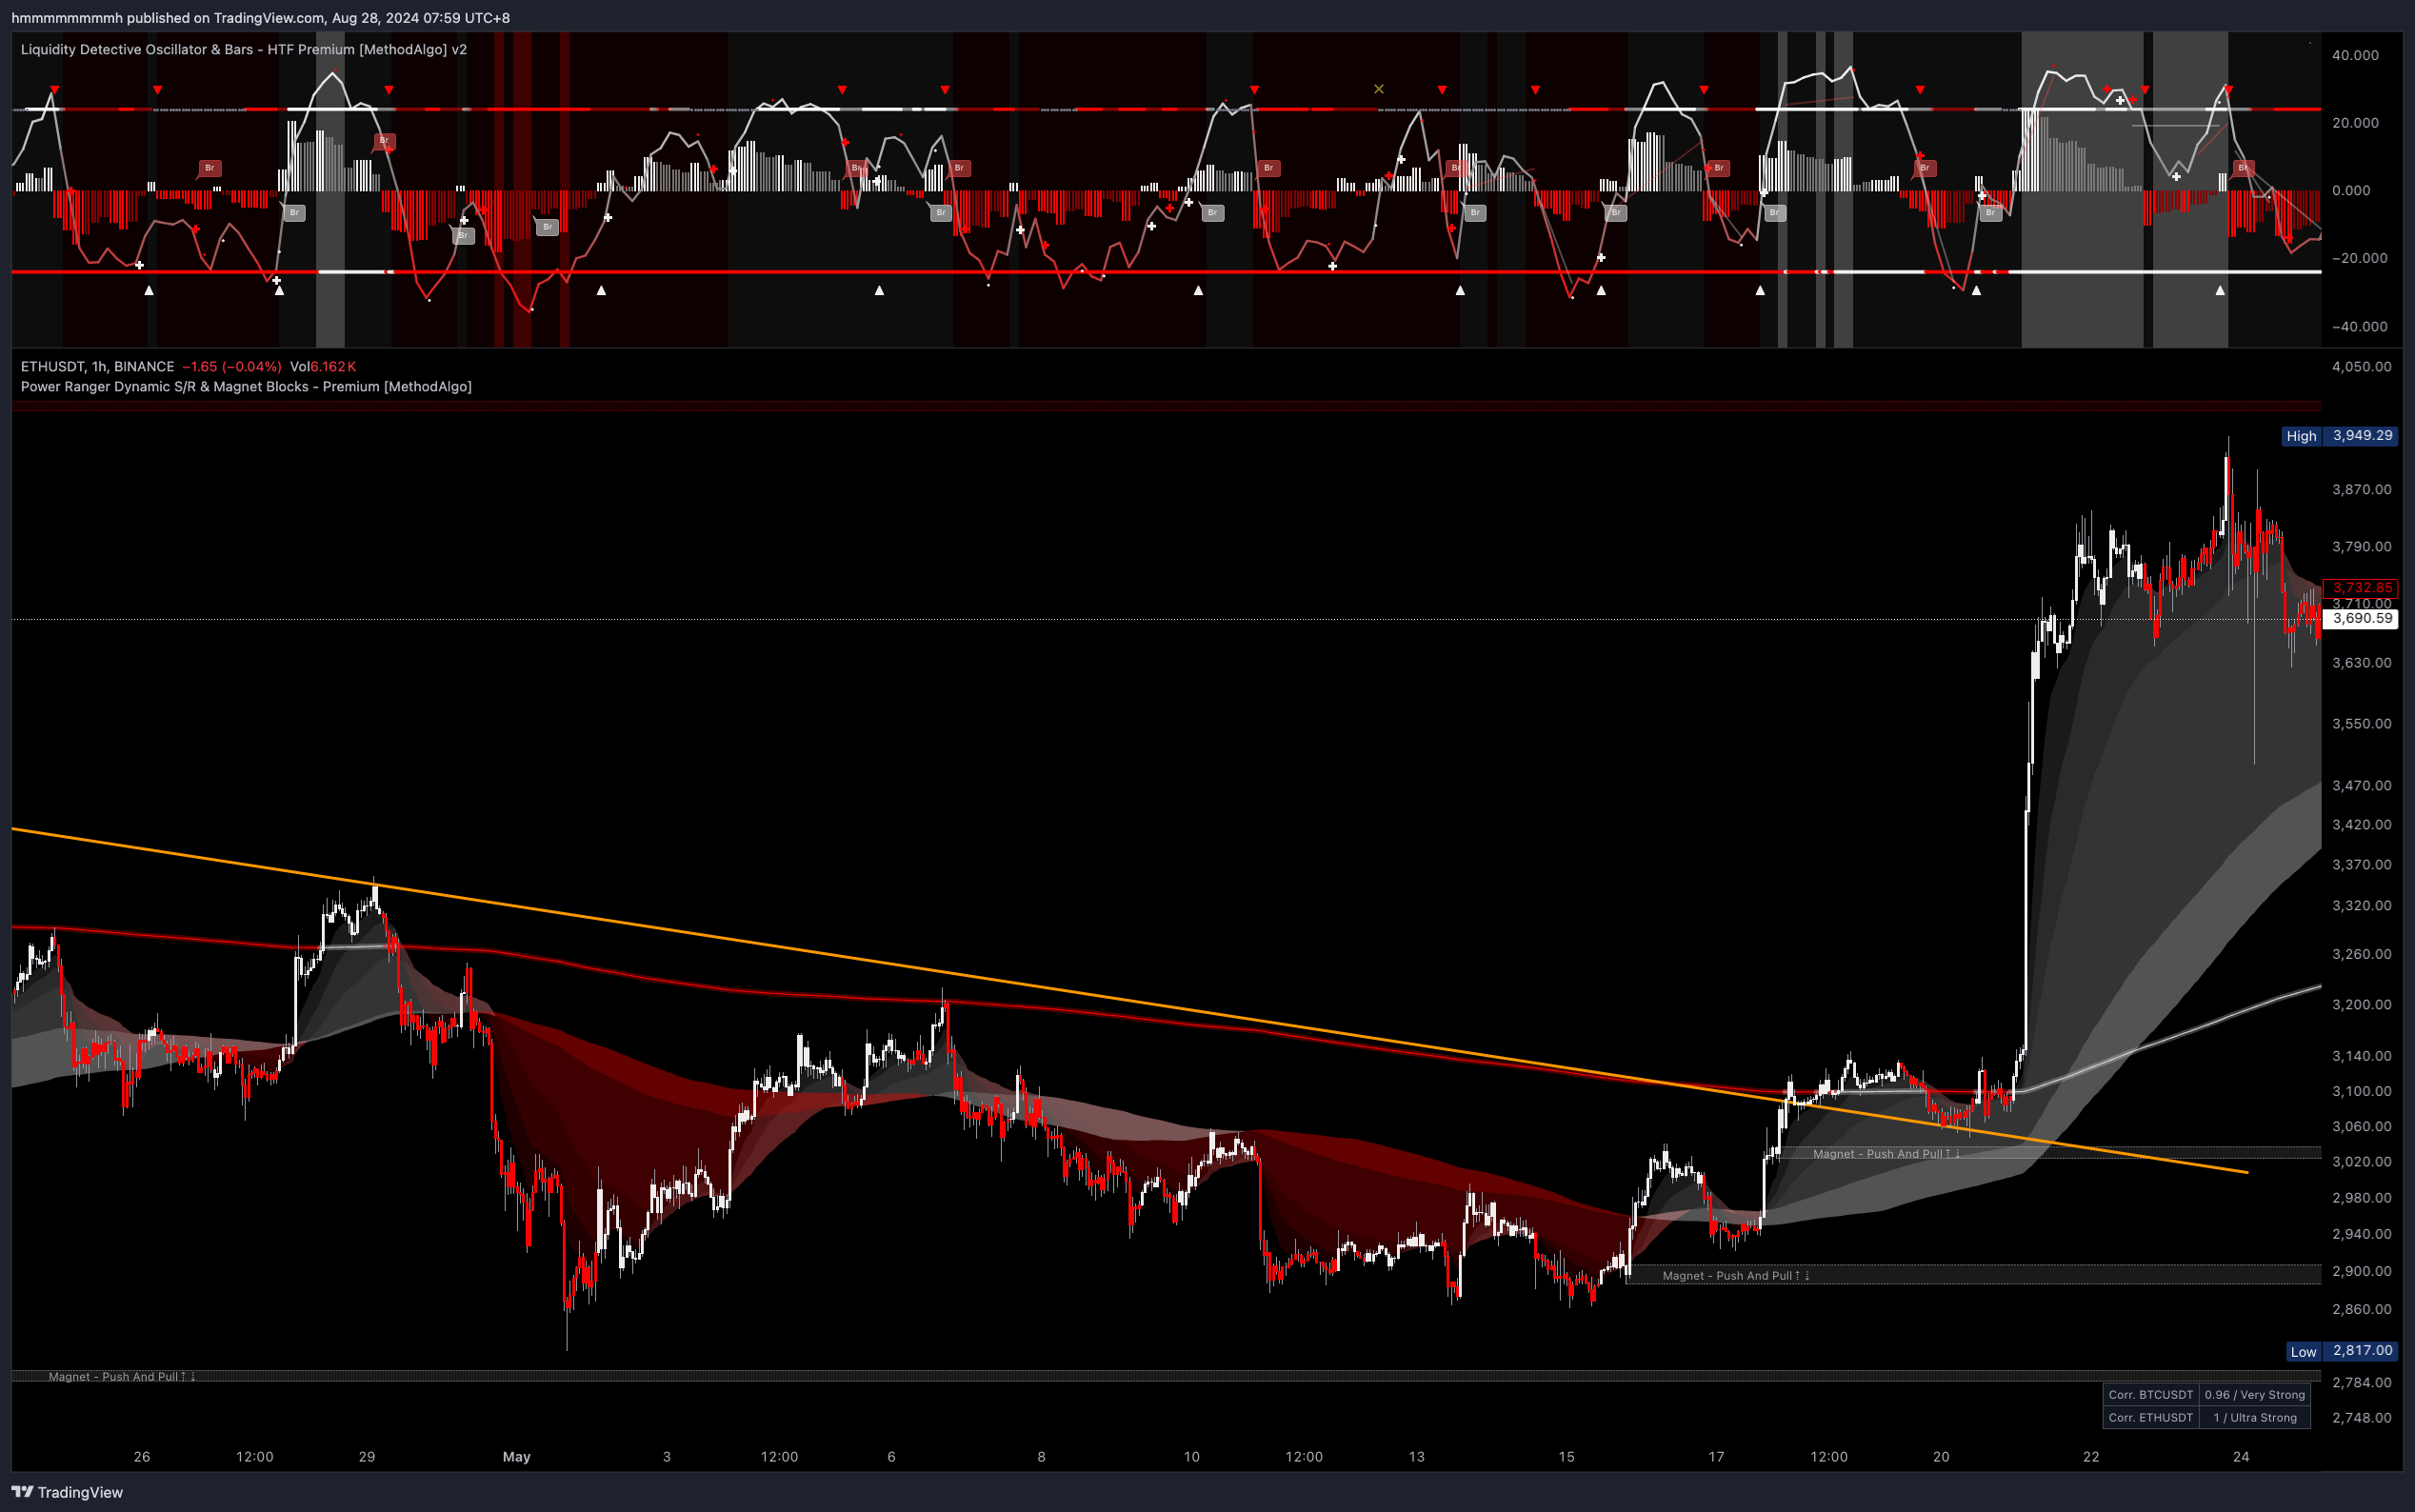 ETHUSDT 1-hour
Examples
Dip Entry Opportunity
In the example below, after obtaining a bullish bias through other structural analysis tools, while waiting to enter at a dip, traders can use the reversal triangle of the Liquidity Detective, in addition to the various tools we provide for observing dips. You can choose to enter at the first reversal triangle that appears after a pullback to reduce potential drawdown after entry.
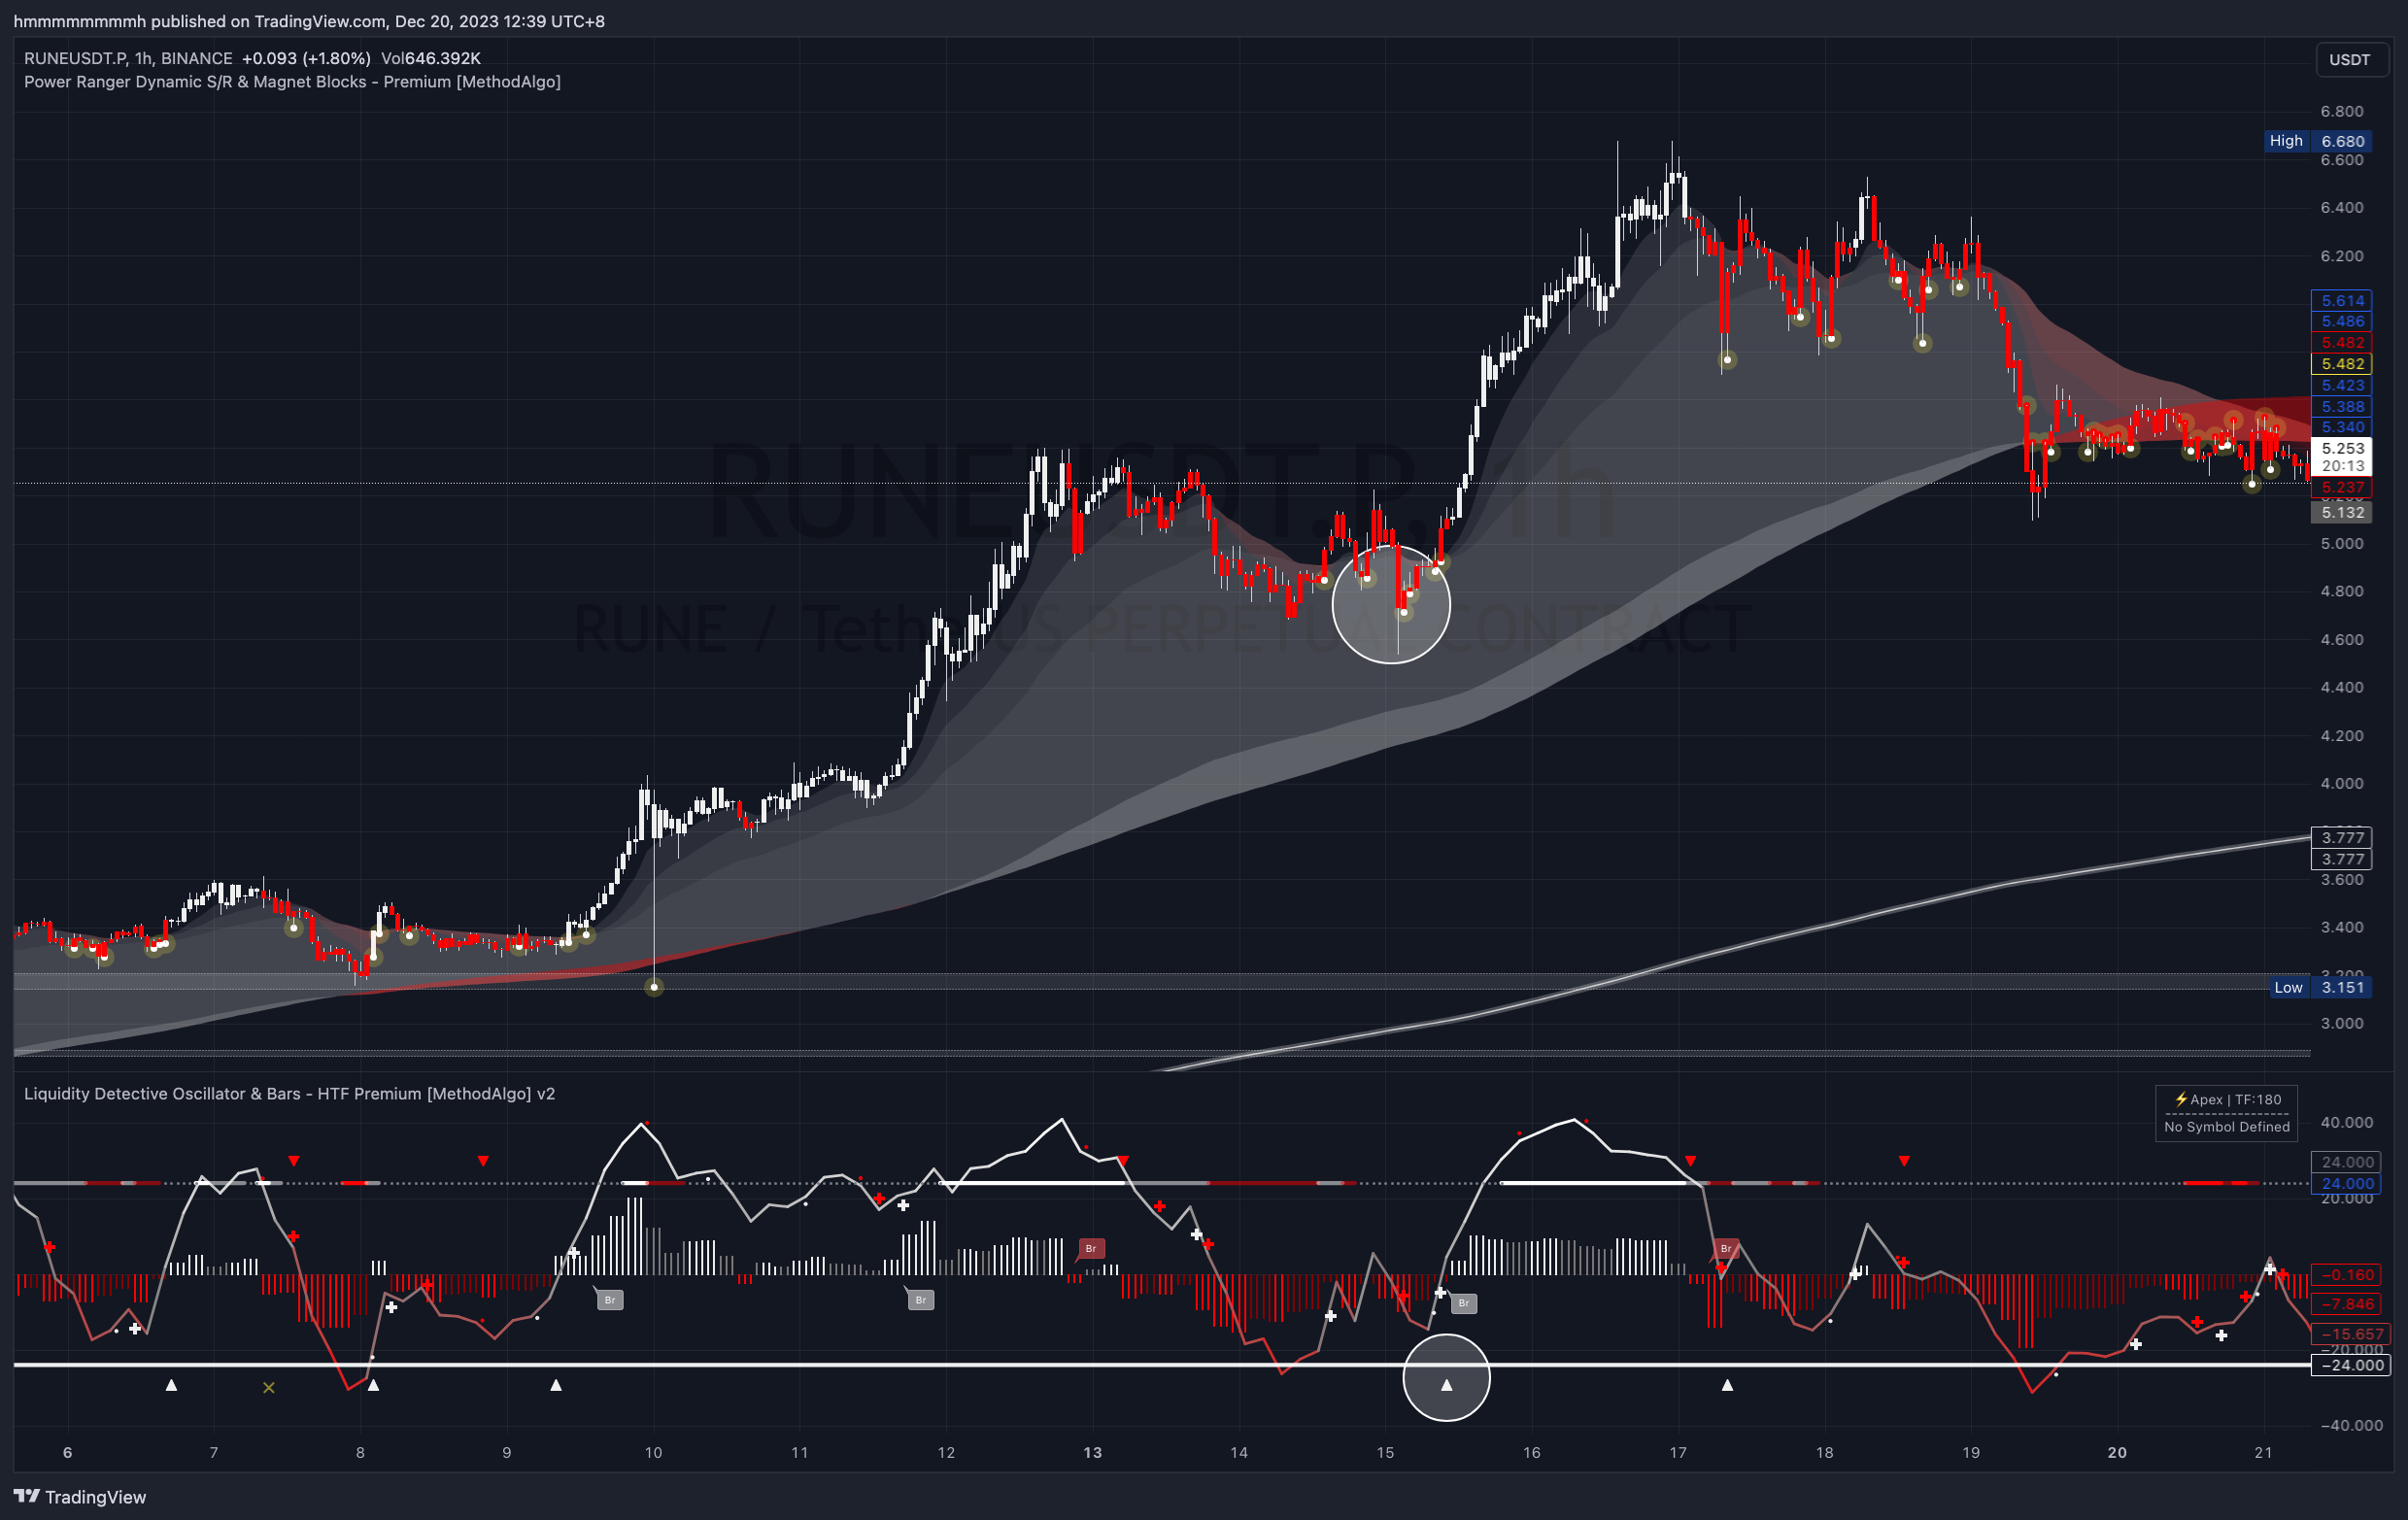 RUNEUSDT, 1-hour
Enhancing Bias
When other tools provide one or more bullish or bearish biases, as shown in the double-top pattern below, the triangle signal can act as a confirmation signal for the pattern, enhancing the expected bias of the pattern's movement.
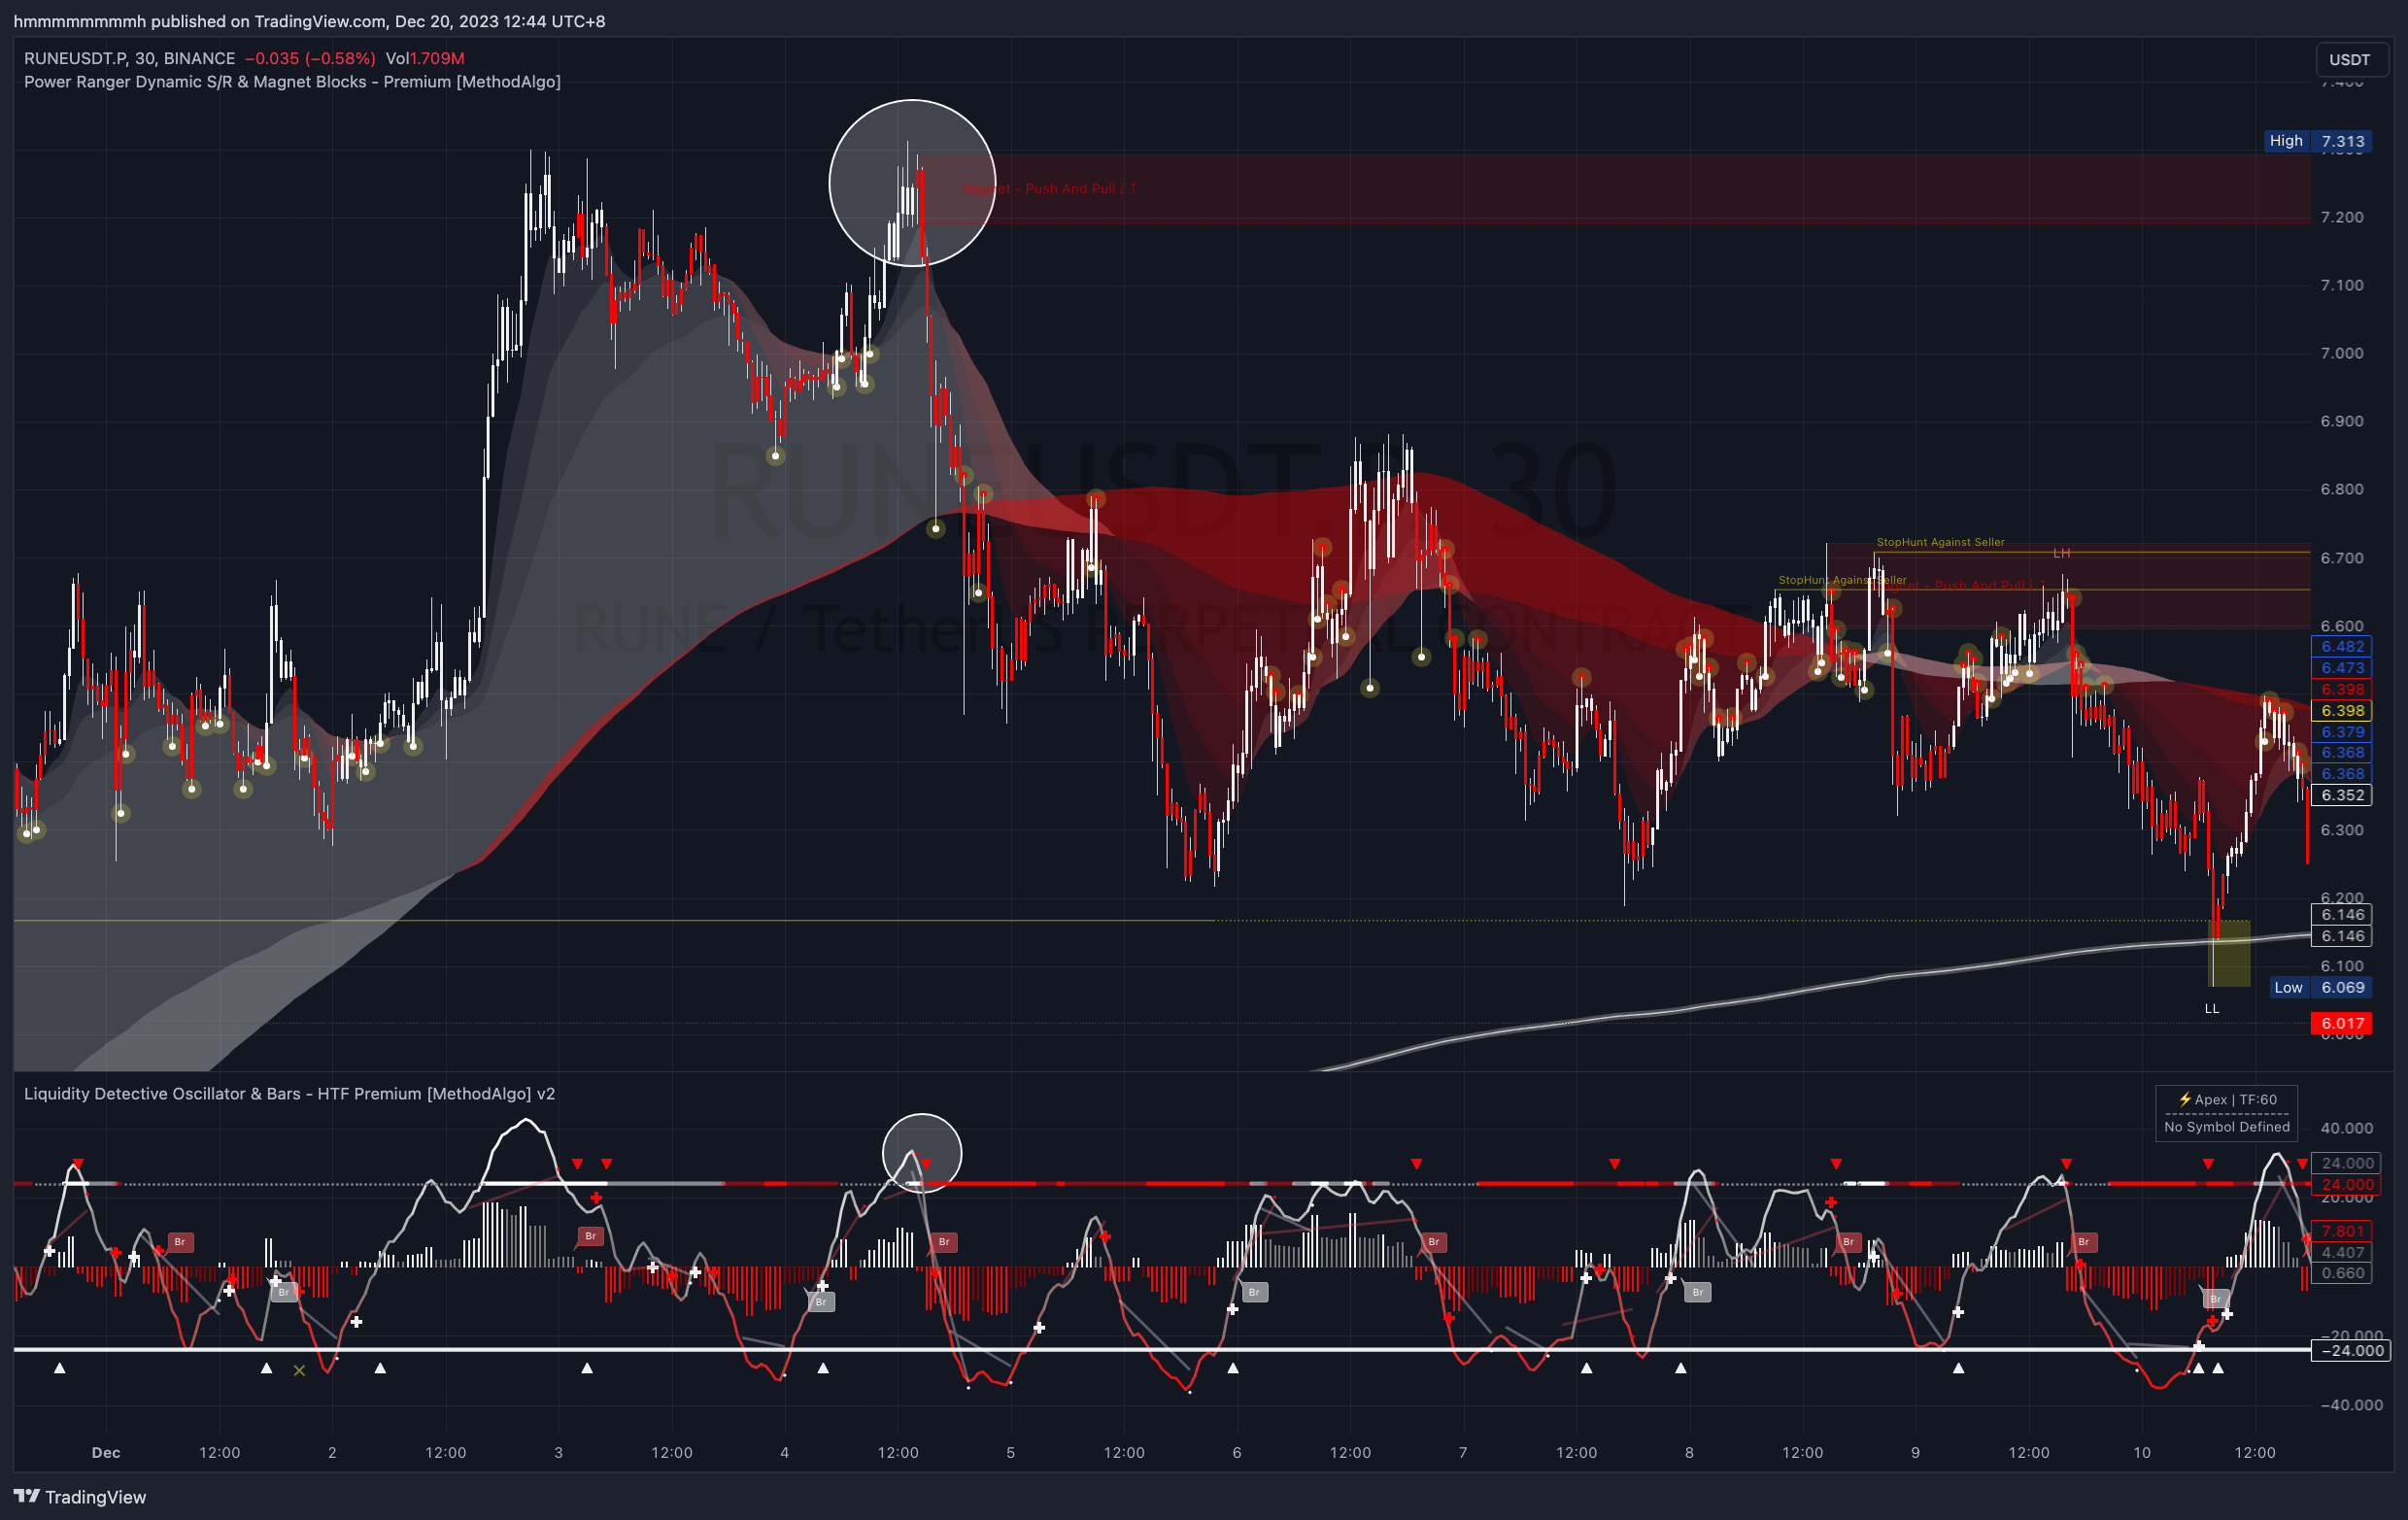 RUNEUSDT, 30-minute
Notes
- Since Liquidity Detective is an oscillator based on relative data, it cannot directly identify the primary trend and magnitude. Although trend lines are considered, they are only part of the overall weight. Therefore, reversal signals should only be applied in a trading plan where the trend has already been clearly analyzed and are mainly used for finding entry points.
- Like other signals in Liquidity Detective, the reversal signal also requires attention to signal confirmation. Refer to the section on Realtime vs Confirmed Signals
- In an uptrend, focus only on the white triangle signals; in a downtrend, focus only on the red triangle signals.
- When preparing to go long, only refer to the white triangle signals; when preparing to go short, only refer to the red triangle signals. Do not immediately decide to go long when seeing a white triangle signal, or to go short when seeing a red triangle signal.
- After a triangle signal appears, the candle is likely to move in the direction indicated by the triangle. However, since different-sized cycles exist in the market, triangle signals may appear frequently. Therefore, they are usually considered in the final step of analysis to maximize their effectiveness.
The engineers at MethodAlgo are proud of their work, but it's essential for you to understand that no indicator / algorithm can guarantee perfect success. Trading profits and losses are greatly influenced by the trader's psychology, knowledge, experience, and risk management.
The algorithmic interfaces we provide are all part of T.A.T.A. When trading in reality, traders should make their decision like T.A.T.A, considering various factors and signals from other tools to establish confluence system.
Any unclear explanations or errors in this tutorial? Please contact MethodAlgo's @Staff on the Discord Trading Terminal for corrections.