CycleWave
Concept
CycleWaves is an advanced market cycle analysis tool that combines three different momentum indices (RSI, Stochastic RSI, and the Pivot Mean Dev. Index) to create a new Composite Momentum Index Line. This tool provides traders with an overall view of market momentum trends and cycle biases.
CycleWaves breaks down market trends into multiple cycles. Utilizing the standardized Liquidity Detective framework, CycleWaves incorporates concepts of overbought, oversold, and midline levels, allowing further analysis through patterns such as double tops, double bottoms, and breakouts.
In addition to providing detailed cycle analysis, CycleWaves automatically plots support and resistance lines in the background and marks key breakout points, offering additional timing signals. Like other Liquidity Detective tools, CycleWaves analyzes data based on higher timeframes to ensure more consistent and reliable market insights.
Applications
- Composite momentum index analysis
- Trend and cycle analysis
- Entry and exit timing analysis
Interface
The CycleWaves interface is the most complex within Liquidity Detective, utilizing positions from other tools within the detective as reference points:
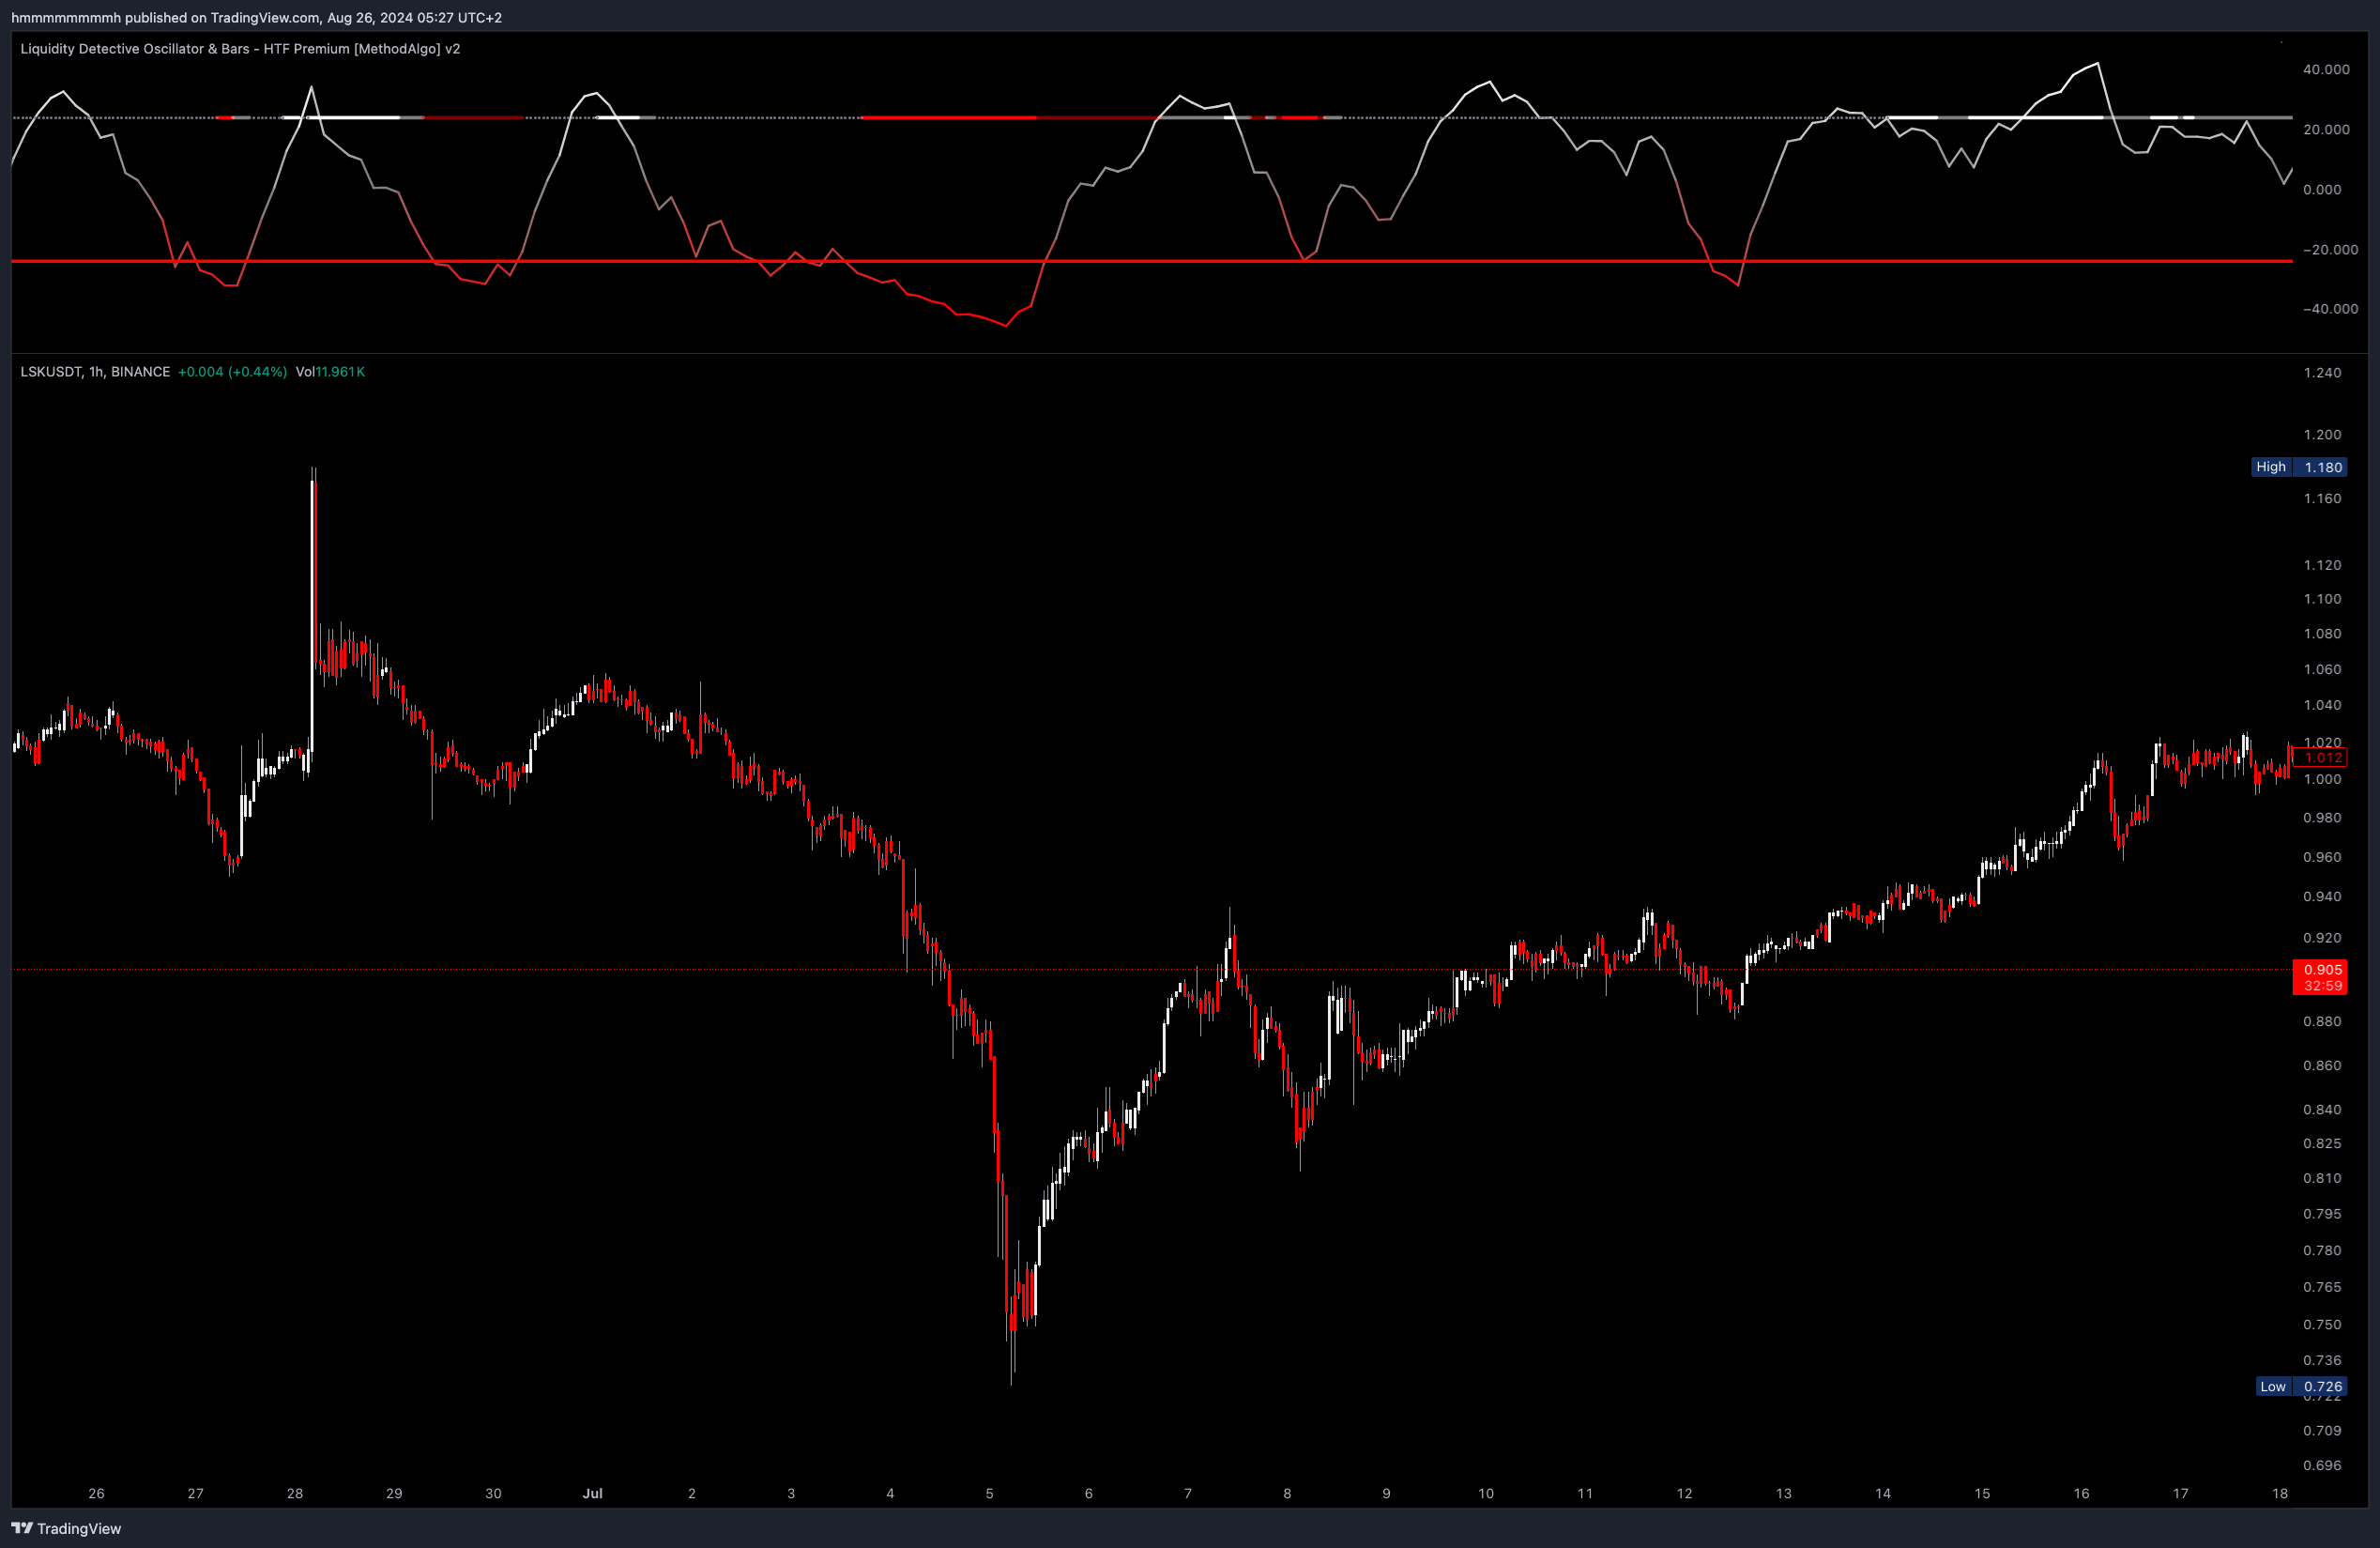
- Main Line: The gradient-colored CycleWave line
- Diagonal Lines: Semi-transparent support/resistance lines that appear alongside the main line
- Dots: Red or white dots marking when the main line breaks through the diagonal lines
- Overbought and Oversold Threshold: Two parallel lines at the top and bottom, which are the ADX and Trendline levels, serving as thresholds for the overbought and oversold regions of the main line
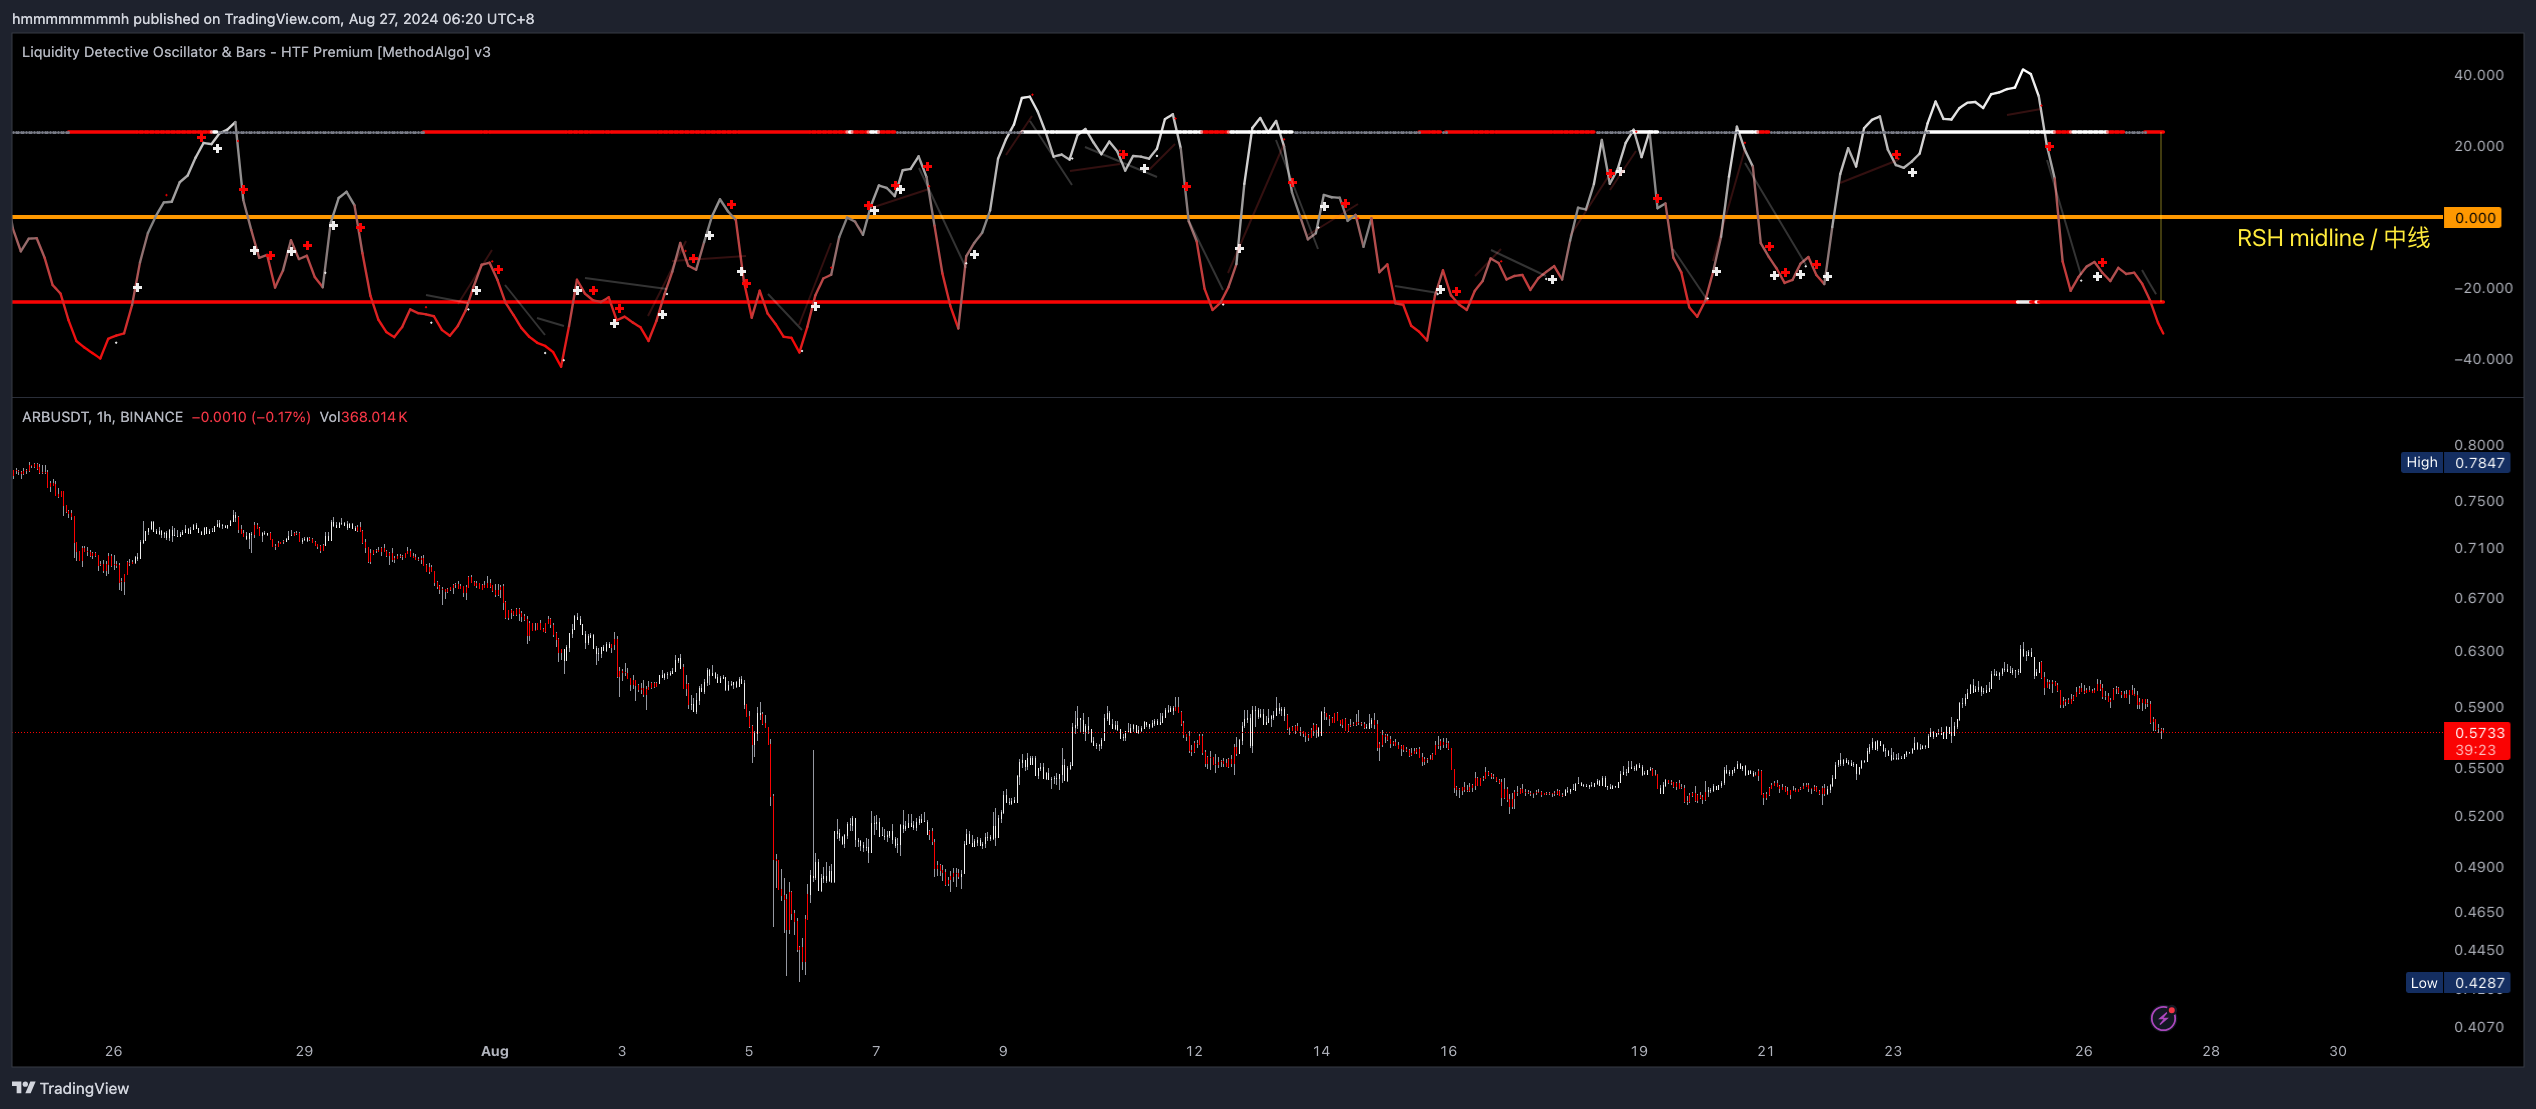
- Midline: The midpoint of RSH (0 point) also serves as the midline for CycleWaves. For clarity, RSH was turned off in the above chart, and an orange line was drawn as a marker.
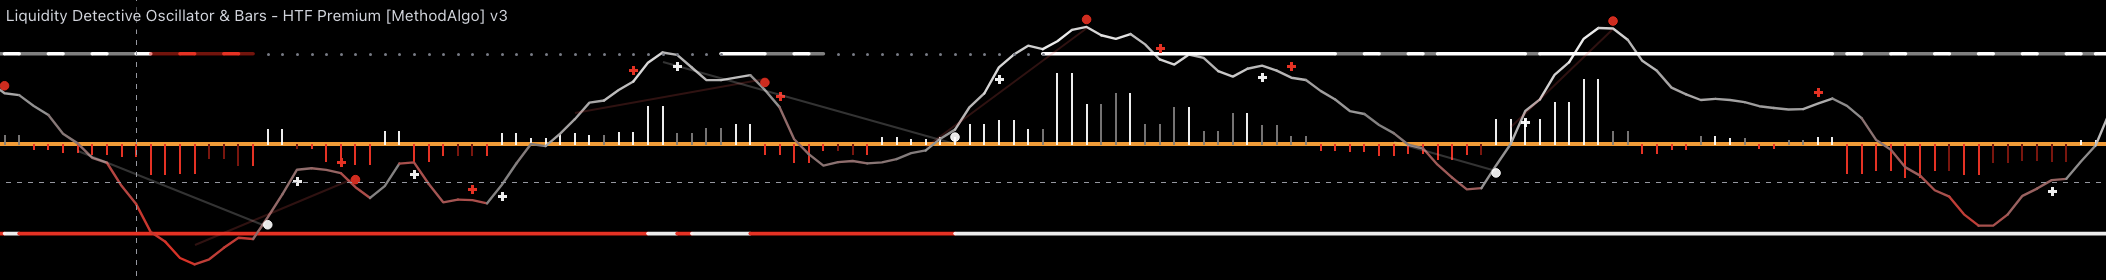
- Plus Signs (Enhanced Dot Breakouts): When trading volume aligns with price movement, Liquidity Detective prints a red or white “+” sign above or below the main line to reinforce the breakout signal's credibility.
Data TimeFrame
When the Autopilot TF feature is enabled (enabled by default), the detective automatically adjusts the data timeframe. If you want to customize CycleWave’s data timeframe, it’s recommended to set it to at least three times the current chart's time frame to expand the cycle dimension and obtain more consistent data.
Data Timeframe used when Autopilot TF is ON
| Chart | Data Timeframe |
|---|---|
| 1m | 10m |
| 3m | 15m |
| 5m | 30m |
| 10m | 45m |
| 15m | 1h |
| 30m | 2h |
| 45m | 4h |
| 1h | 4h |
| 2h | 8h |
| 3h | 1d |
| 4h | 1d |
| 6h | 12h |
| 12h | 1d |
| 1d | 3d |
Examples
Midline Crosses and • and + Markers
The CycleWaves main line reflects the relative strength cycle of market bullish and bearish turnover. The following markers provide clearer directional signals:
• Dot and + Plus Sign Markers
The dot marker indicates that the CycleWave main line has broken through the support or resistance (semi-transparent) line monitored by the Liquidity Detective, which may signal a reversal of the main line, similar to a price breakout, though many false breakouts can occur.
Therefore, the plus sign marker is introduced to validate breakout signals. If a plus sign marker appears after a dot, it suggests that funds are flowing in the direction of the breakout, supporting the trend.
Midline
The midline of CycleWave represents the force dominating the current trend. Since the midline is the 0 point of Liquidity Detective, the midpoint of RSH is used as the midline for CycleWave, as shown below:
- When CycleWave breaks above the midline, it indicates
bullish dominance, suggesting the price should continue to rise. - When CycleWave breaks below the midline, it indicates
bearish dominance, suggesting the price should continue to fall.
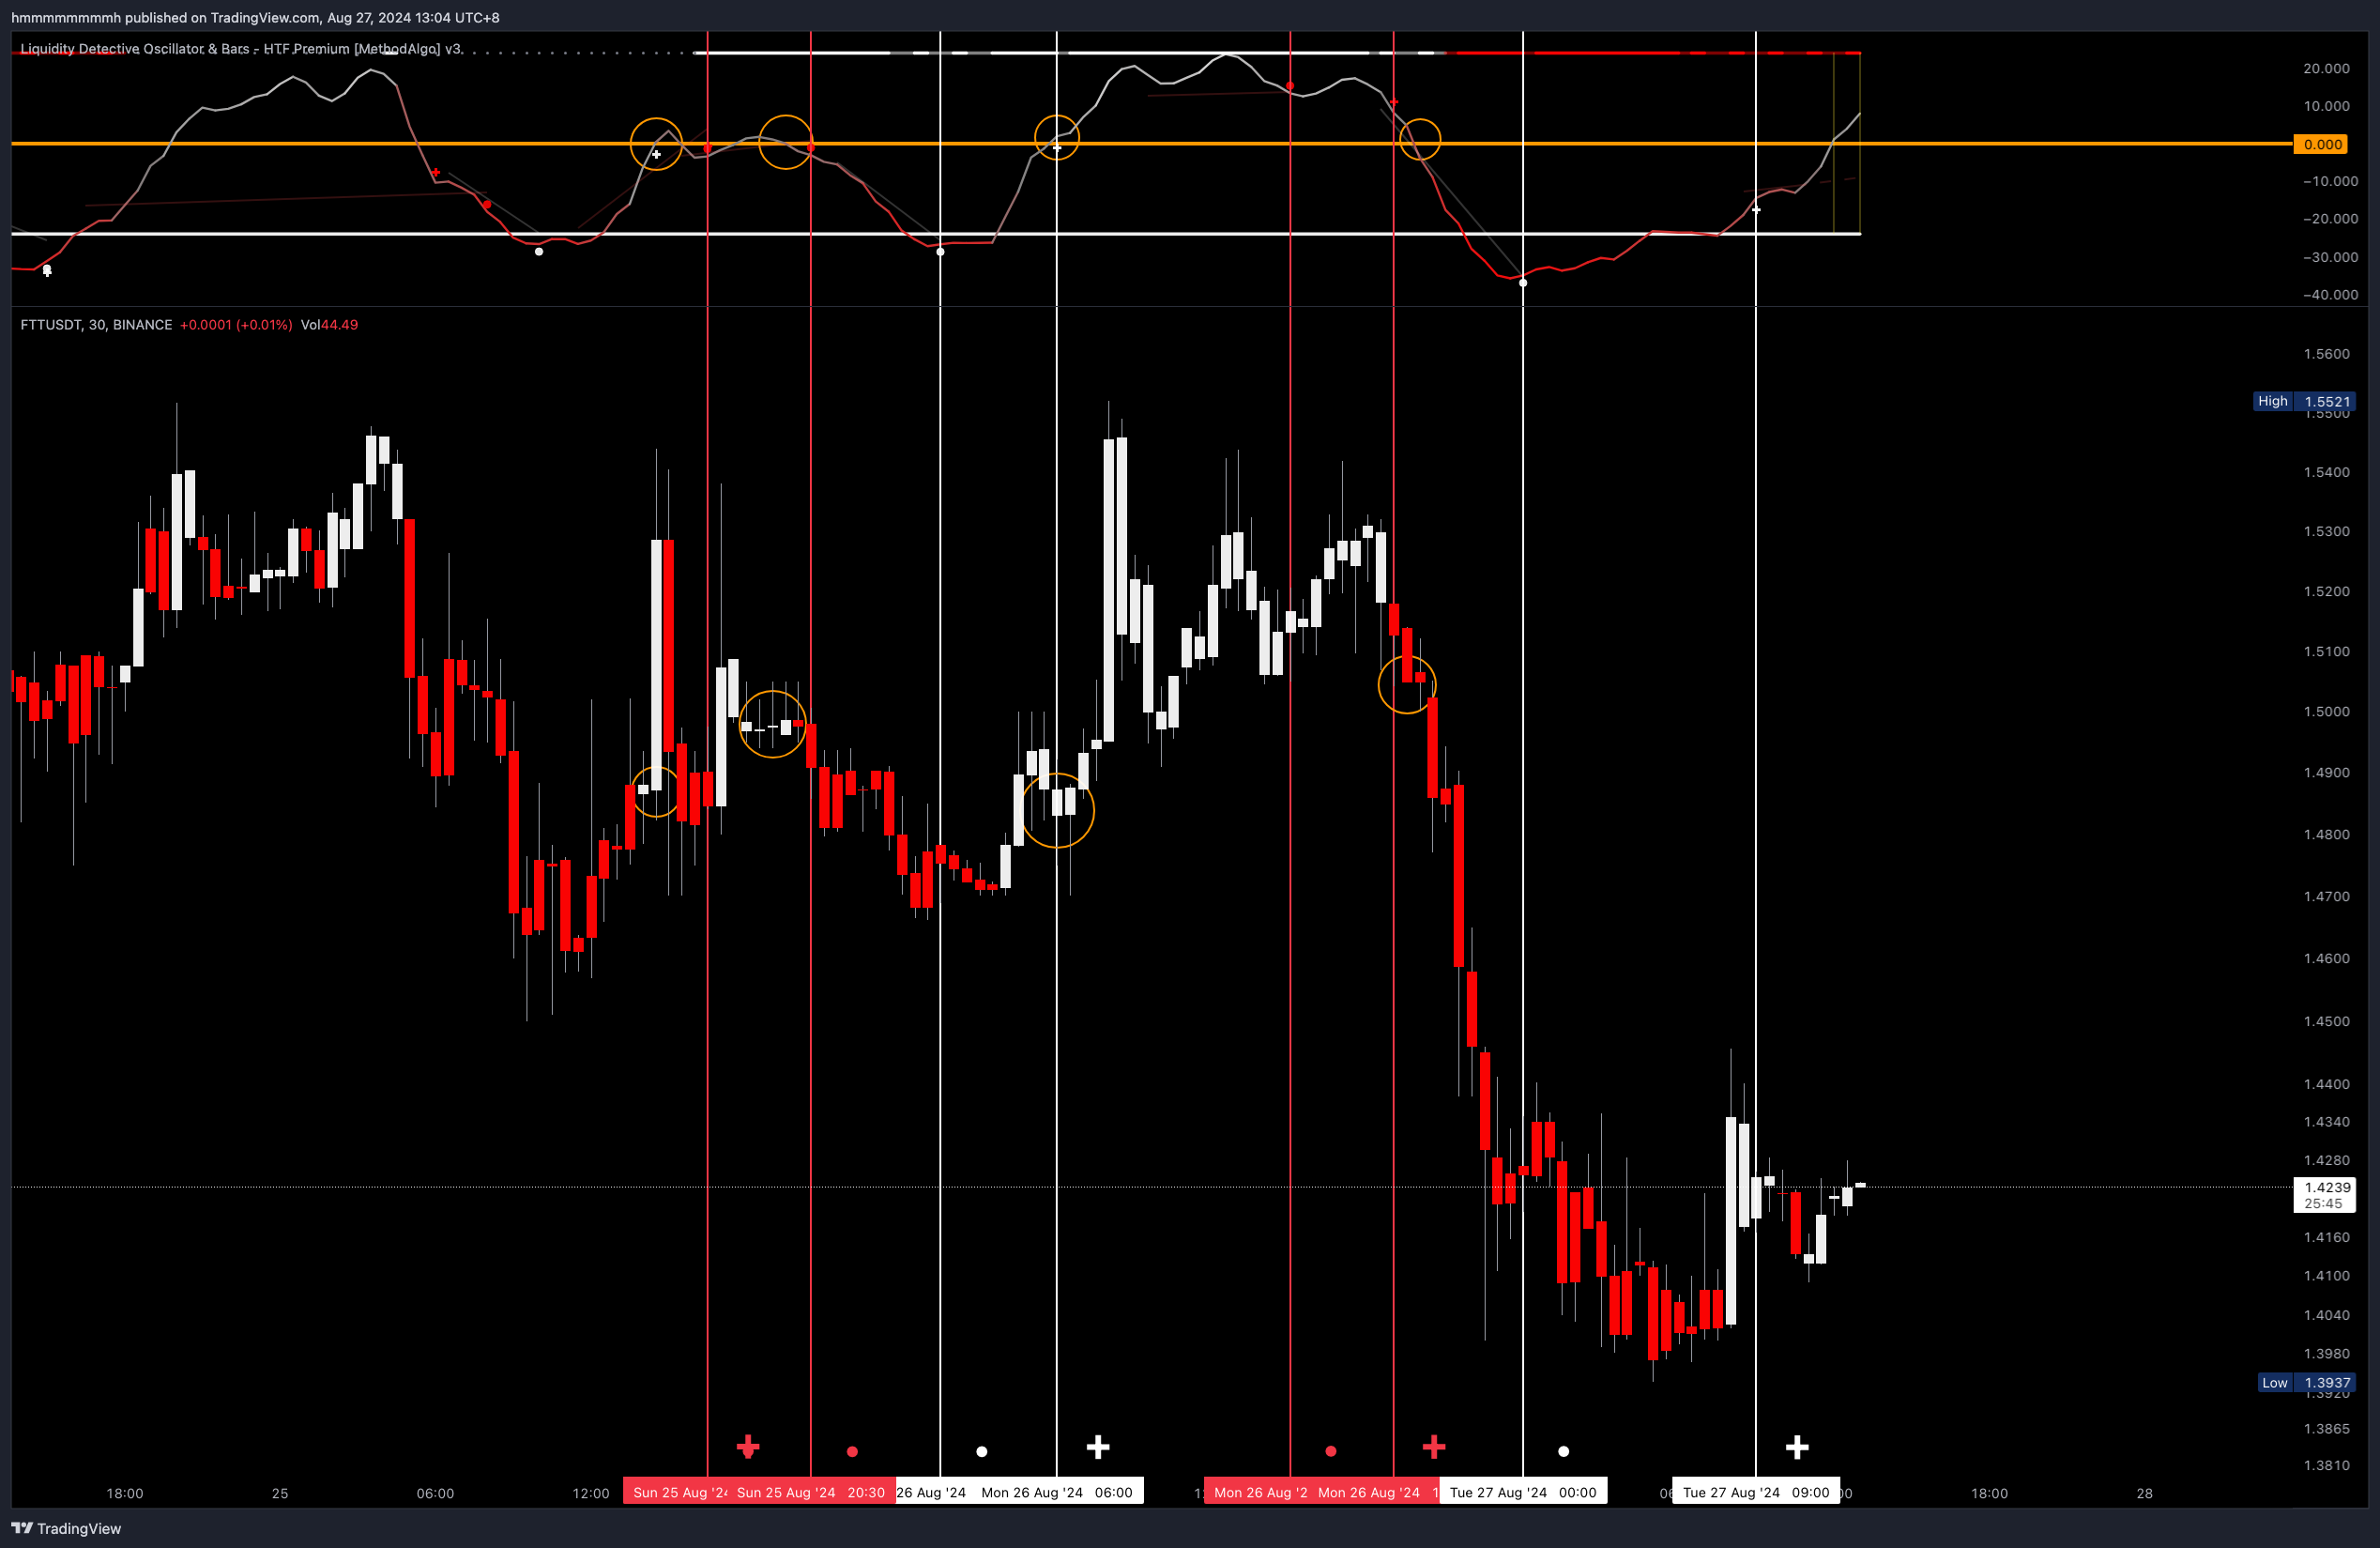 Example of dots, plus signs, and midline interactions
Overbought and Oversold Regions
The concepts of overbought and oversold regions are similar to RSI’s overbought and oversold concepts. When the main line enters the overbought or oversold region, it indicates that the price has exceeded its previous range, undergoing relatively excessive upward or downward movement. This state provides the following information:
- Confirms the strength of one side
- Shifts the fluctuation midline (Mean)
- Breaks through support or resistance
- Intensifies one side's panic and the other side's exuberance
Identifying Reversal Opportunities
The overbought and oversold threshold lines act as relative resistance and support for fluctuations and cycles, usually marking the top/bottom of a cycle when the main line is rejected at these levels. If dot and plus sign markers appear, they can signal an early reversal opportunity. Of course, you can use signals from other tools to support or negate this predictive bias.
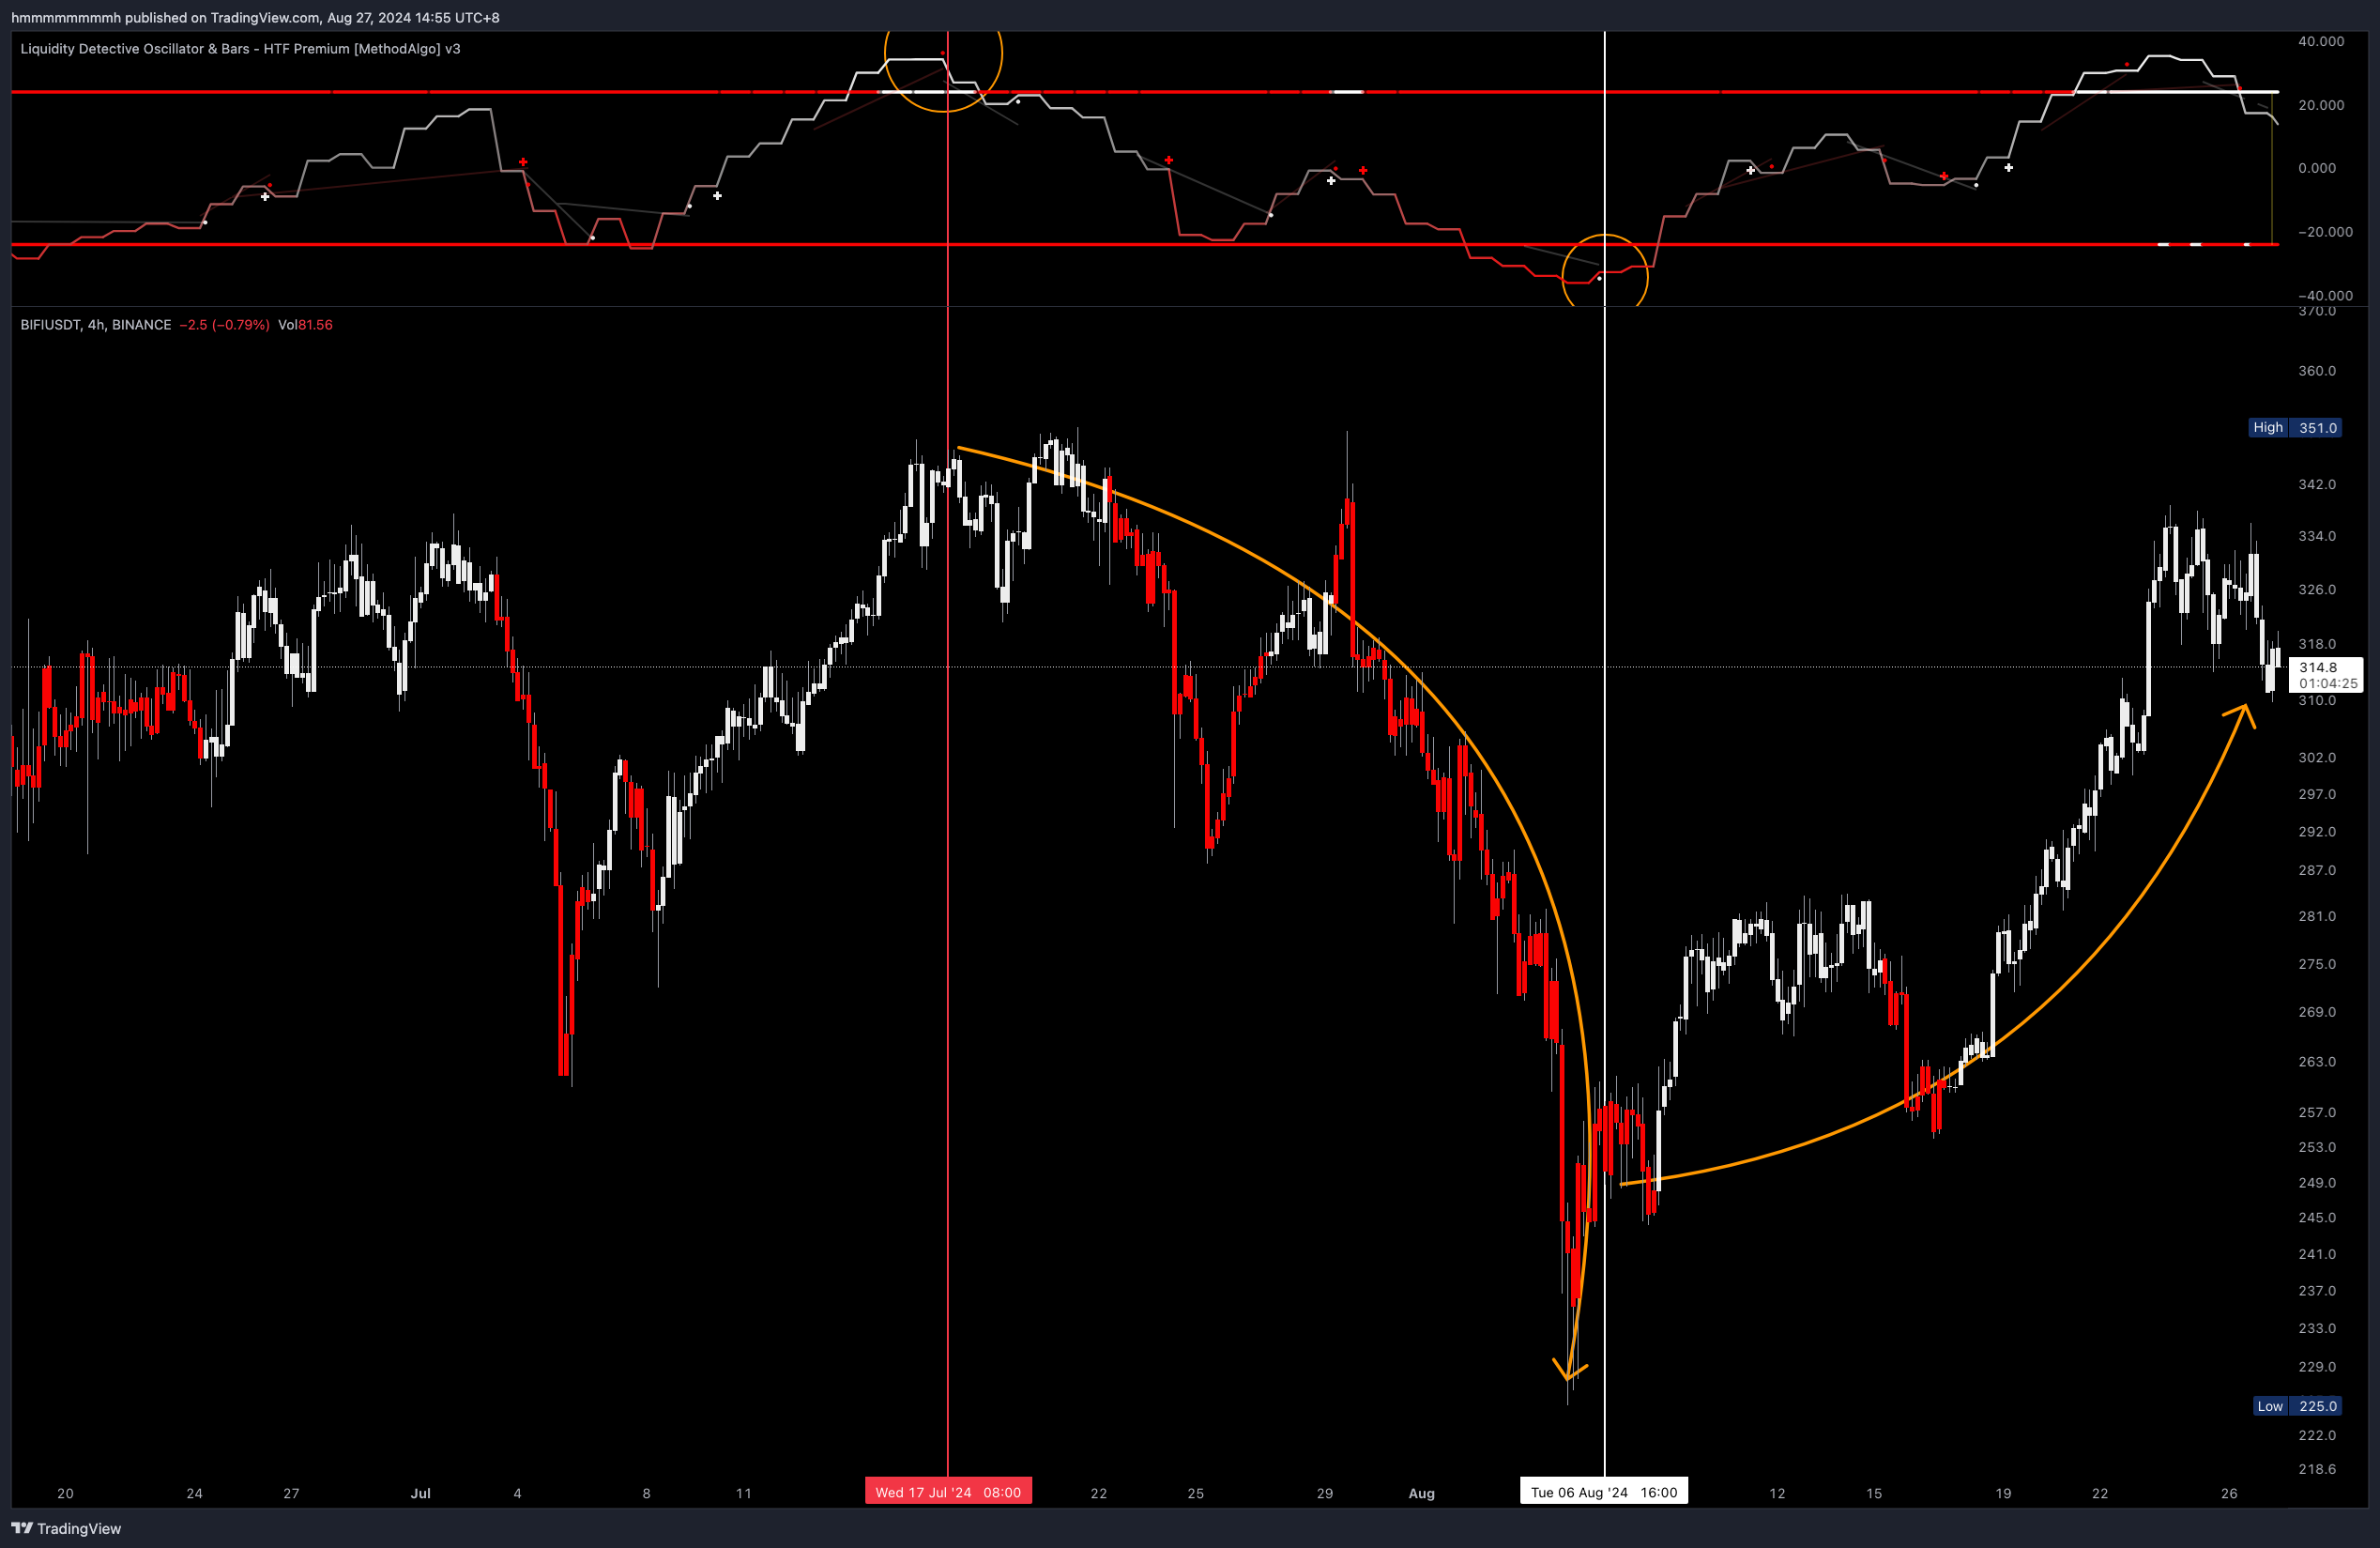 Price movement after dot breakout in overbought and oversold zones
Entry Opportunities
For strategies such as buying during an uptrend, selling during a downtrend, or range trading during consolidation, in addition to using Power Ranger tools to find structural support and resistance as entry points or using Grim Reaper to identify liquidity gaps for entry, using the timing when CycleWave touches the overbought or oversold area as an entry point can also be a good idea, as this timing represents the low point of the cycle. Simply put, it's the Dip.
It's important to note the difference between entering from within the overbought/oversold area and after returning from the overbought/oversold area. The former carries greater risk but offers a better entry price, while the latter misses some profit space but is safer because the main line has returned from the overbought/oversold area.
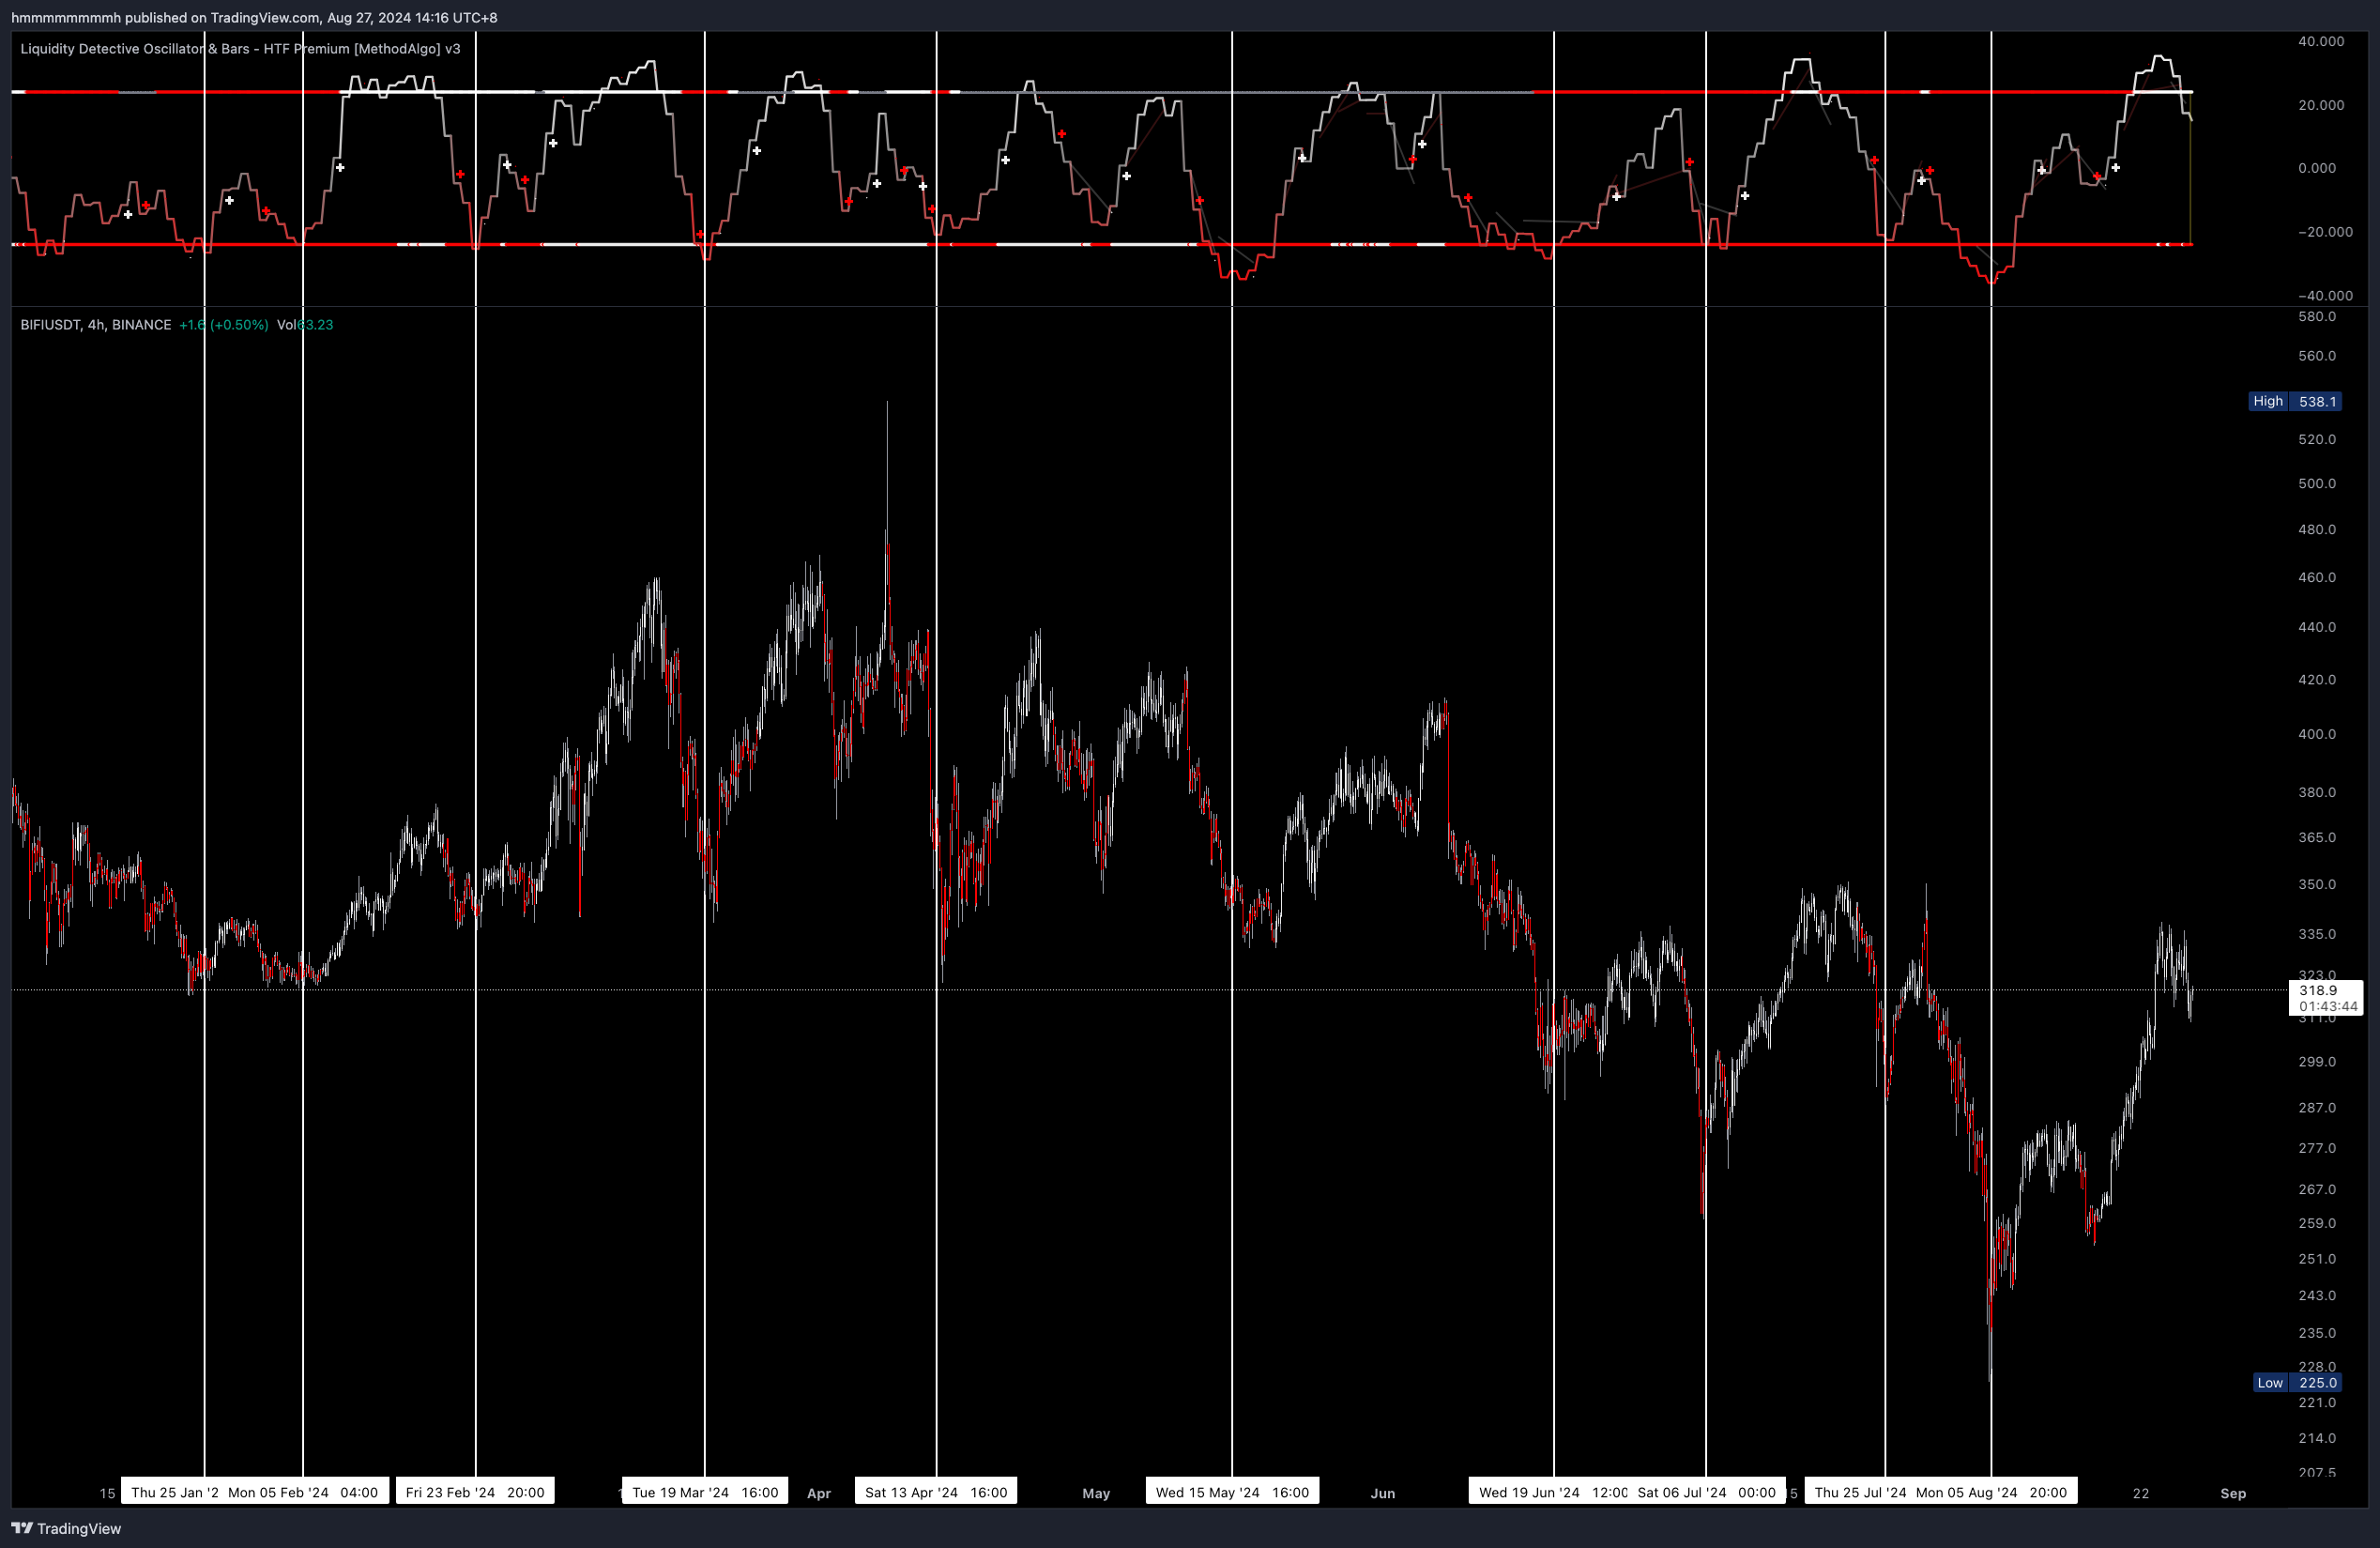 Consolidation trend, marking Dip opportunities for long entry when CycleWave touches the oversold line
Support and Resistance
The points in time before the price enters the overbought or oversold area can usually serve as short-term support or resistance.
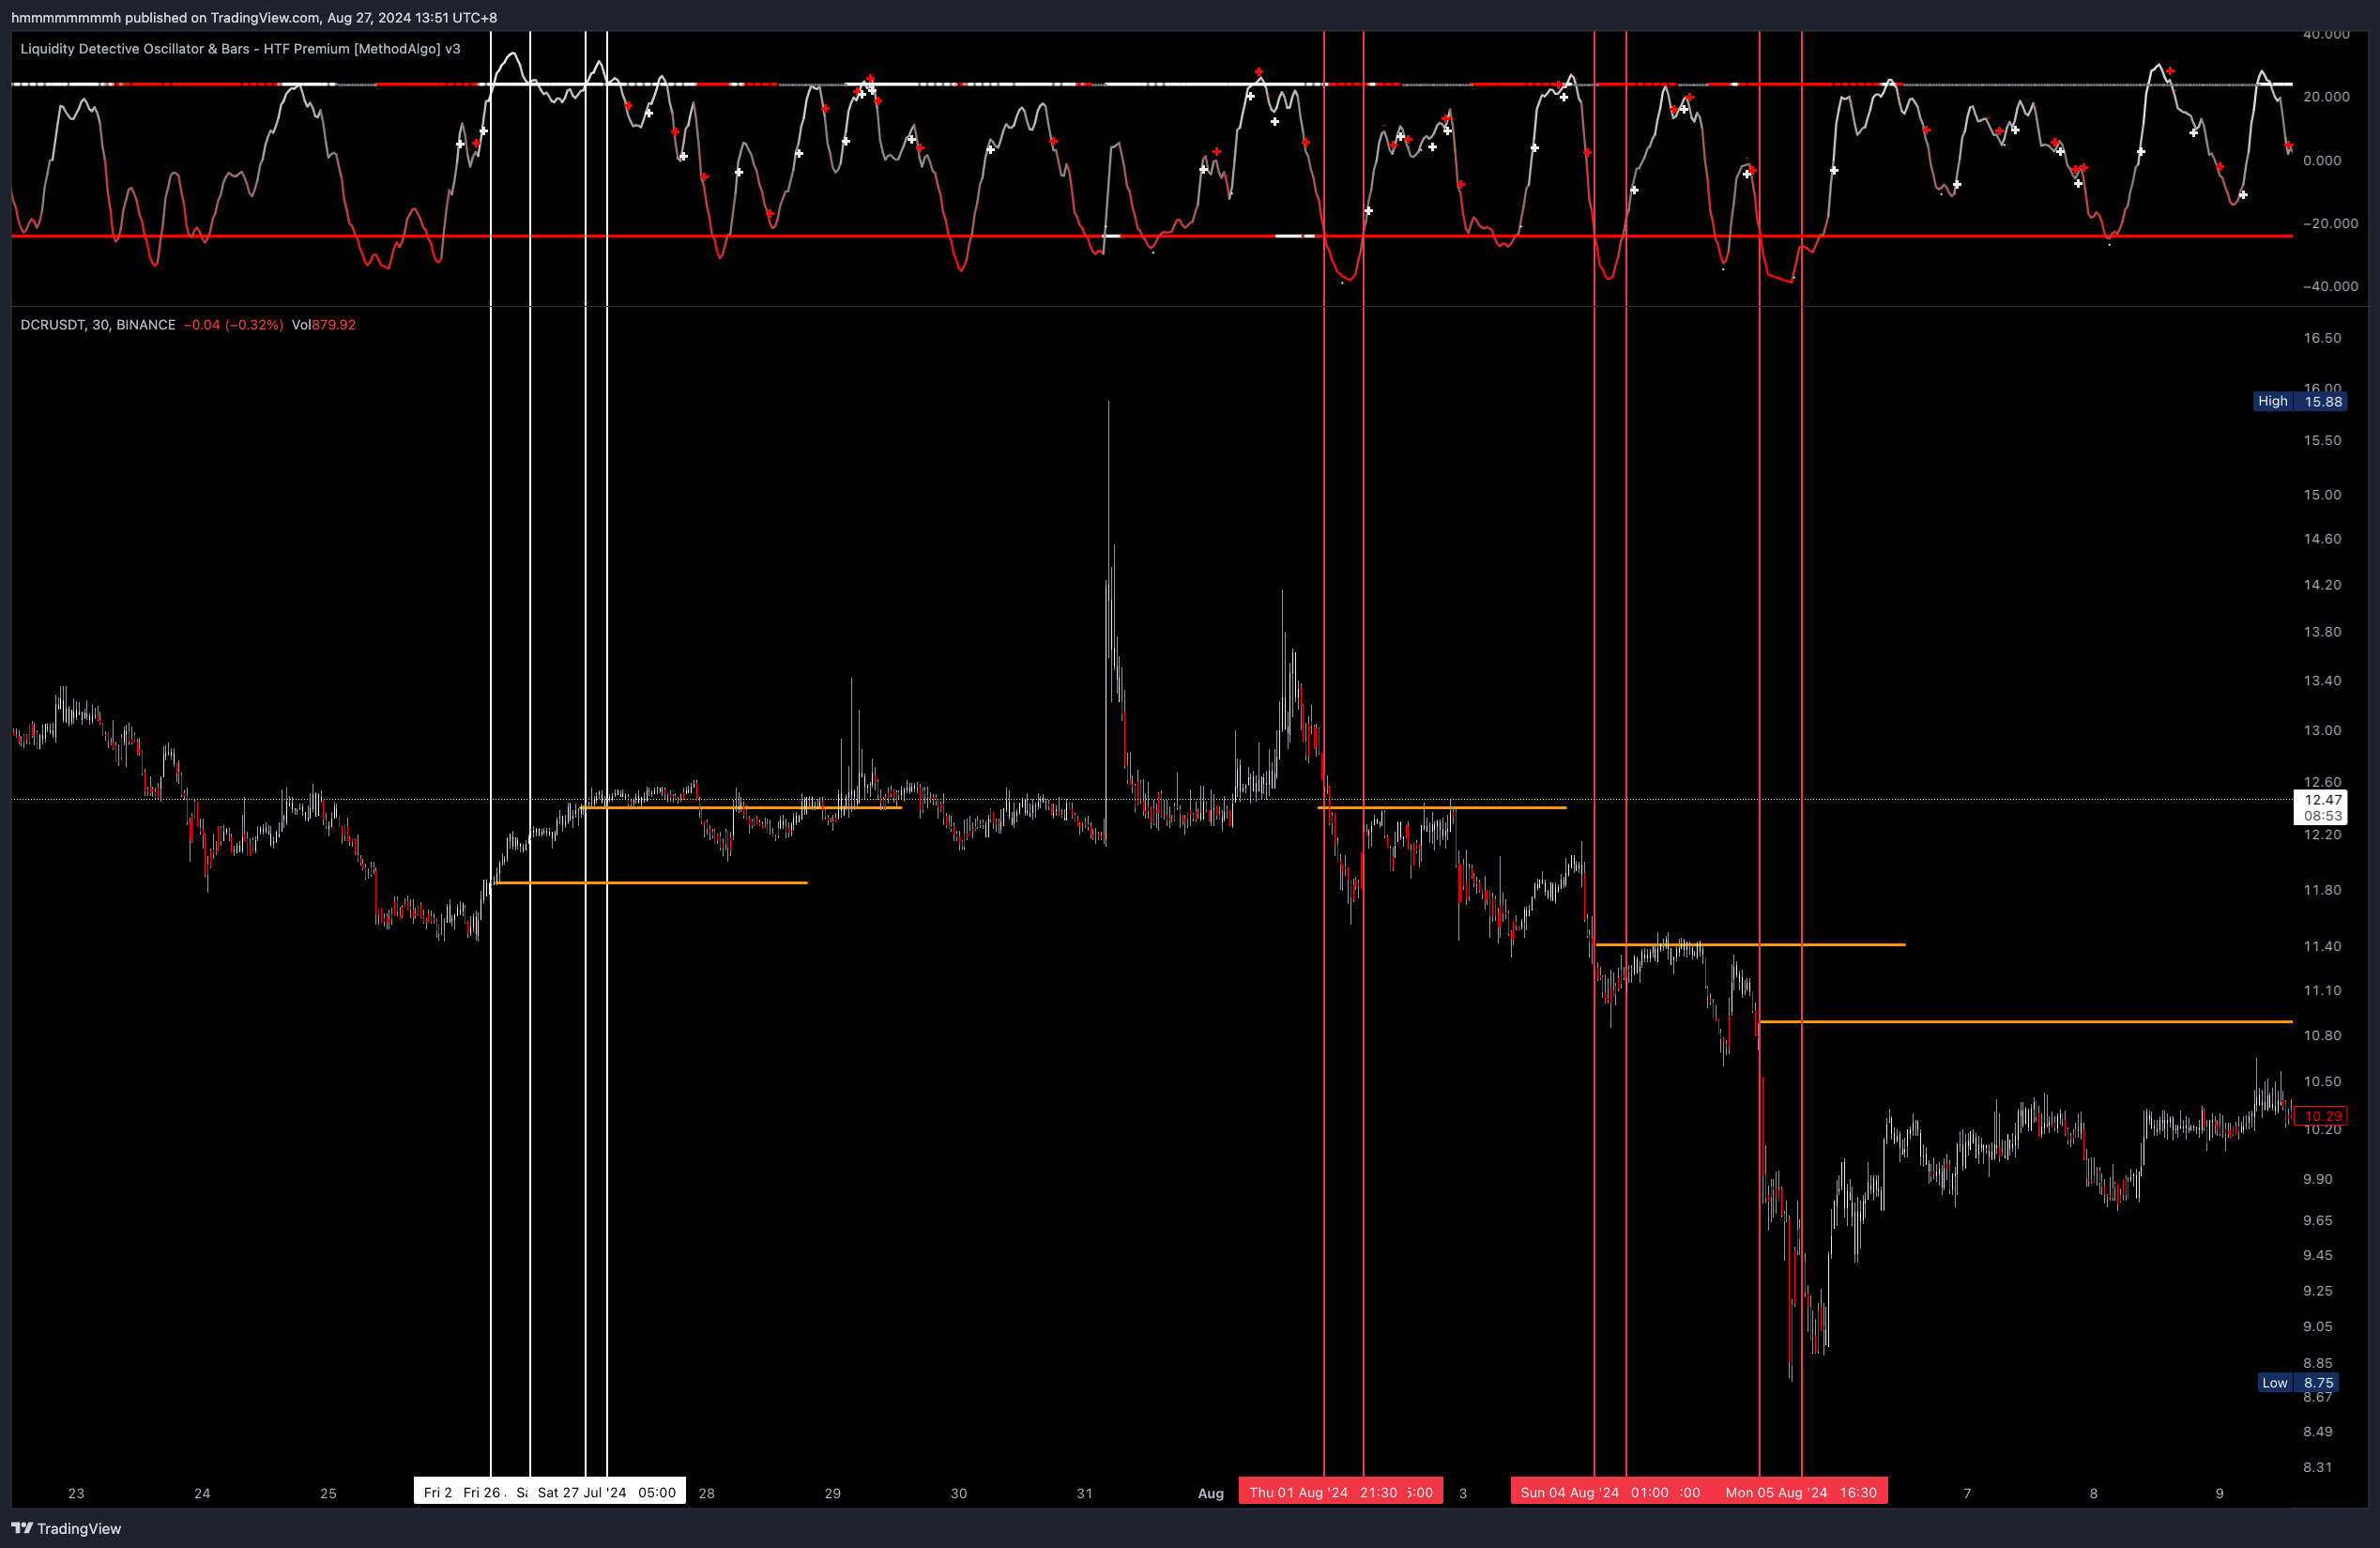 Marking support/resistance based on entry into the overbought/oversold area
Remarks
- CycleWaves uses relative data, designed to map short-term cycle tops and bottoms, helping to judge small cycle trends, but it cannot predict the magnitude of price movements.
- After a significant drop in strength or a spike, paired with CycleWave analysis, reverse trading can be considered.
- The main line may re-enter after leaving the overbought/oversold area, so cautious analysis is required.
- Strong breakout signals from the combination of dots and plus signs can still result in false breakouts.
- CycleWave uses HTF data; pay attention to the freeze signals in the yellow line interval when using it. See Realtime vs Confirmed Signals
- CycleWave is a trend strength cycle analysis tool, not a main trend tool like trendlines. Do not confuse the concepts.
The engineers at MethodAlgo are proud of their work, but it's essential for you to understand that no indicator / algorithm can guarantee perfect success. Trading profits and losses are greatly influenced by the trader's psychology, knowledge, experience, and risk management.
The algorithmic interfaces we provide are all part of T.A.T.A. When trading in reality, traders should make their decision like T.A.T.A, considering various factors and signals from other tools to establish confluence system.
Any unclear explanations or errors in this tutorial? Please contact MethodAlgo's @Staff on the Discord Trading Terminal for corrections.