Background Color
Concept
Within the MethodAlgo toolkit, BG Colors might seem subtle, but they are one of the elements closest to buy and sell signals. In the Liquidity Detective, BG Colors reflect the current momentum trend calculated using the RSH algorithm.
BG Colors in the Liquidity Detective are generated through a relative strength algorithm. Although they appear in the same form as Apex BG Colors, they are not solely dependent on RSI calculations. This algorithm filters out minor fluctuations in the trend, helping traders stay in the trend longer and avoid missing opportunities due to hesitation.
Use Cases
- Entering or exiting trades
- Preemptive take profits and stop losses
- Increasing confidence in holding positions
- Minor Trend identification
Interface
BG Colors are a visual element of the Liquidity Detective indicator. A semi-transparent white background indicates an uptrend, while a semi-transparent red background indicates a downtrend.
Examples
Trend-Following Signals
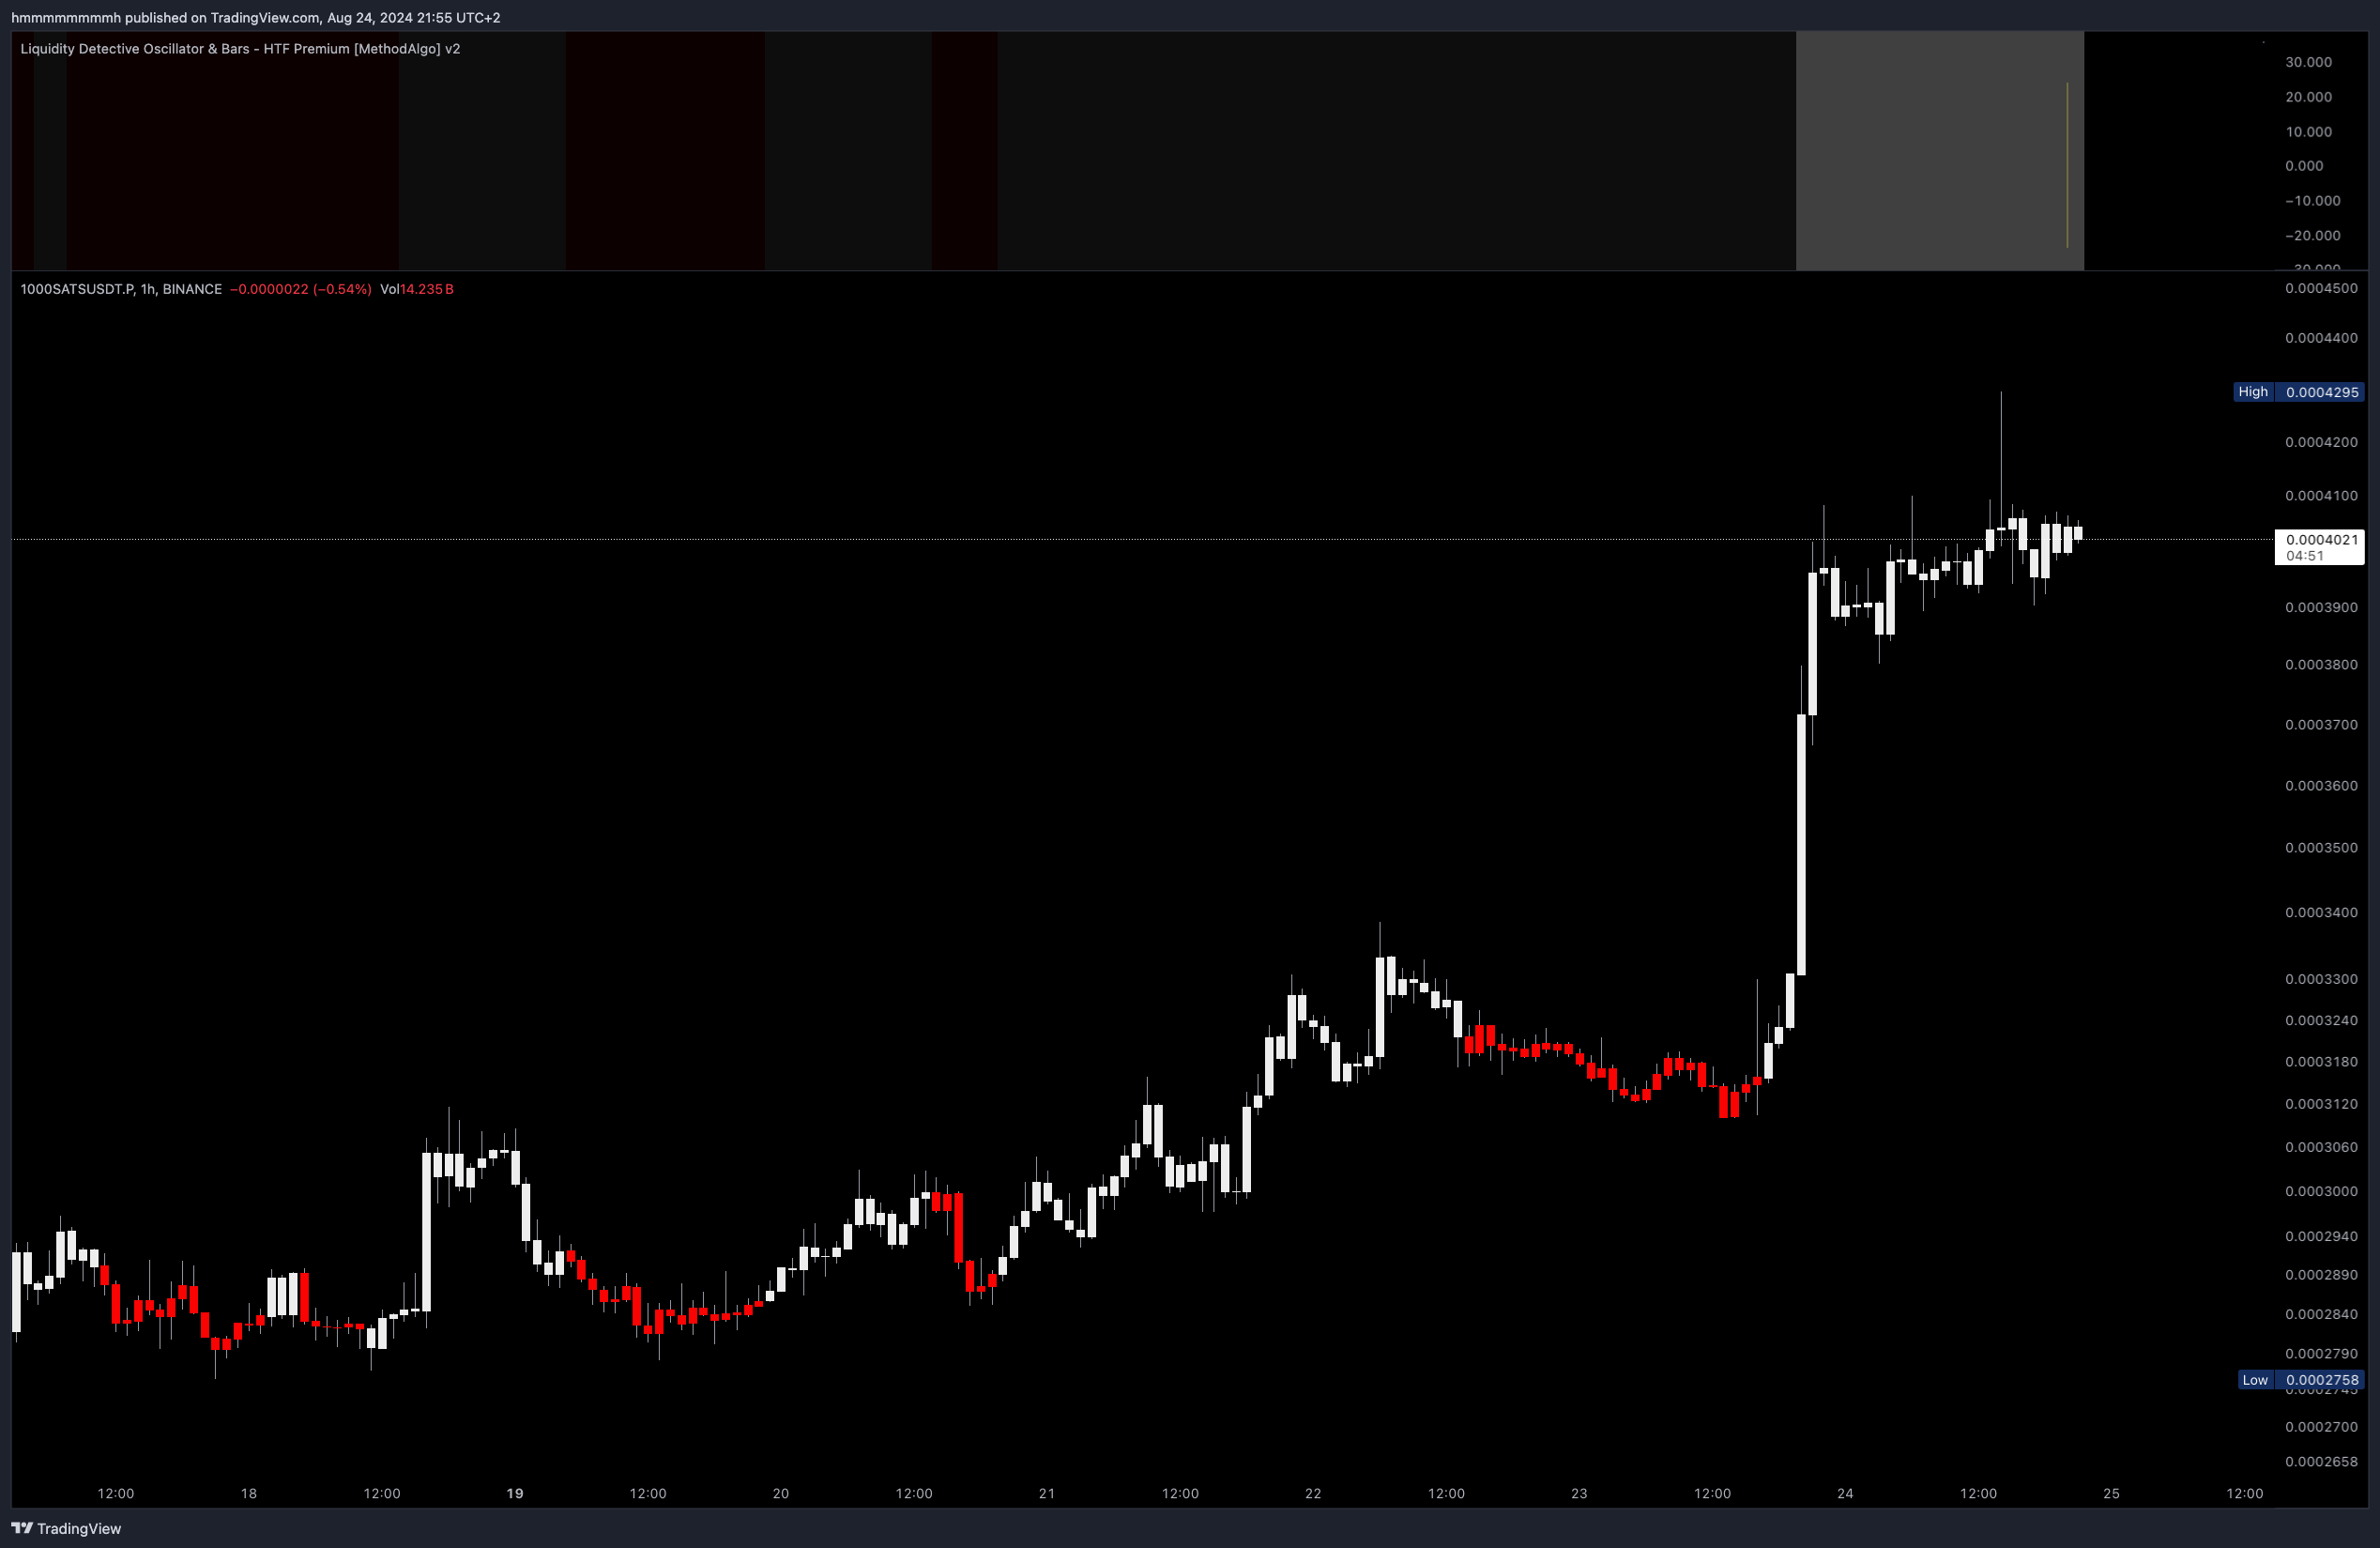
BG Colors provide trend-following signals. A red background turning white usually signals a price increase, while a white background turning red indicates a price decrease. However, note that when the BG Color changes, the RSH bars should match the BG Color for confirmation.
The following chart shows how BG Colors provide better continuity compared to RSH bars and how they filter out minor fluctuations.
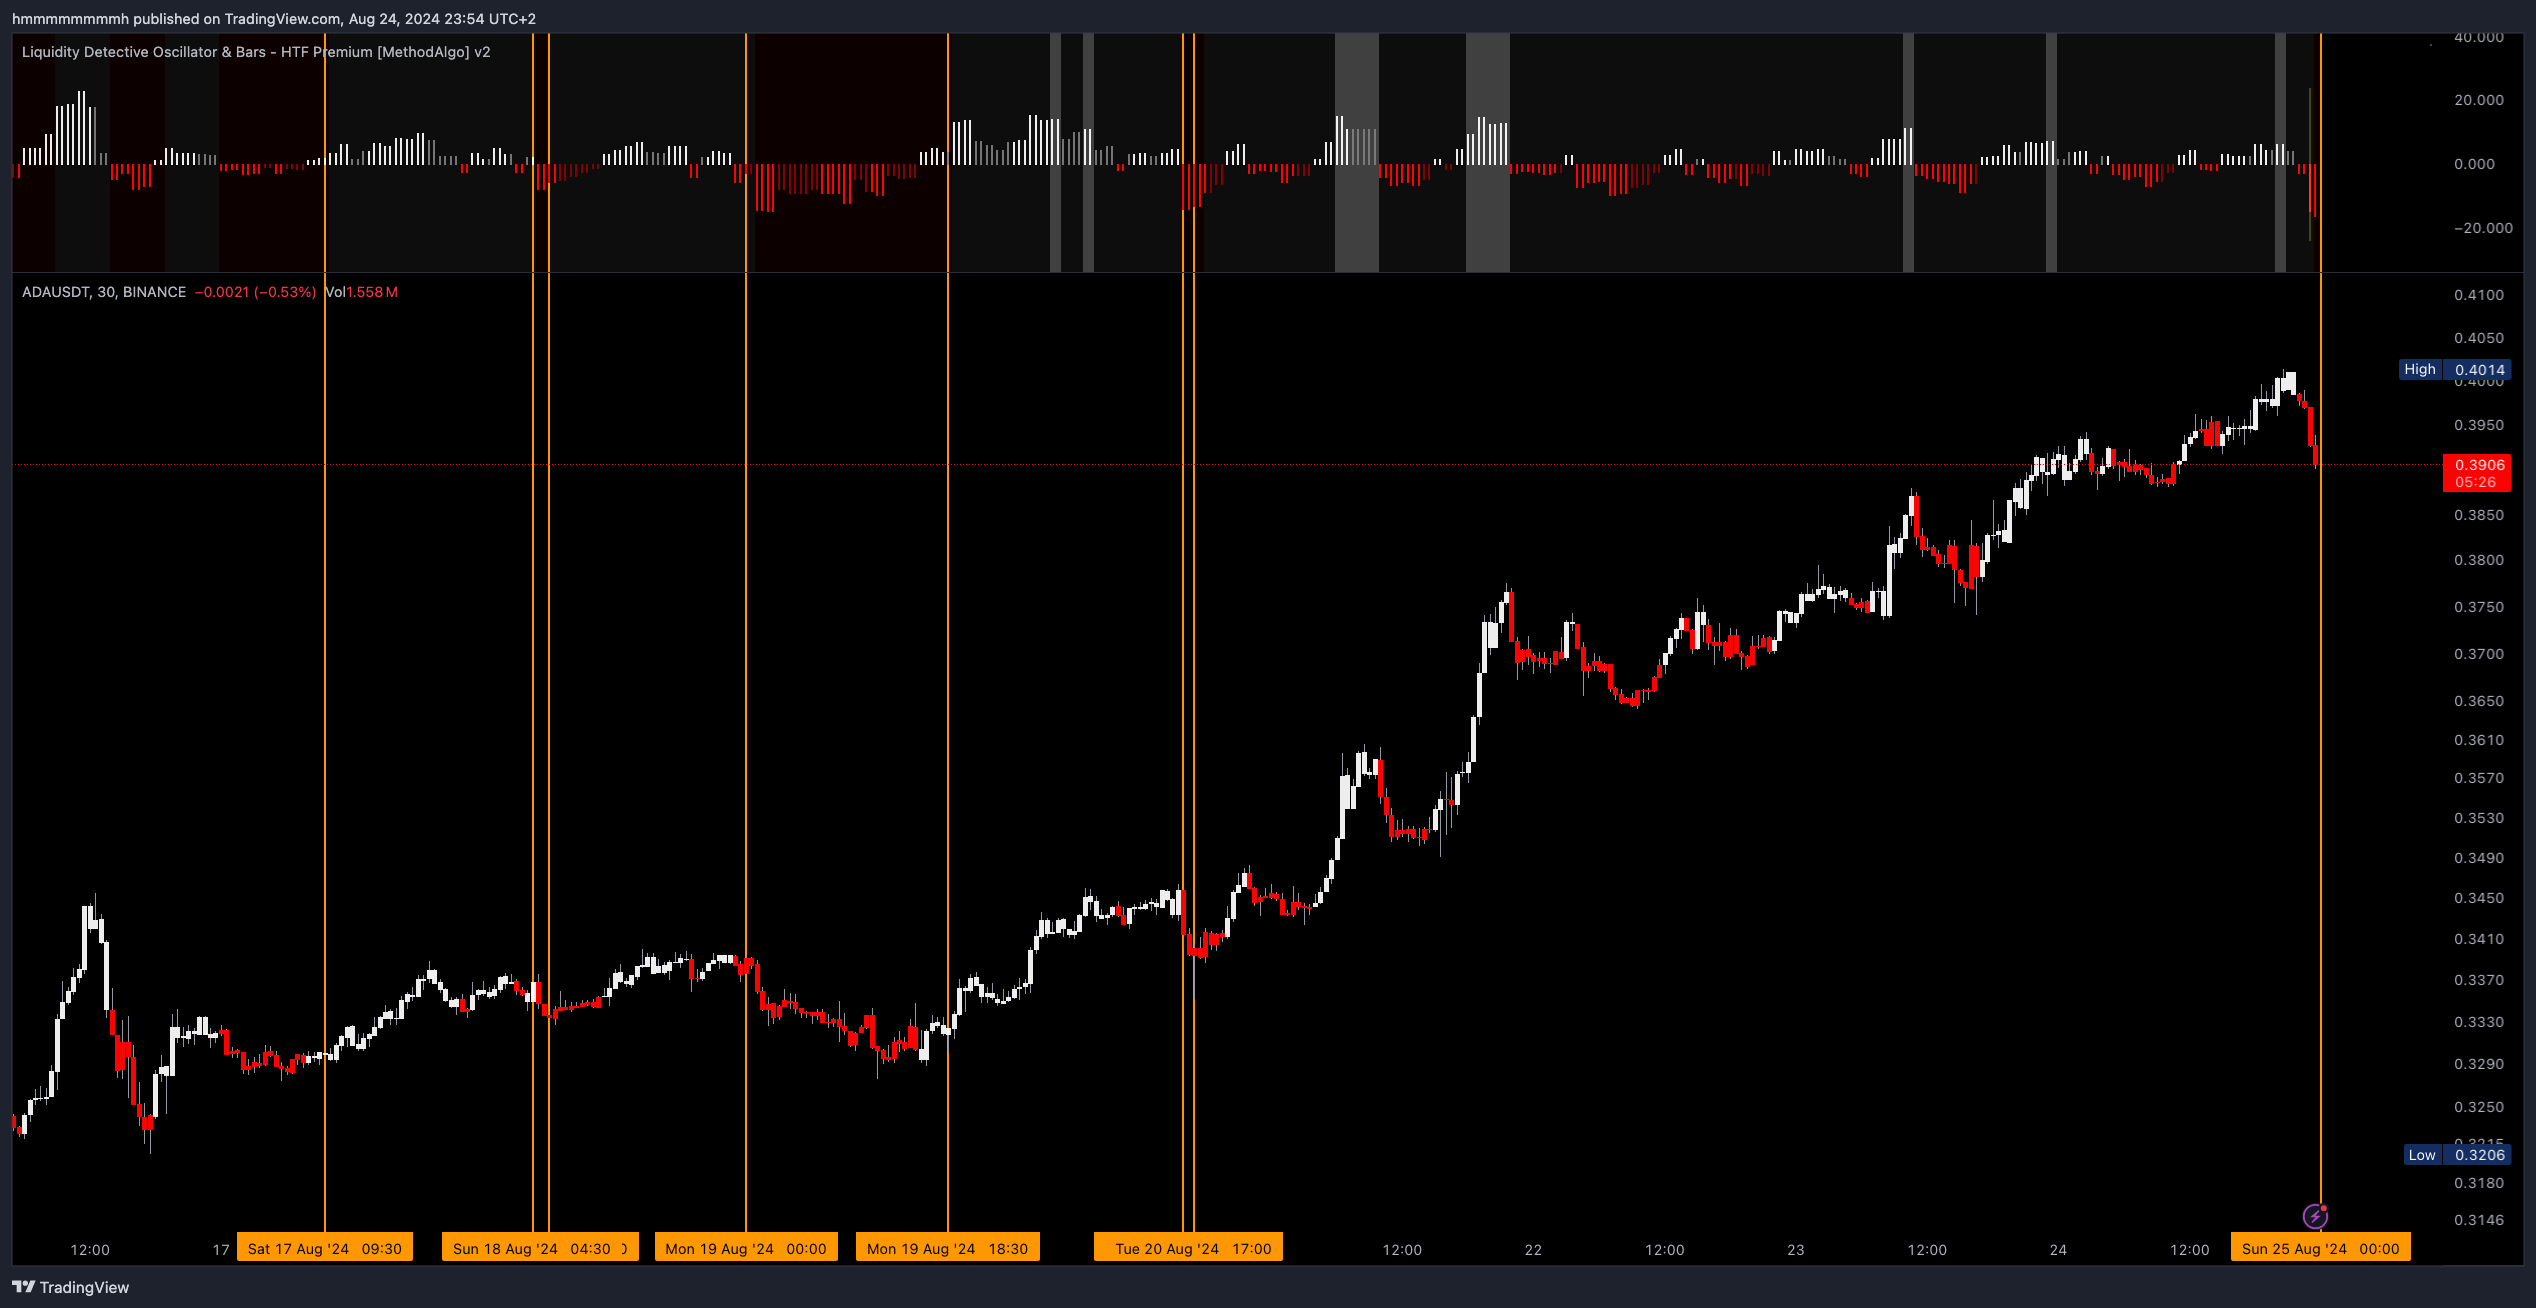 ADAUSDT, 30m
Low Volatility Risk
As BG Colors are calculated using a relative algorithm, they offer good continuity within a trend, helping traders stay in the trend. However, their effectiveness may be limited during consolidation or when the market has low volatility.
Solution: In low-volatility conditions, switching to a higher time frame can filter out minor fluctuations. Combining pattern analysis or other MethodAlgo tools for composite analysis can help break through ambiguous situations.
The chart below shows the performance of MATICUSDT across 2 different timeframes:
- Left: In the 15m chart, the consolidation within the green box area leads to frequent changes in BG Colors.
- Right: In the 1-hour chart, these minor fluctuations are filtered out, resulting in a continuous white background.
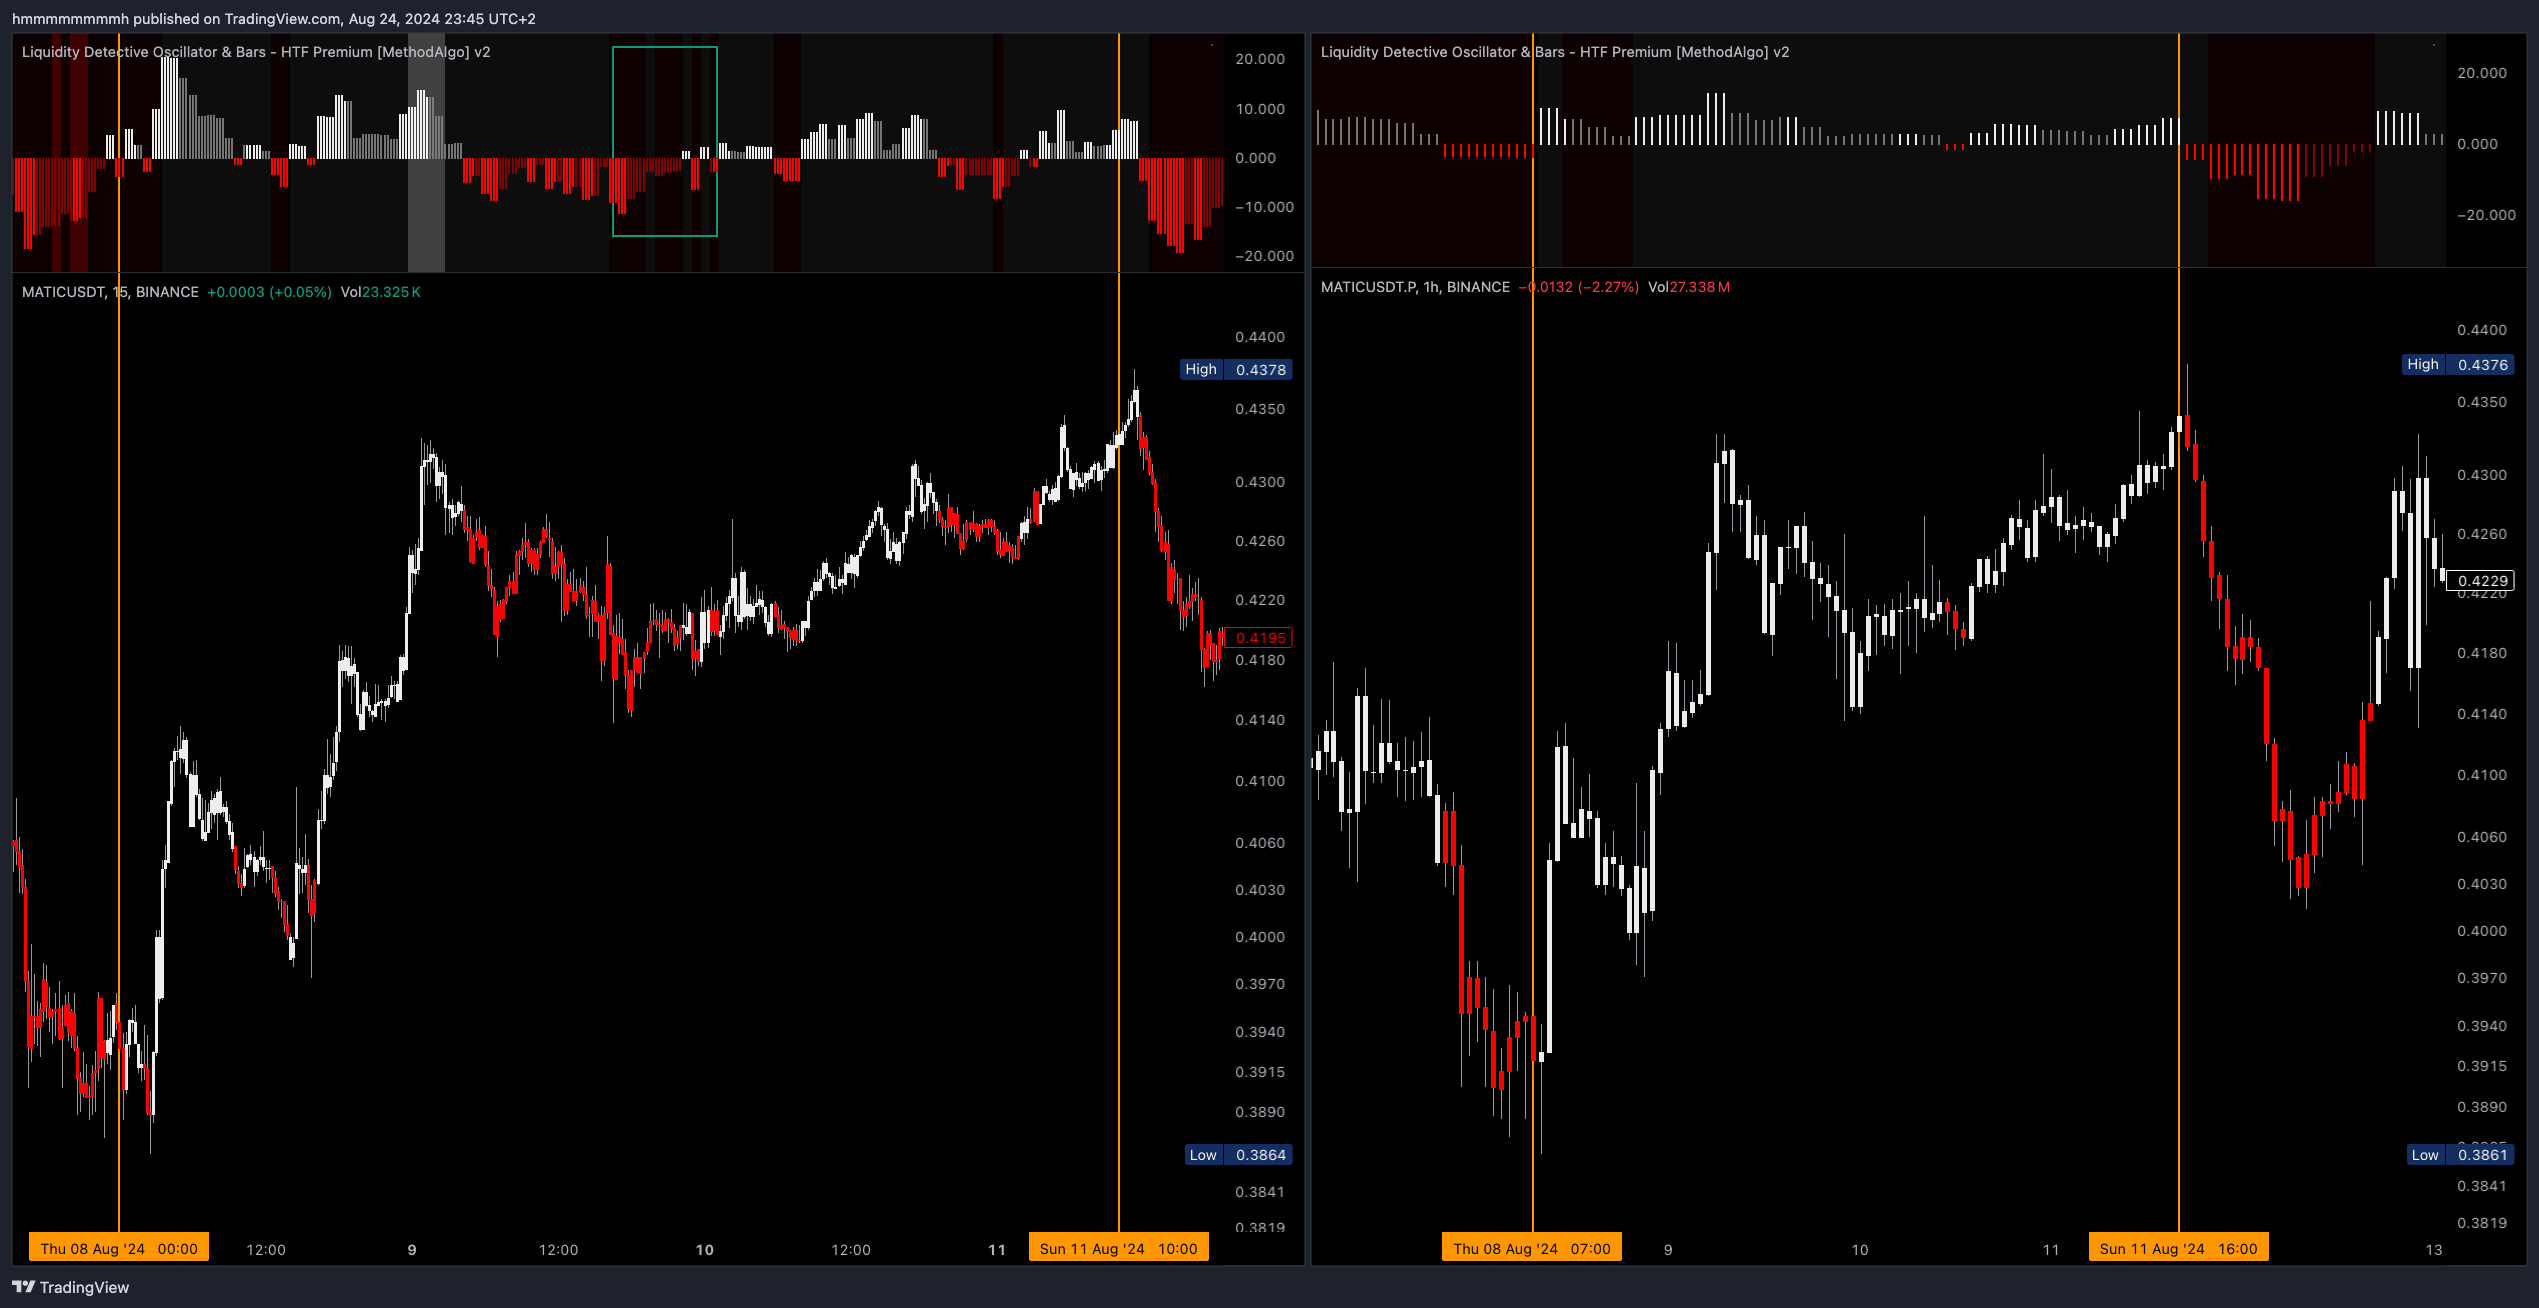 Left: MATICUSDT, 15m; Right: MATICUSDT, 1H
Entry and Exit Timing
When the BG Color switches from one color to the opposite, it signals the end of the previous trend and the beginning of a new one. As discussed in the Low Volatility Risk section above, BG Colors are relative algorithms. This means traders can use price action to enhance the effectiveness of BG Color signals.
- Similar to Apex, it's best to enter at the beginning of a BG Color change if composite analysis suggests an entry.
- Since BG Colors only change when one side's momentum weakens, or the other side's momentum exceeds a threshold, the color switch usually does not occur at the absolute top or bottom of the previous trend. Therefore, the best time to take profit requires composite analysis with other signals to maximize profit.
- If a BG Color trend has lasted a long time, the first reversal is often a dip. Consider verifying and continuing to trade in the direction of the trend.
Tip: Applying Detective BG Colors to the Main Chart
- In the Liquidity Detective settings, turn off all Features except
Background Color. - Click the
"..."button next to the Liquidity Detective indicator name, and under the Move section, choose to move it to the upper chart (or lower chart).
Settings
BG Colors are enabled by default and can be disabled in the Features section of the Detective settings.
Remarks
- Since the Liquidity Detective uses higher timeframe data, traders should observe the "Yellow Line of HTF Candle Close" to confirm signals. When BG Colors change, wait until the current chart's real-time candle closes before considering the signal to avoid changes in real-time signals. See Realtime vs Confirmed Signals for more details.
- The duration of a background color can vary -- sometimes only a few candles, or last several days. When the trend range is small, short-lived trends may wear down your capitals. Combining Swing and Fibonacci and Smart Cloud to analyze fluctuation ranges can help improve the profitability and win rate of BG Color strategies.
- Avoid trading solely based on BG Color signals. It's recommended to make decisions using multiple tools. Use BG Colors to add to your long or short bias, but only allocate 10-15% of your overall confidence value to BG Colors.
- BG Colors on higher timeframes can last longer, making it a good strategy to observe signals on higher timeframes and trade on lower timeframes.
The engineers at MethodAlgo are proud of their work, but it's essential for you to understand that no indicator / algorithm can guarantee perfect success. Trading profits and losses are greatly influenced by the trader's psychology, knowledge, experience, and risk management.
The algorithmic interfaces we provide are all part of T.A.T.A. When trading in reality, traders should make their decision like T.A.T.A, considering various factors and signals from other tools to establish confluence system.
Any unclear explanations or errors in this tutorial? Please contact MethodAlgo's @Staff on the Discord Trading Terminal for corrections.