Apex
Concept
Apex is a term used to describe when the price enters the RSI overbought (OverBought) or oversold (OverSold) state within a higher time frame (HTF). The RSI is well-known and widely used in traditional indicators, but it also has several drawbacks. For instance, it is a lagging indicator, prone to repainting, and its utility on the chart is limited most of the time, except when it provides high-quality trading signals at key levels, such as during overbought and oversold conditions. To address these limitations, Liquidity Detective extracts the essence of RSI, simplifying it into an easy-to-recognize background color to display Apex signals.
The reason it’s called Apex is that after the RSI enters an overbought or oversold state, the price often reacts quickly, with increased volatility, resembling the sharp rise or fall of a raptor. This state typically lasts for a short time, but Liquidity Detective extends this strong state threefold using HTF data, making it more durable. In short, what was originally a velociraptor turns into a super-velociraptor.
What You Can Use It For
- Chasing highs and lows
- Avoiding forced liquidation
- Judging the speed of price movement
Interface
Apex is a state signal, displayed using background colors:
Strong White Background: Bull ApexStrong Red Background: Bear Apex
Data TimeFrame
When the Autopilot TF feature is enabled (enabled by default), the detective automatically adjusts the data timeframe. If you want to customize data timeframe, it’s recommended to set it to at least three times the current chart's time frame to expand the cycle dimension and obtain more consistent data.
Data Timeframe used when Autopilot TF is ON
| Chart | Data Timeframe |
|---|---|
| 1m | 10m |
| 3m | 15m |
| 5m | 30m |
| 10m | 45m |
| 15m | 1h |
| 30m | 2h |
| 45m | 4h |
| 1h | 4h |
| 2h | 8h |
| 3h | 1d |
| 4h | 1d |
| 6h | 12h |
| 12h | 1d |
| 1d | 3d |
Characteristics of Apex
You can observe Apex in any chart and will notice the following characteristics:
Price Movement Magnitude
- Apex data is based on the Relative Strength Index (RSI), so the Apex signal can only predict impulsive behavior and the continuation of impulsive states, but it cannot predict the exact magnitude of price changes. This means that even if two Apex states last the same amount of time, their price changes may differ significantly. The price might change by 30%, or it might only change by 3% (for example, with large-cap assets like BTC).
Lifecycle
- The Apex signal initially shows strong impulsiveness, but the magnitude of the price changes usually diminishes over time.
- Traders should focus on the initial stage of the Apex state. For example, in a Bullish Apex, the price usually undergoes an impulsive rise. Afterward, the price may need some time to decline or consolidate before close the Apex state. Therefore, the end of the Apex state (marked by the disappearance of the strong background color) is not the best time to close a position. It is advisable to use other tools to determine profit targets, such as attempting a trailing stop strategy or using the Grim Reaper indicator to predict where the Apex will stop.
- After Apex closed, there is often a significant rebound or retracement, especially in cases of capitulation triggered by Apex, which can directly lead to a trend reversal. Therefore, it’s wise to take profits in stages when the Apex state is about to end or just ended to avoid giving back gains.
- Although the Apex signal already uses HTF data, it still follows the principle of timeframes: a 15-minute Apex is not as strong as a 30-minute one, a 30-minute one is not as strong as a 1-hour one, and a 1-hour one is not as strong as a 4-hour one. The higher the timeframe, the stronger and longer-lasting the Apex state.
Do Not Fight Against It
- Opening a counter-position during an Apex can lead to significant losses. The Apex state often ignores minor support and resistance levels and tries to force short squeezes or long liquidations, leading to a series of stop-loss triggers and forced liquidations.
Examples
Using Apex is straightforward. When the background color of Liquidity Detective changes to a bright color, this marks the beginning of impulsive price action. At this point, since the magnitude of the Apex movement cannot be predicted, traders should make every effort to avoid opening counter-positions and avoid fighting the Apex until the Apex state ends.
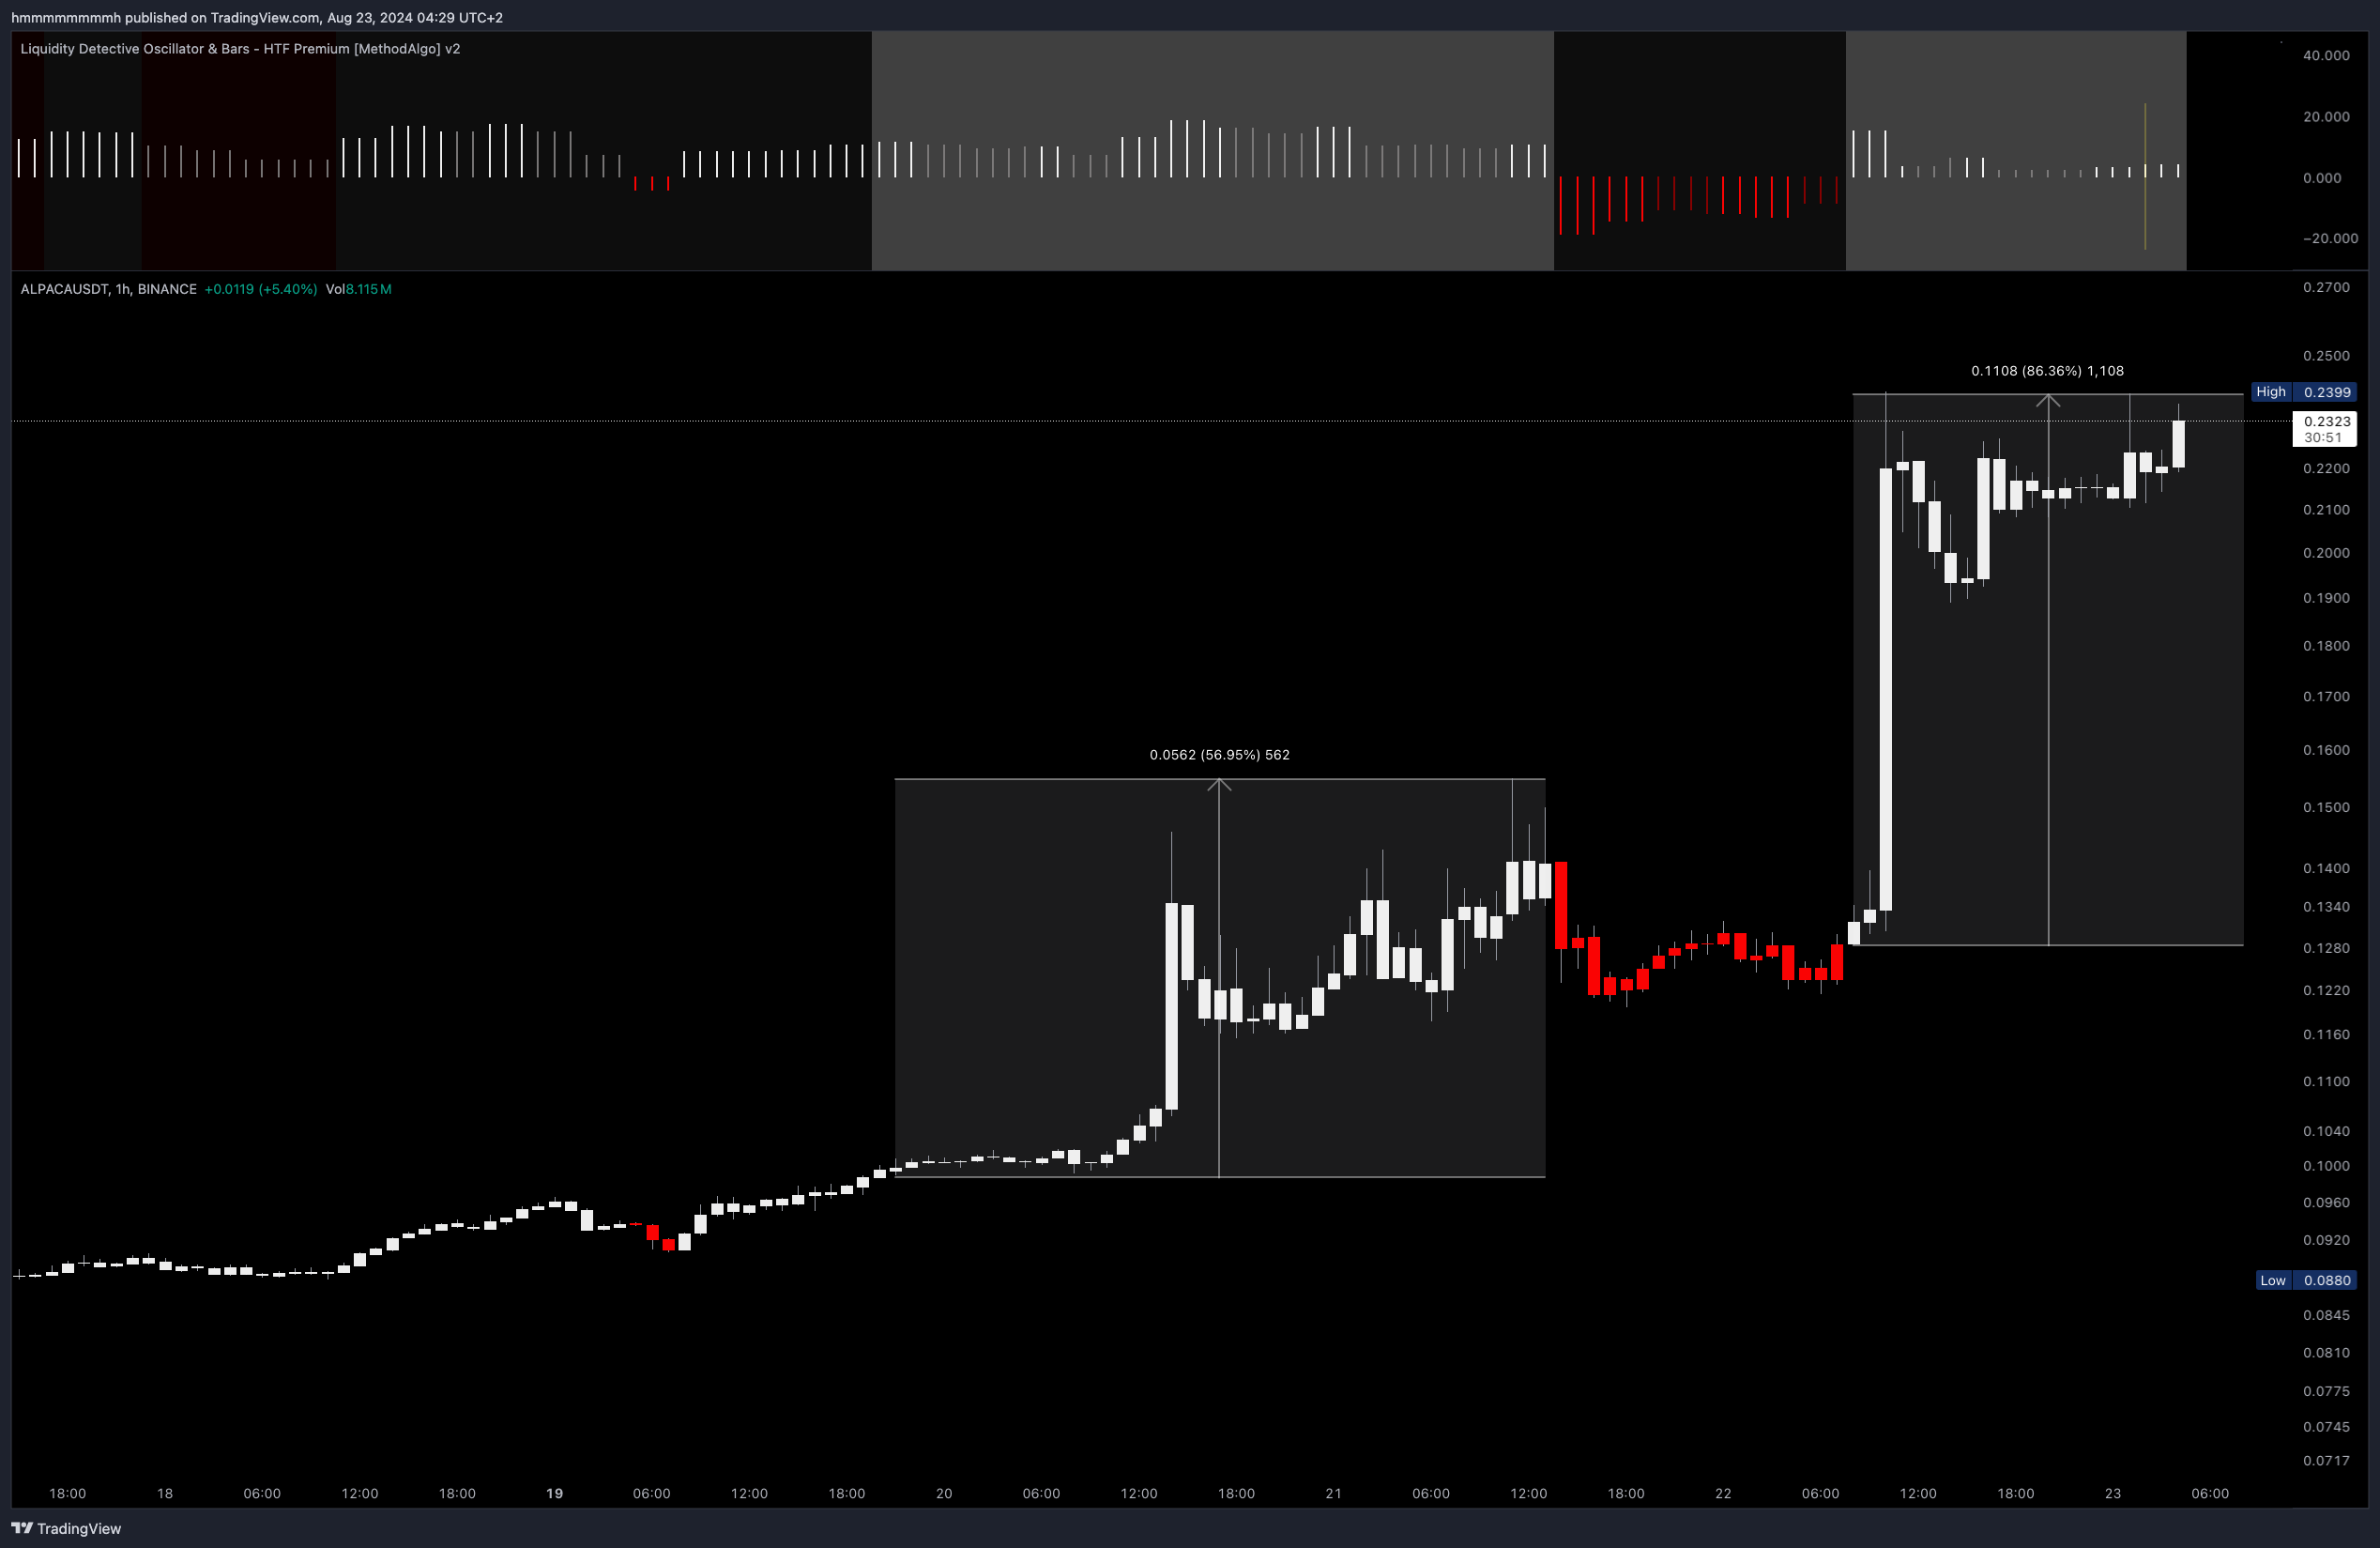
Example of a Bullish Apex
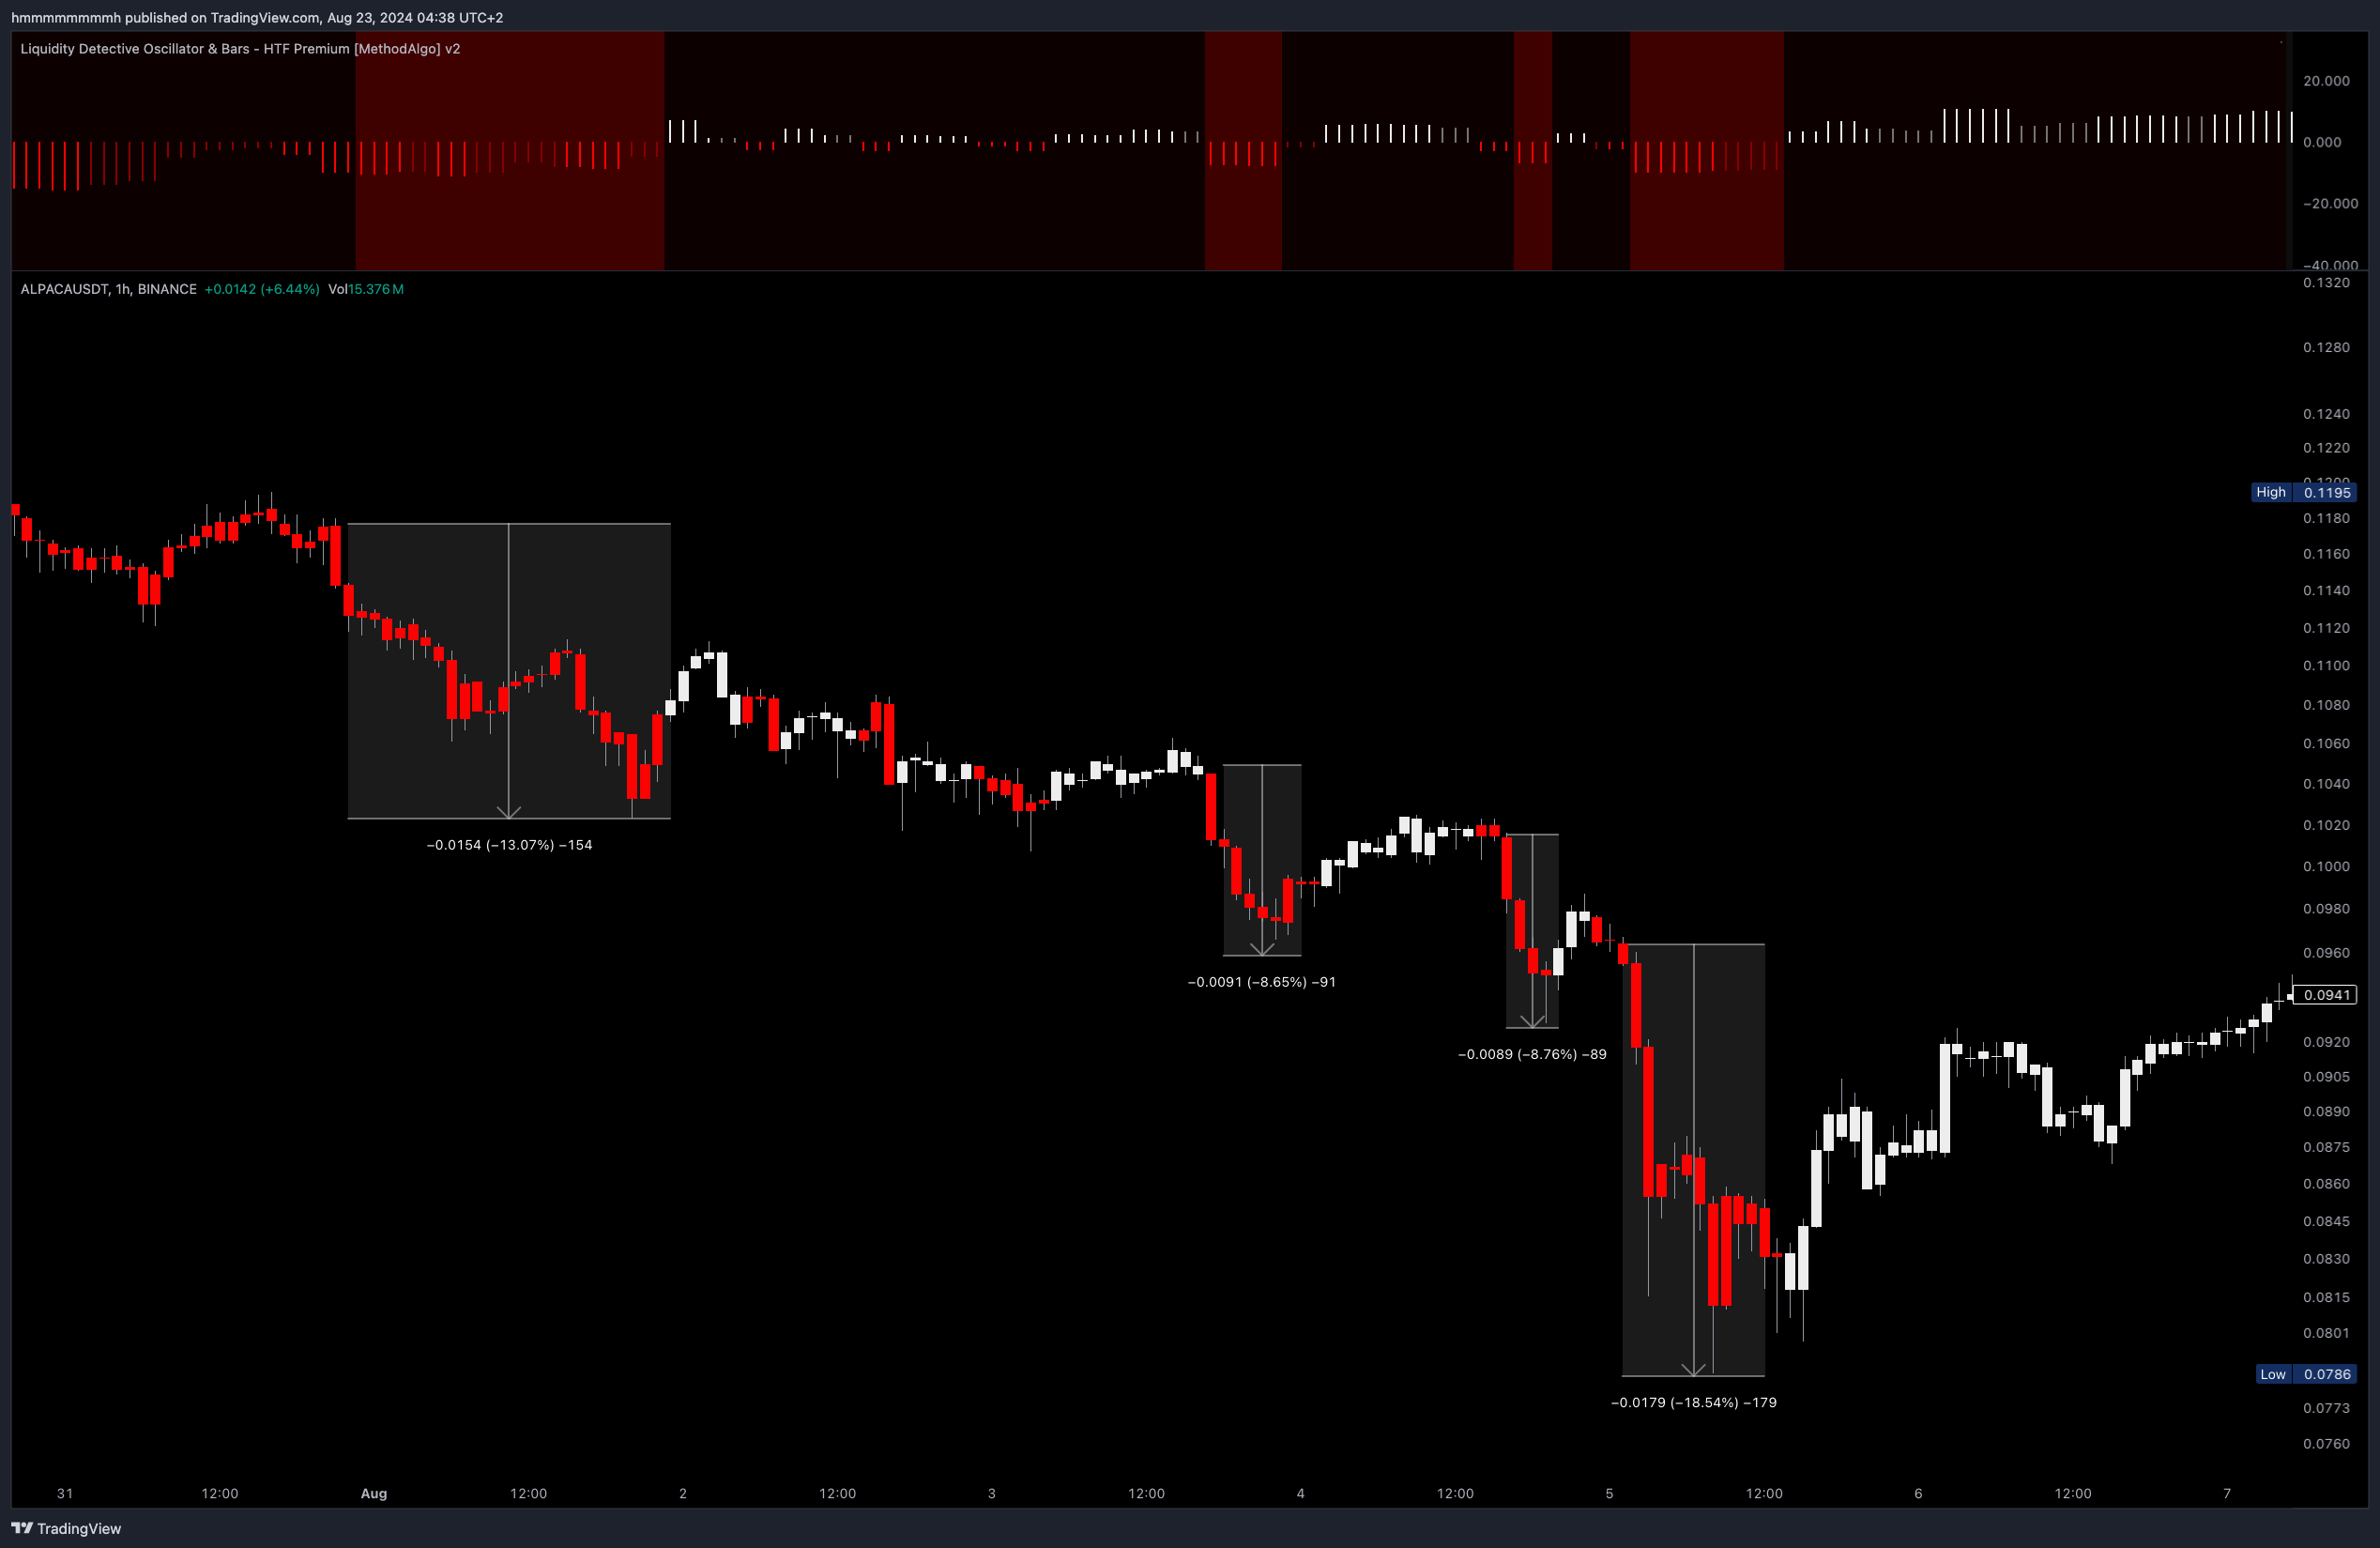 Example of a Bearish Apex
Parameter
- Apex is a feature that is enabled by default, but you need to keep the
Background Colorfeature enabled as well. Disabling either one will hide the Apex from oscillator. - Apex shares its data Timeframe with RSH. Different data timeframe have different impact on signals. With the
Autopilot TF(enabled by default), the data framework is set to 2-3 times the current chart’s time frame to ensure the continuity of Apex.
Remarks
- Use other analytical tools provided by MethodAlgo to help confirm the bullish/bearish bias Apex gives you, and observe the “HTF Candle Open/Close Status Line” to confirm the HTF candle close state to lock in the Apex signal. See Realtime vs Confirmed Signals .
- Never fight the Apex. Opening counter-positions during an Apex pattern usually leads to forced liquidation.
- Apex often reappears after a break. If you intend to trade in the opposite direction, make sure you have a strong confluence.
The engineers at MethodAlgo are proud of their work, but it's essential for you to understand that no indicator / algorithm can guarantee perfect success. Trading profits and losses are greatly influenced by the trader's psychology, knowledge, experience, and risk management.
The algorithmic interfaces we provide are all part of T.A.T.A. When trading in reality, traders should make their decision like T.A.T.A, considering various factors and signals from other tools to establish confluence system.
Any unclear explanations or errors in this tutorial? Please contact MethodAlgo's @Staff on the Discord Trading Terminal for corrections.