ADX & Trendline
Concept
ADX (Average Directional Index) is a technical analysis tool regarded by many traders as the ultimate trend indicator. It was introduced by the American technical analyst Welles Wilder in 1978. The primary function of ADX is to measure the strength and direction of a price trend over a period of time. The original indicator comprises three lines: the ADX line, +DI (Positive Directional Indicator), and -DI (Negative Directional Indicator). When the ADX value exceeds 20 and +DI is greater than -DI, it indicates a strong uptrend; when the ADX value exceeds 20 and -DI is greater than +DI, it indicates a stronger downtrend. For more detailed information on the principles, introduction, and usage of ADX, click here.
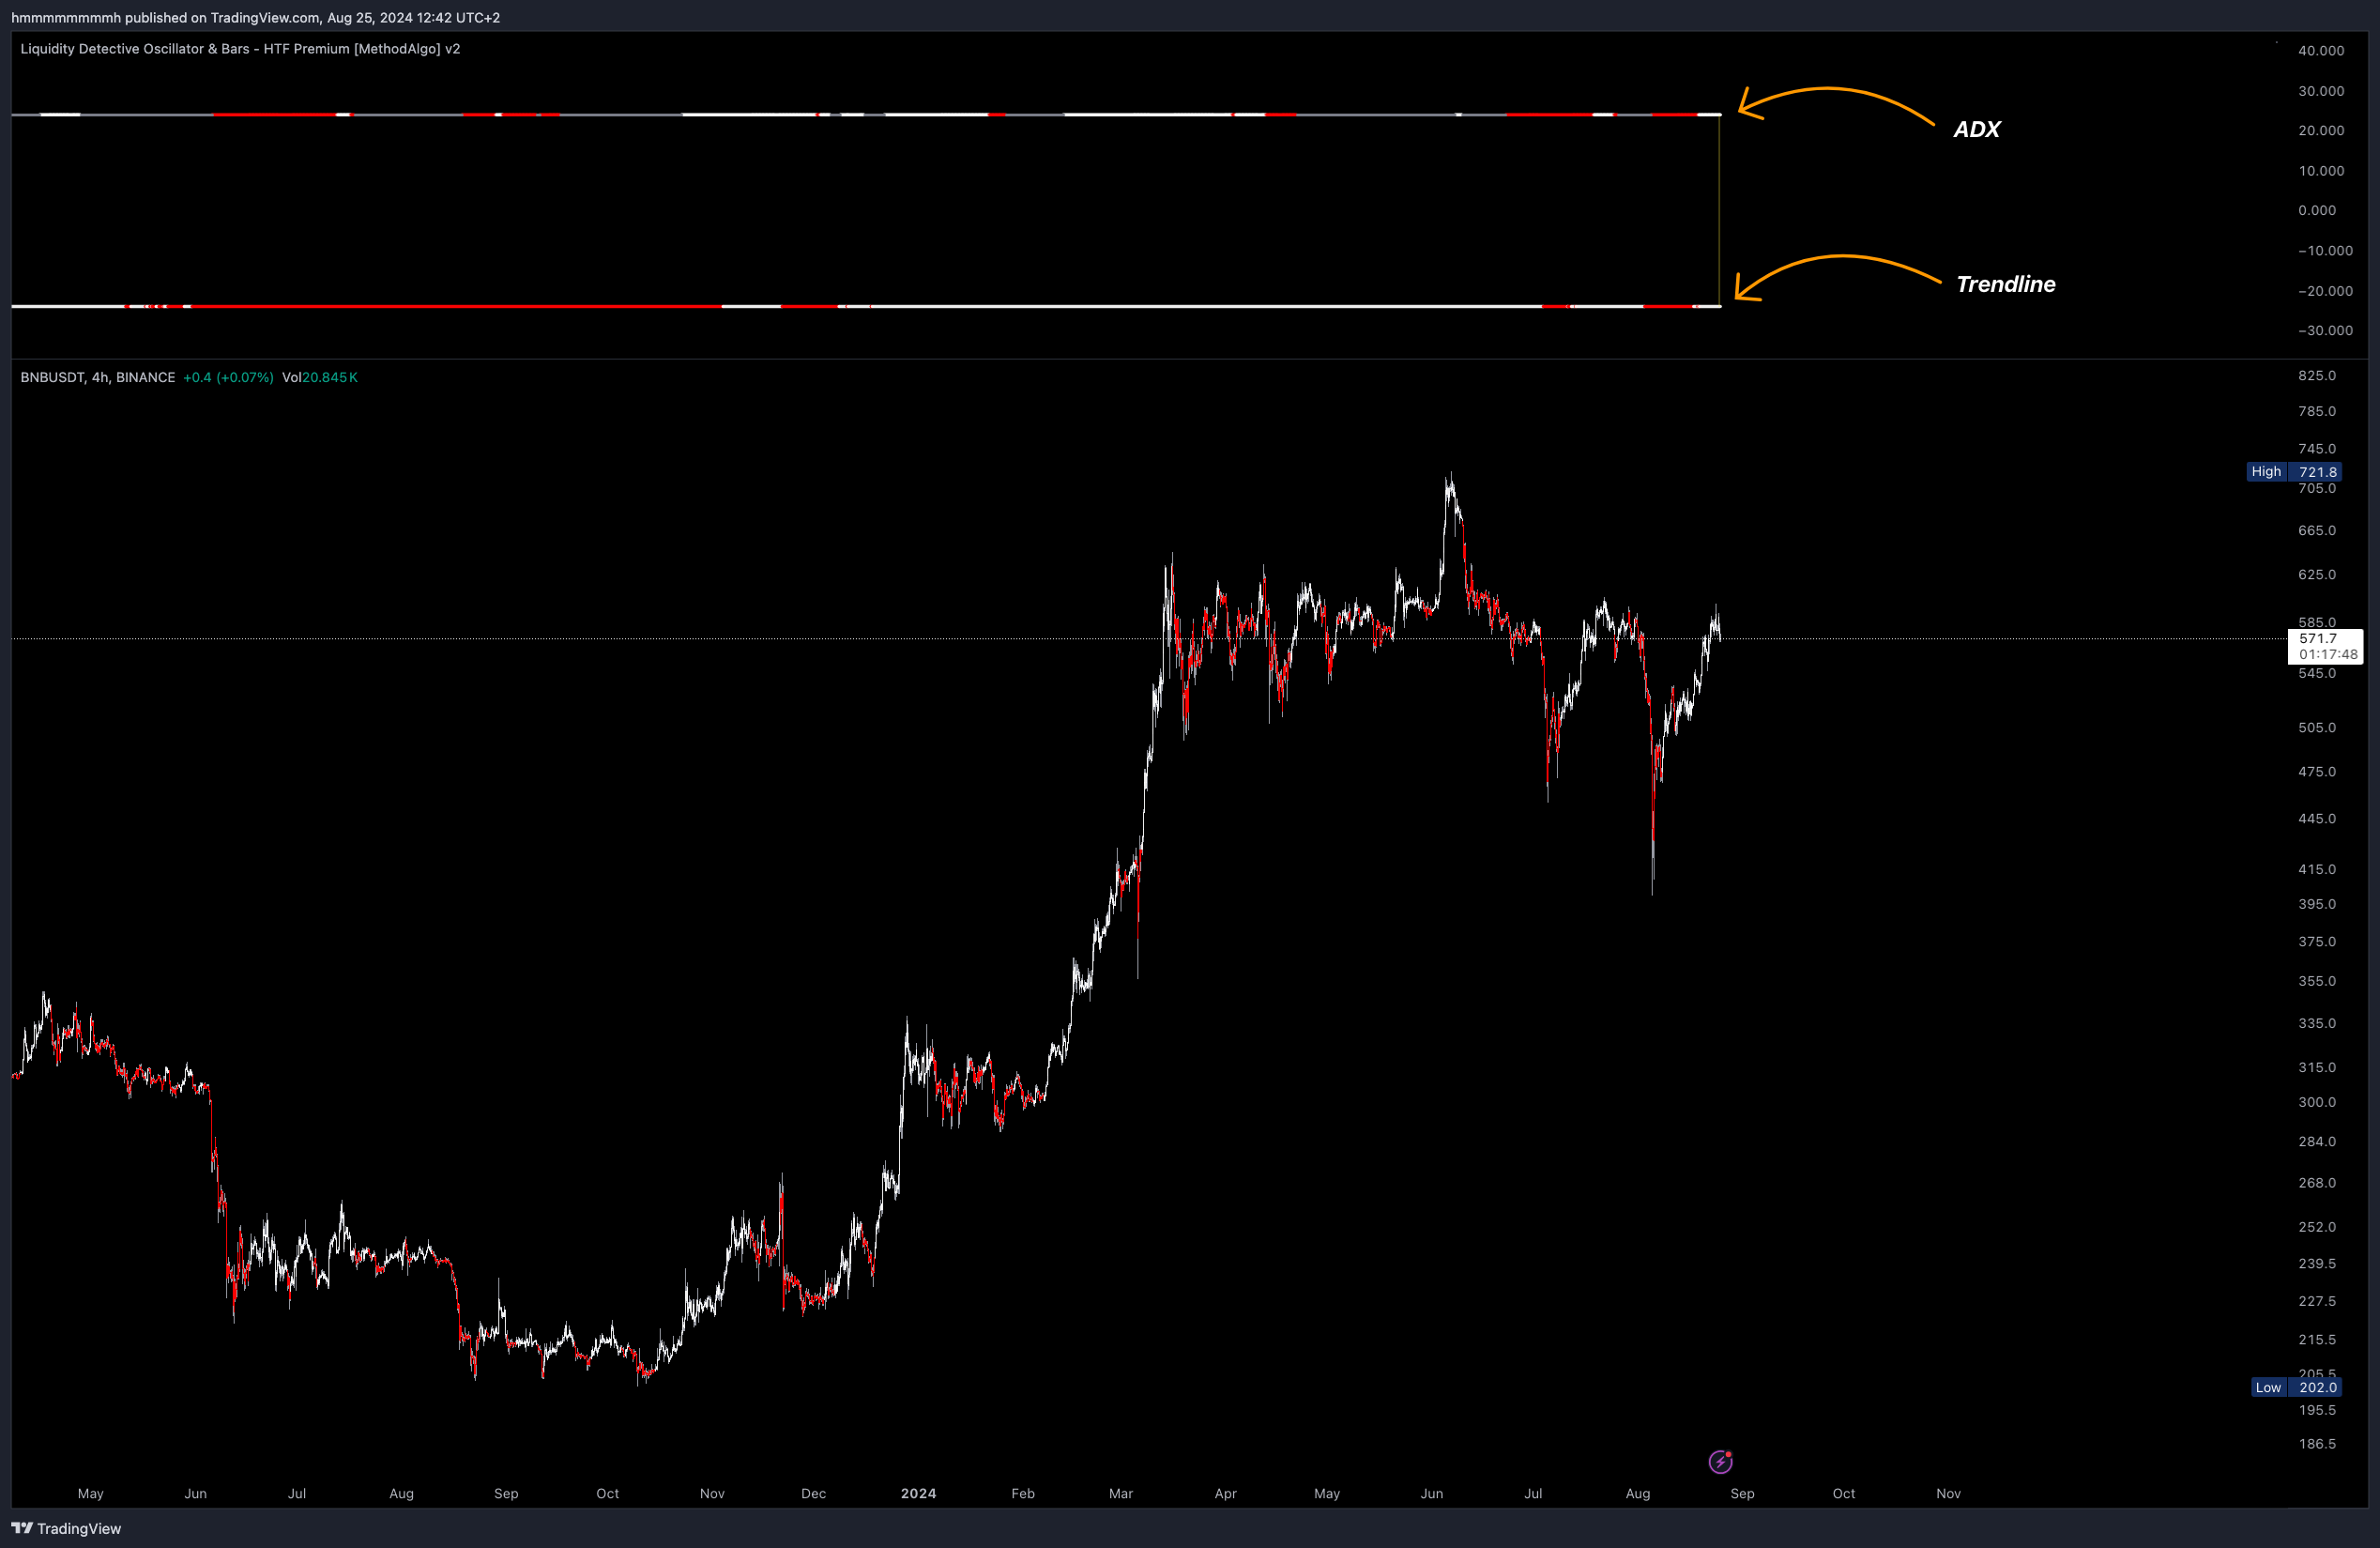
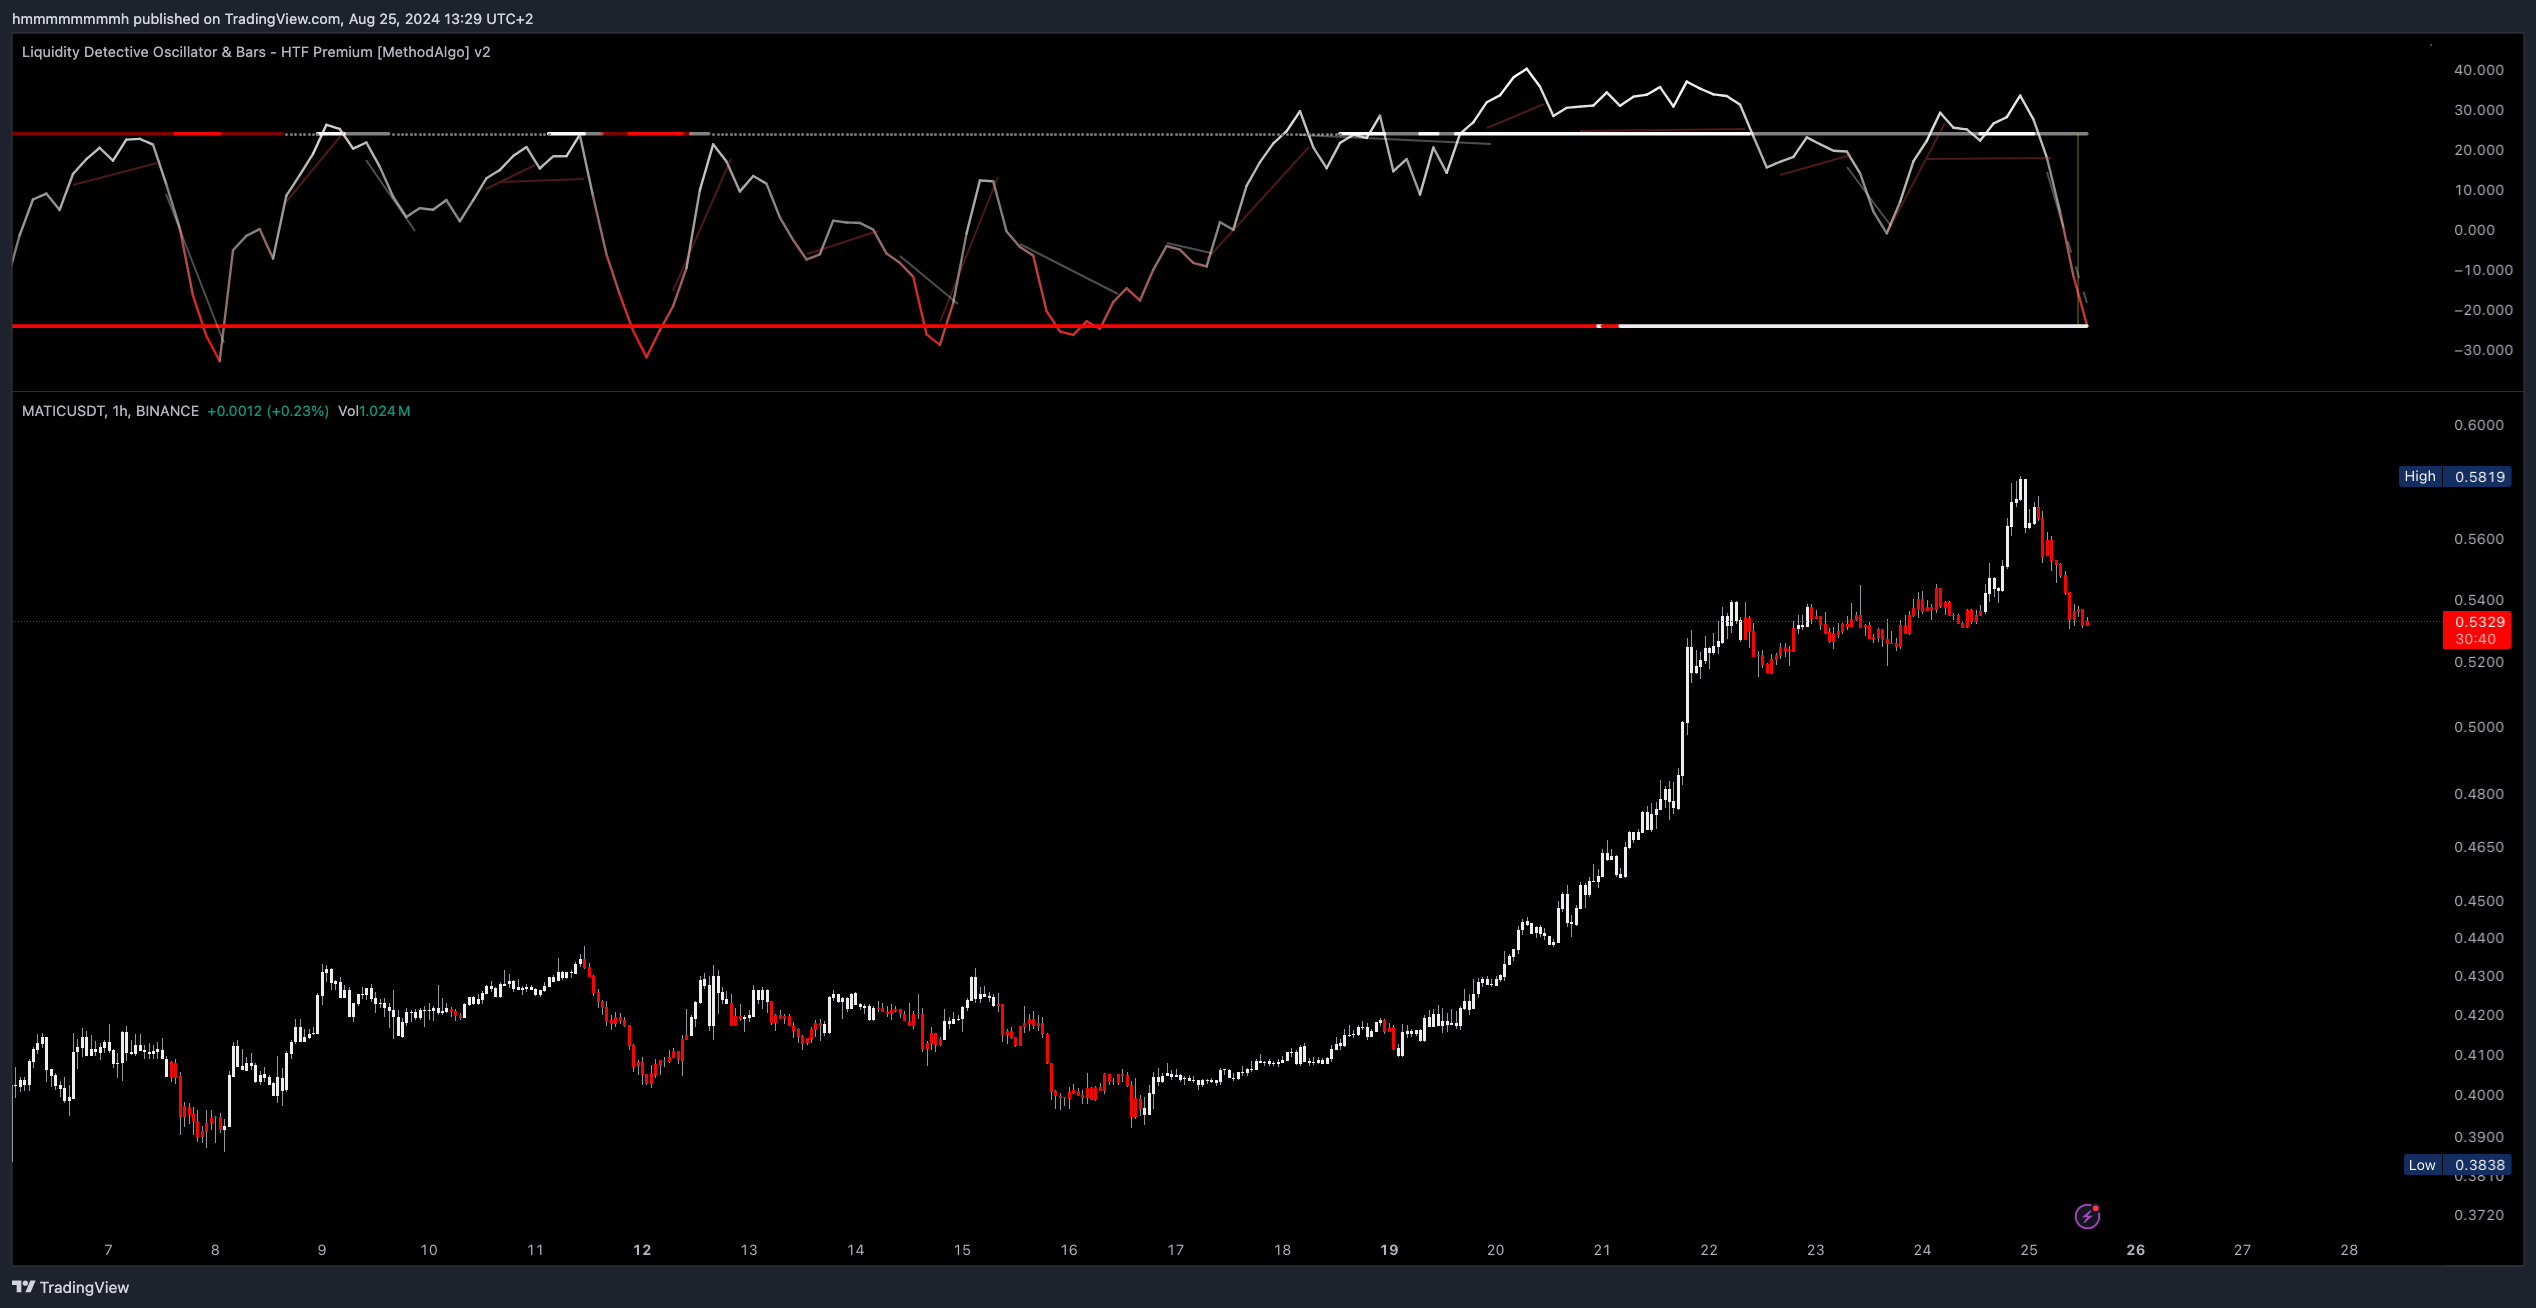
In Liquidity Detective, the complex signals of ADX and Trendline have been simplified through the color changes of two fixed horizontal lines. These lines are displayed in red and white, providing more intuitive trend analysis. Additionally, the Liquidity Detective uses data from a timeframe that is twice the chart's timeframe to calculate the ADX trend, offering more sustainable analysis.
In MethodAlgo’s analysis system, ADX is a versatile tool. For example, it can be used in conjunction with other tools to verify entry timing and reduce post-entry drawdowns. Unlike RSH, ADX uses its own method to calculate trend strength. In actual trading, it’s best to combine ADX with trendlines or other signals for optimal results when they all align.
Use Cases
- Trend following signals
- Identifying consolidation phases
- Verifying breakouts
- Optimizing entry timing
- Acting as an overbought/oversold threshold for CycleWaves and RSI
Interface
In the Liquidity Detective, two fixed horizontal lines are used:
-
ADX Line (Top Line): Indicates trend strength.
- White: Indicates the strength of an uptrend, calculated when ADX is greater than 20 and +DI is greater than -DI.
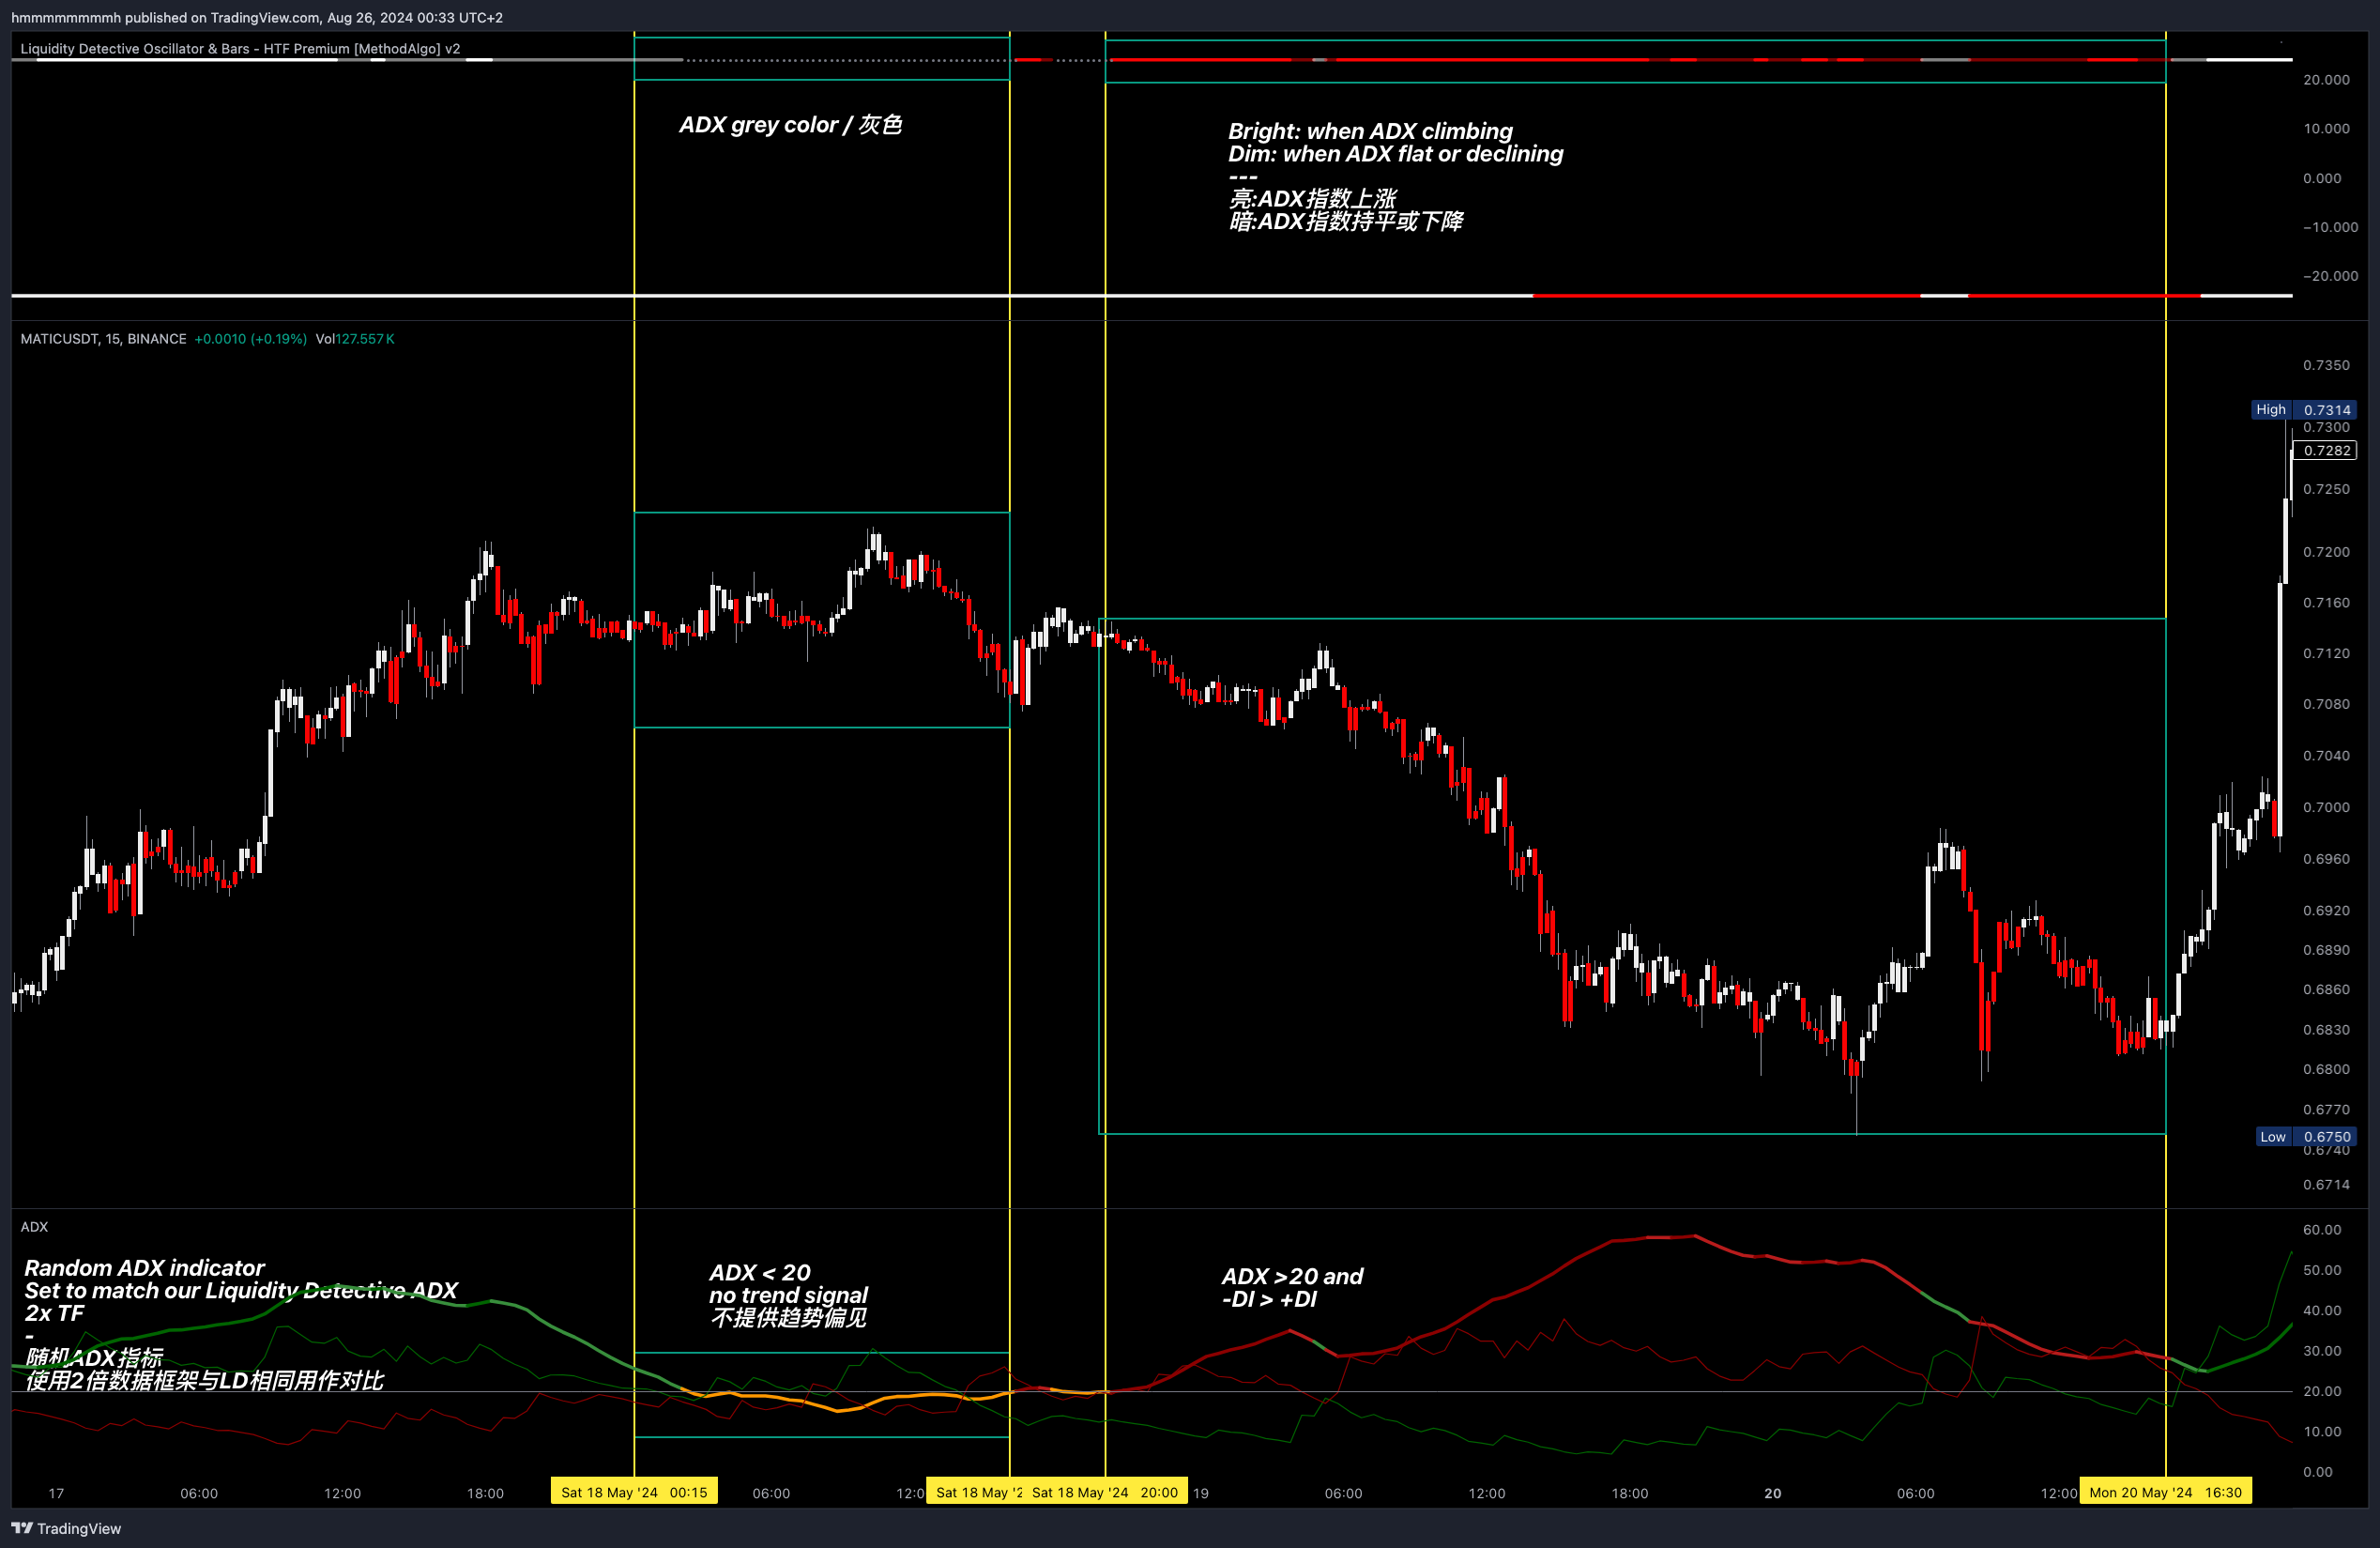
- Bright white represents an increasing ADX index, with significant price movement.
- Light white represents a weakening ADX index, with smaller price movements.
- Red: Indicates the strength of a downtrend, calculated when ADX is greater than 20 and -DI is greater than +DI.
- Bright red represents an increasing ADX index, with significant price movement.
- Light red represents a weakening ADX index, with smaller price movements.
- Gray: Indicates ADX is less than 20, showing no trend strength.
- White: Indicates the strength of an uptrend, calculated when ADX is greater than 20 and +DI is greater than -DI.
-
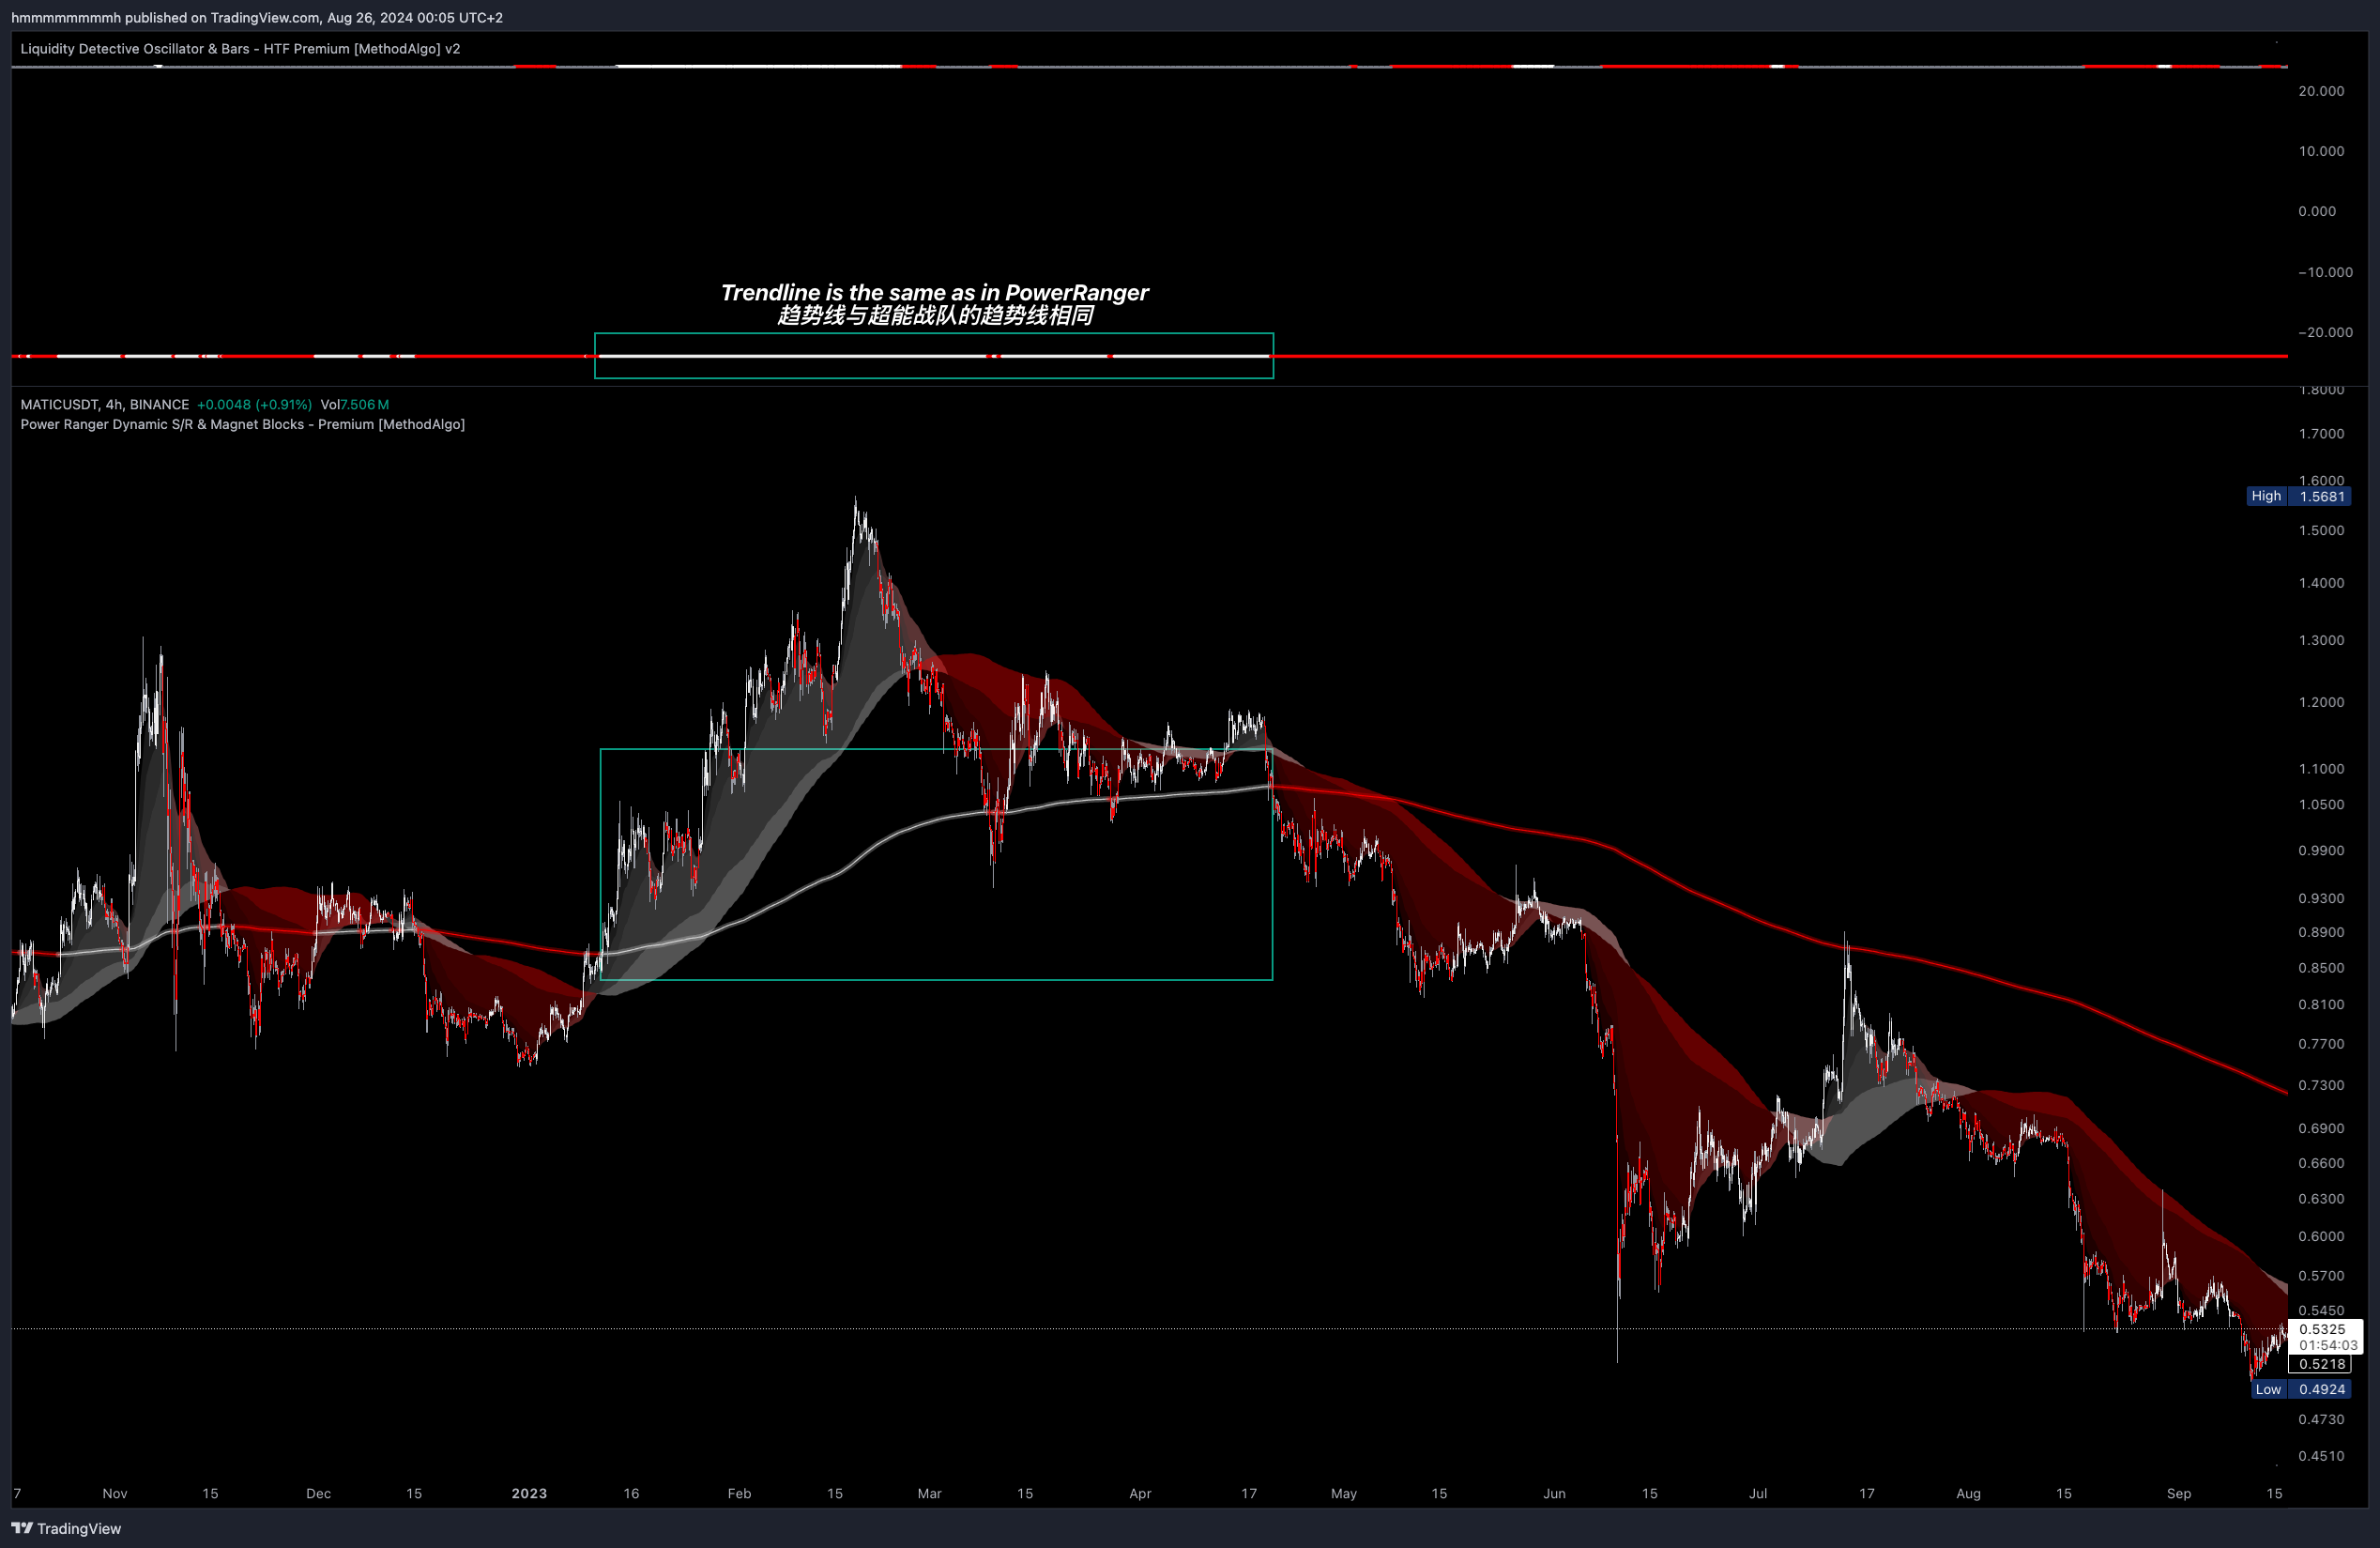
Trendline (Bottom Line): Indicates the trend direction; white for an uptrend and red for a downtrend. This color corresponds with the Power Ranger's trendline on the chart.
The position of the two fixed lines also serves as threshold lines for the overbought/oversold regions of Cyclewaves and RSI.
Data TimeFrame
By default, the AutoPilot automatically selects the appropriate ADX data Timeframe based on the current chart's Timeframe. Traders can also disable AutoPilot in the Parameter Settings and manually select a data timeframe.
Data Timeframe used when Autopilot TF is ON
| Chart | Data TimeFrame |
|---|---|
| 1m | 5m |
| 3m | 5m |
| 5m | 15m |
| 10m | 15m |
| 15m | 30m |
| 30m | 60m |
| 45m | 60m |
| 1h | 2h |
| 2h | 4h |
| 3h | 6h |
| 4h | 12h |
| 6h | 12h |
| 12h | 12h |
| 1d | 3d |
Accuracy Compared to Native Indicators
The example below shows that the trendline in Liquidity Detective is identical to the trendline in the Power Ranger indicator.
 BTCUSDT.P
The following example illustrates how Liquidity Detective has already calculated various signals provided by ADX, simplified and visualized them through colors, with the accuracy matching that of the native ADX.
- The line is gray when ADX is less than 20(customizable).
- When ADX is greater than 20, and -DI is greater than +DI, the line shows bright red when ADX is rising and light red when ADX is falling.
 BTCUSDT.P
Examples
ADX is an auxiliary timing signal that provides confidence boosts or is used to verify signals generated by other tools.
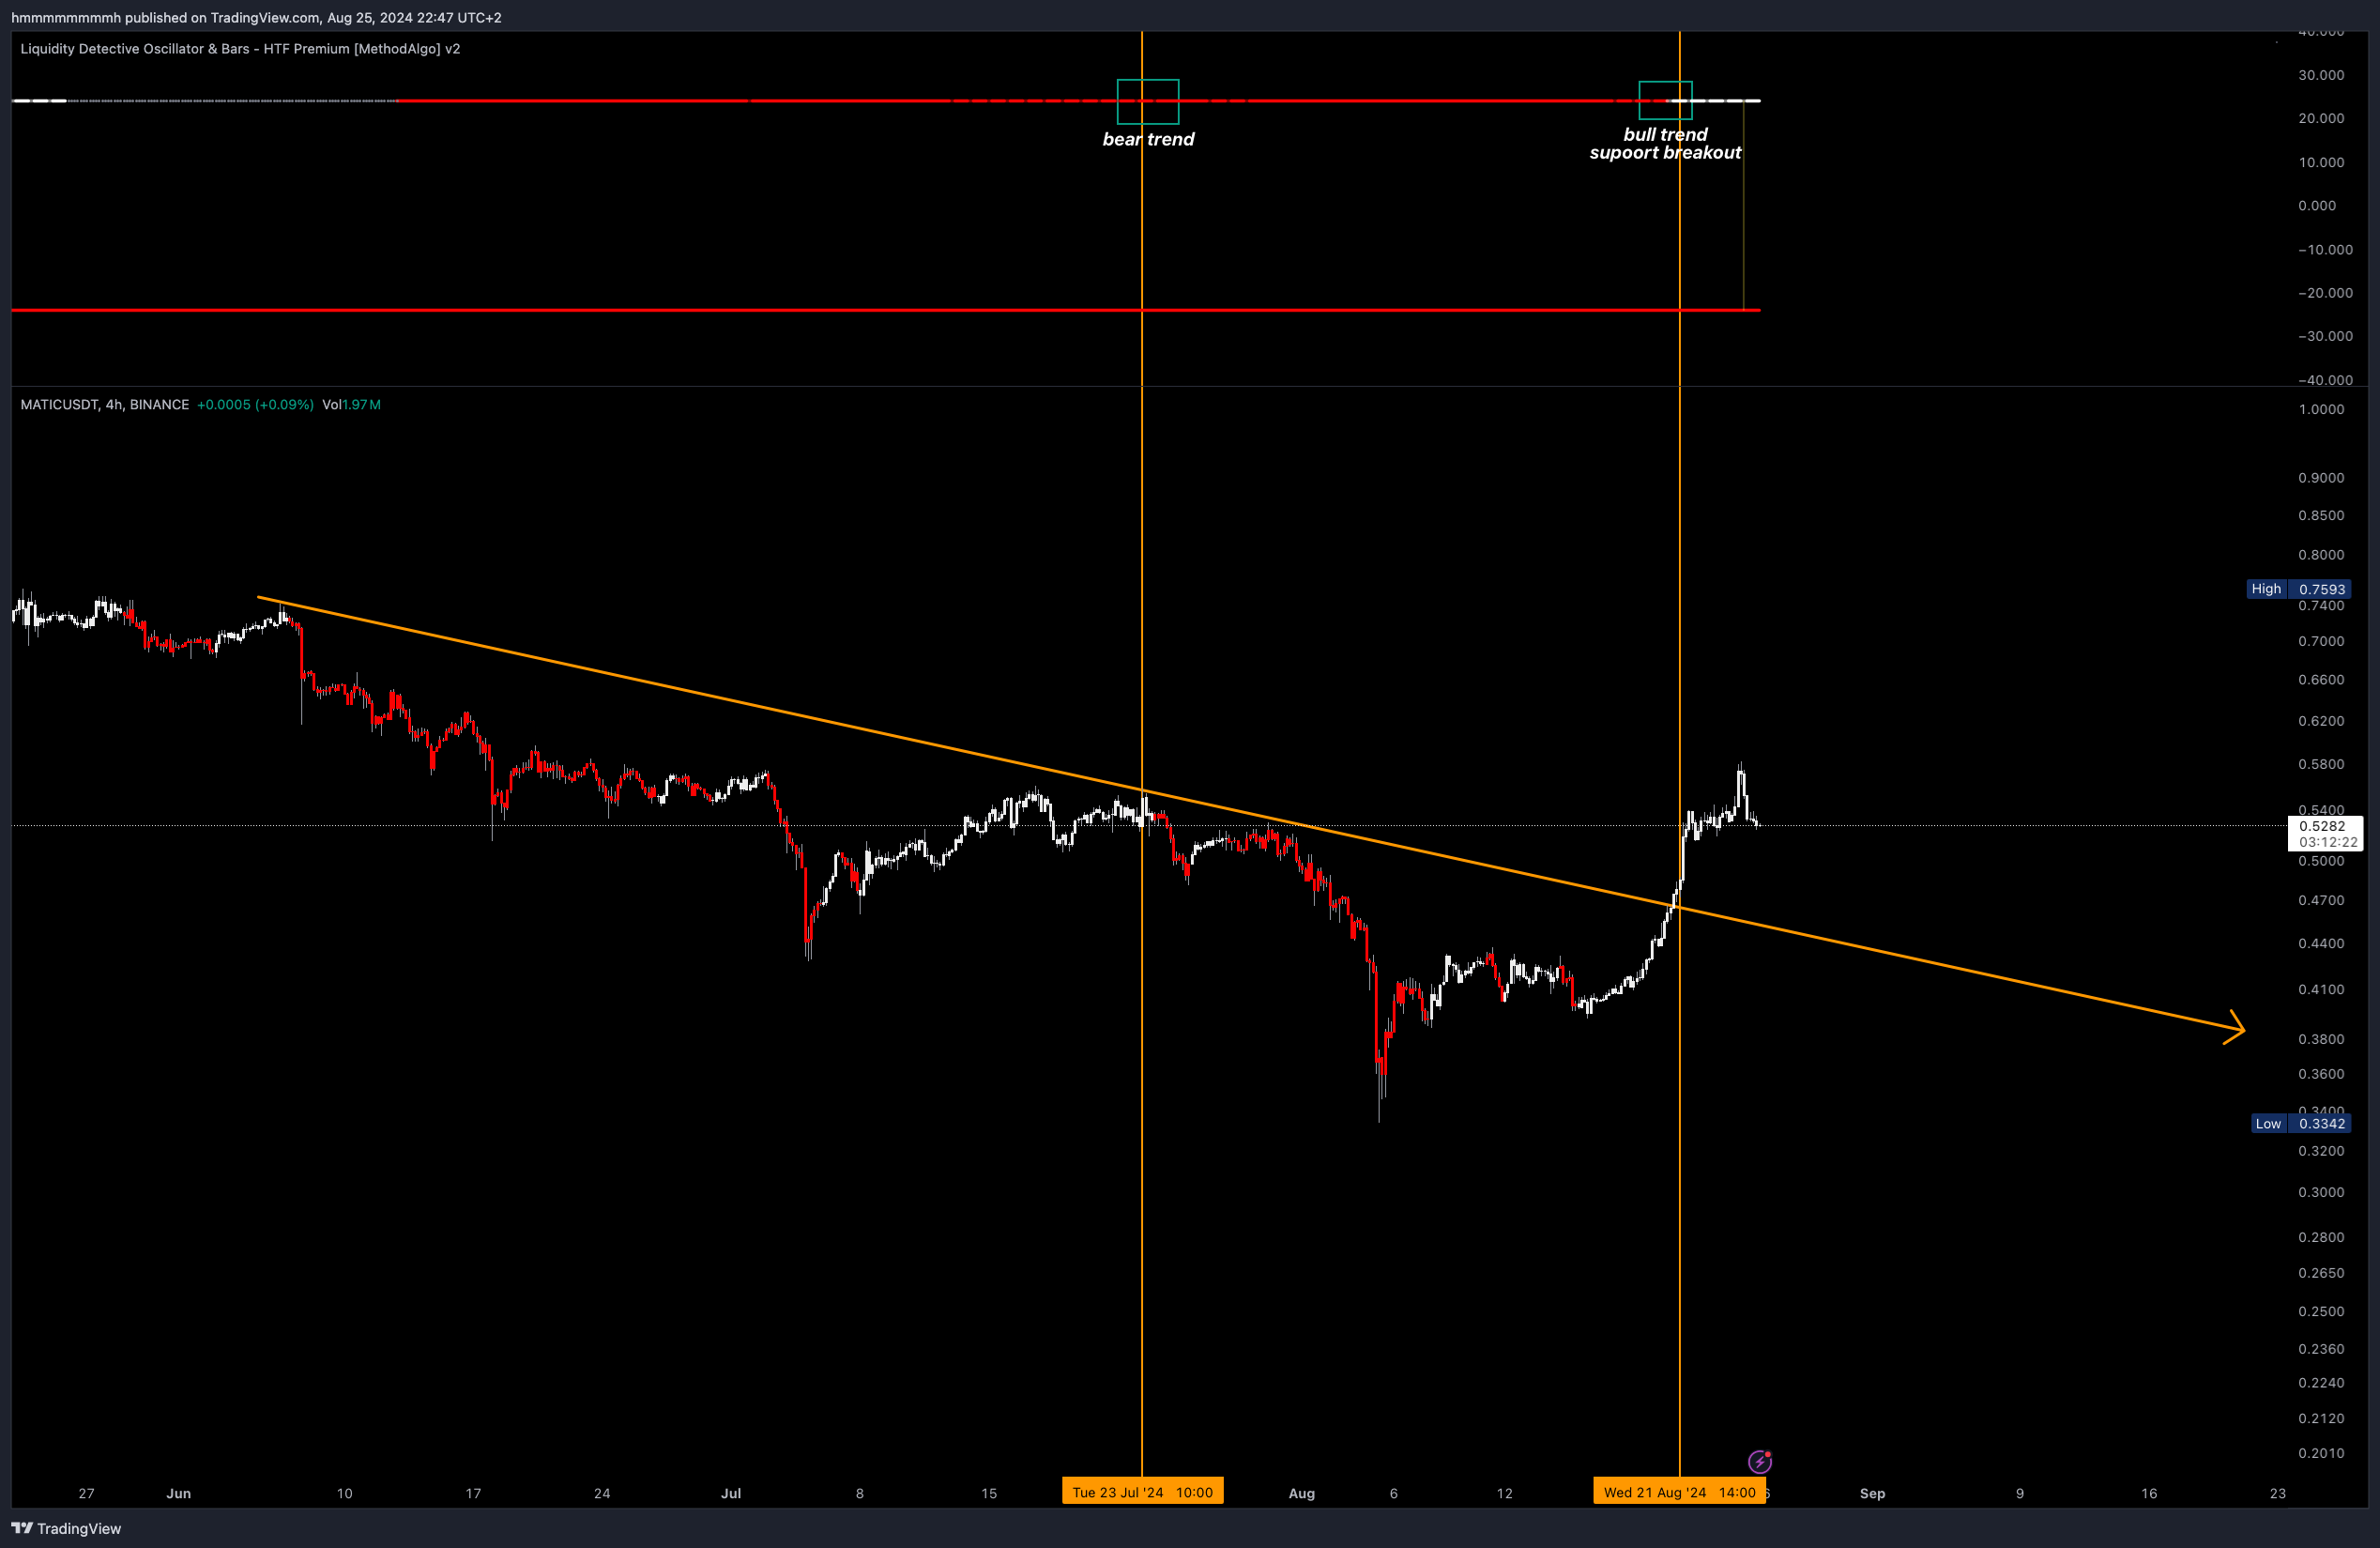
Using ADX to Assist Breakout Validation
When traders observe patterns or support/resistance breakouts, ADX colors can be used to judge trend strength, assisting in validating whether a breakout is a fakeout.
For validate breakouts uses, set ADX parameter to 25 in the settings, which increases validation accuracy.
Trend Following Signals
Reducing Entry Drawdowns
When ADX is bright, it indicates that one side's trading volume and price movement are in sync, with volume and trend supporting the direction in the short term. This means that entering in the direction of the trend during bright ADX lines can reduce post-entry volatility drawdowns compared to the opposite color and gray lines.
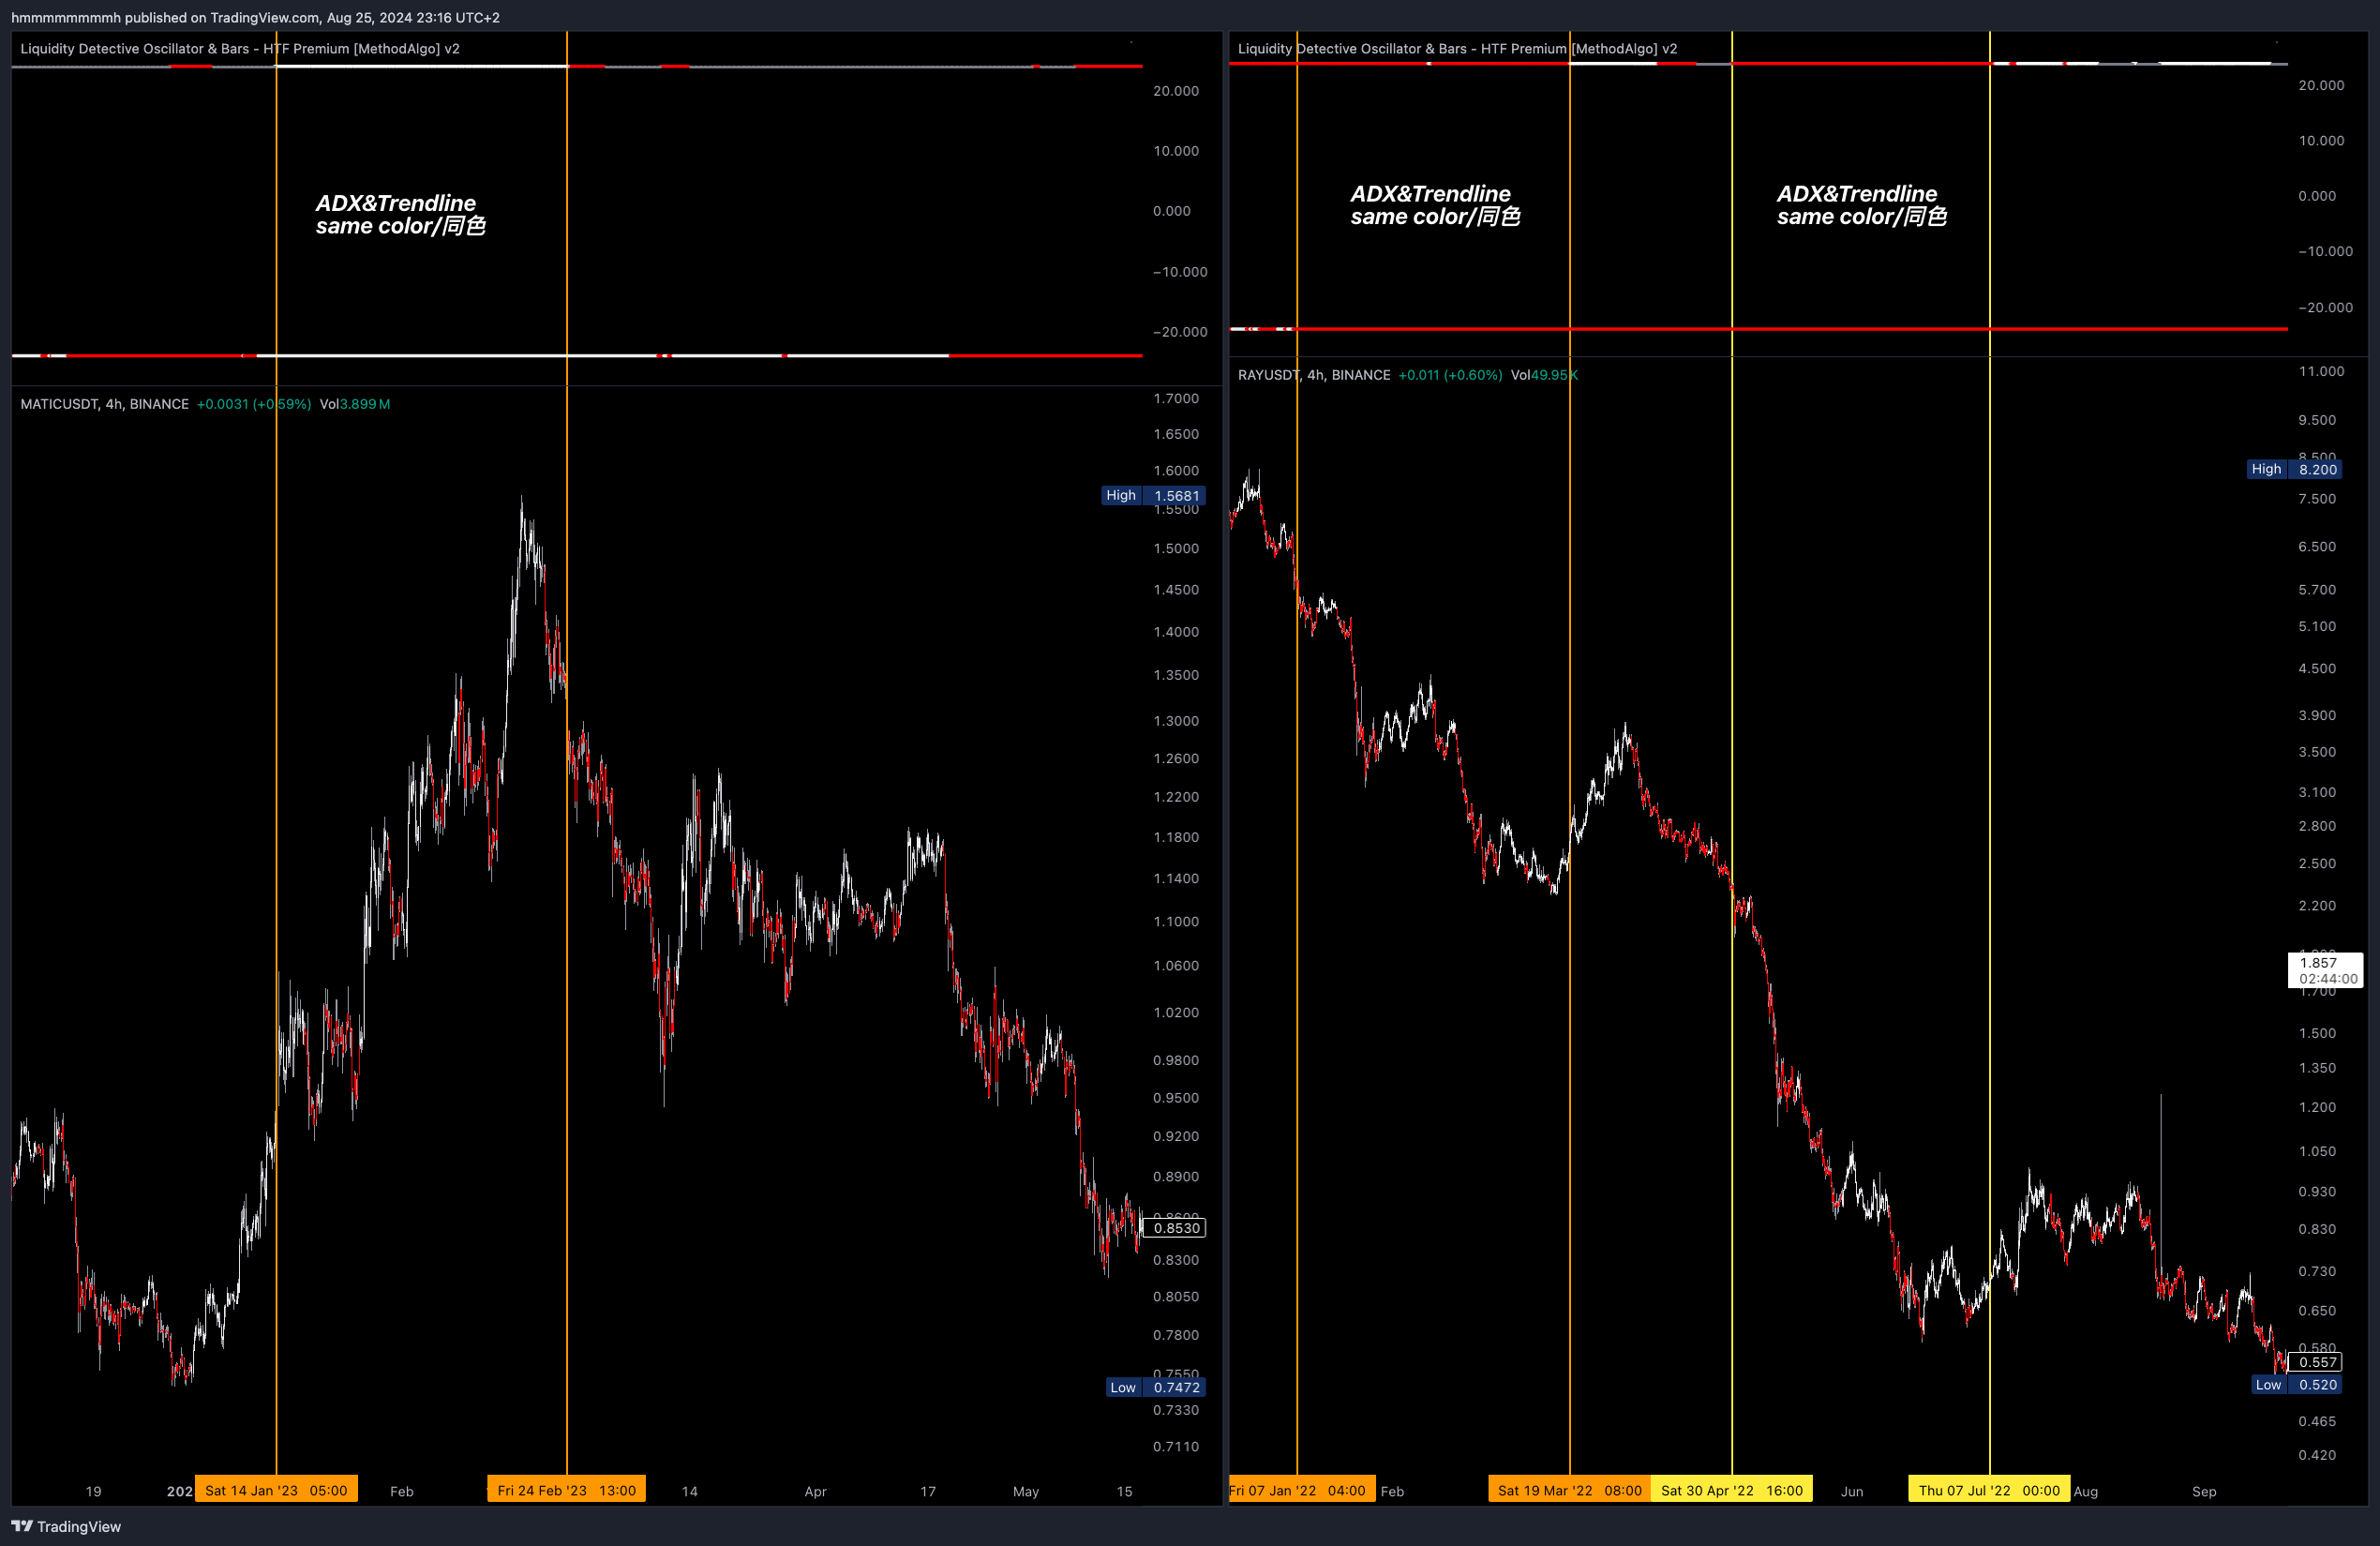
Trend Movement
Trendline tells traders whether the current price is in an uptrend or downtrend. When ADX is bright and the trendline is the same color, it is a trend-following signal, meaning the price is in trending movement, and the ADX data supports this direction.
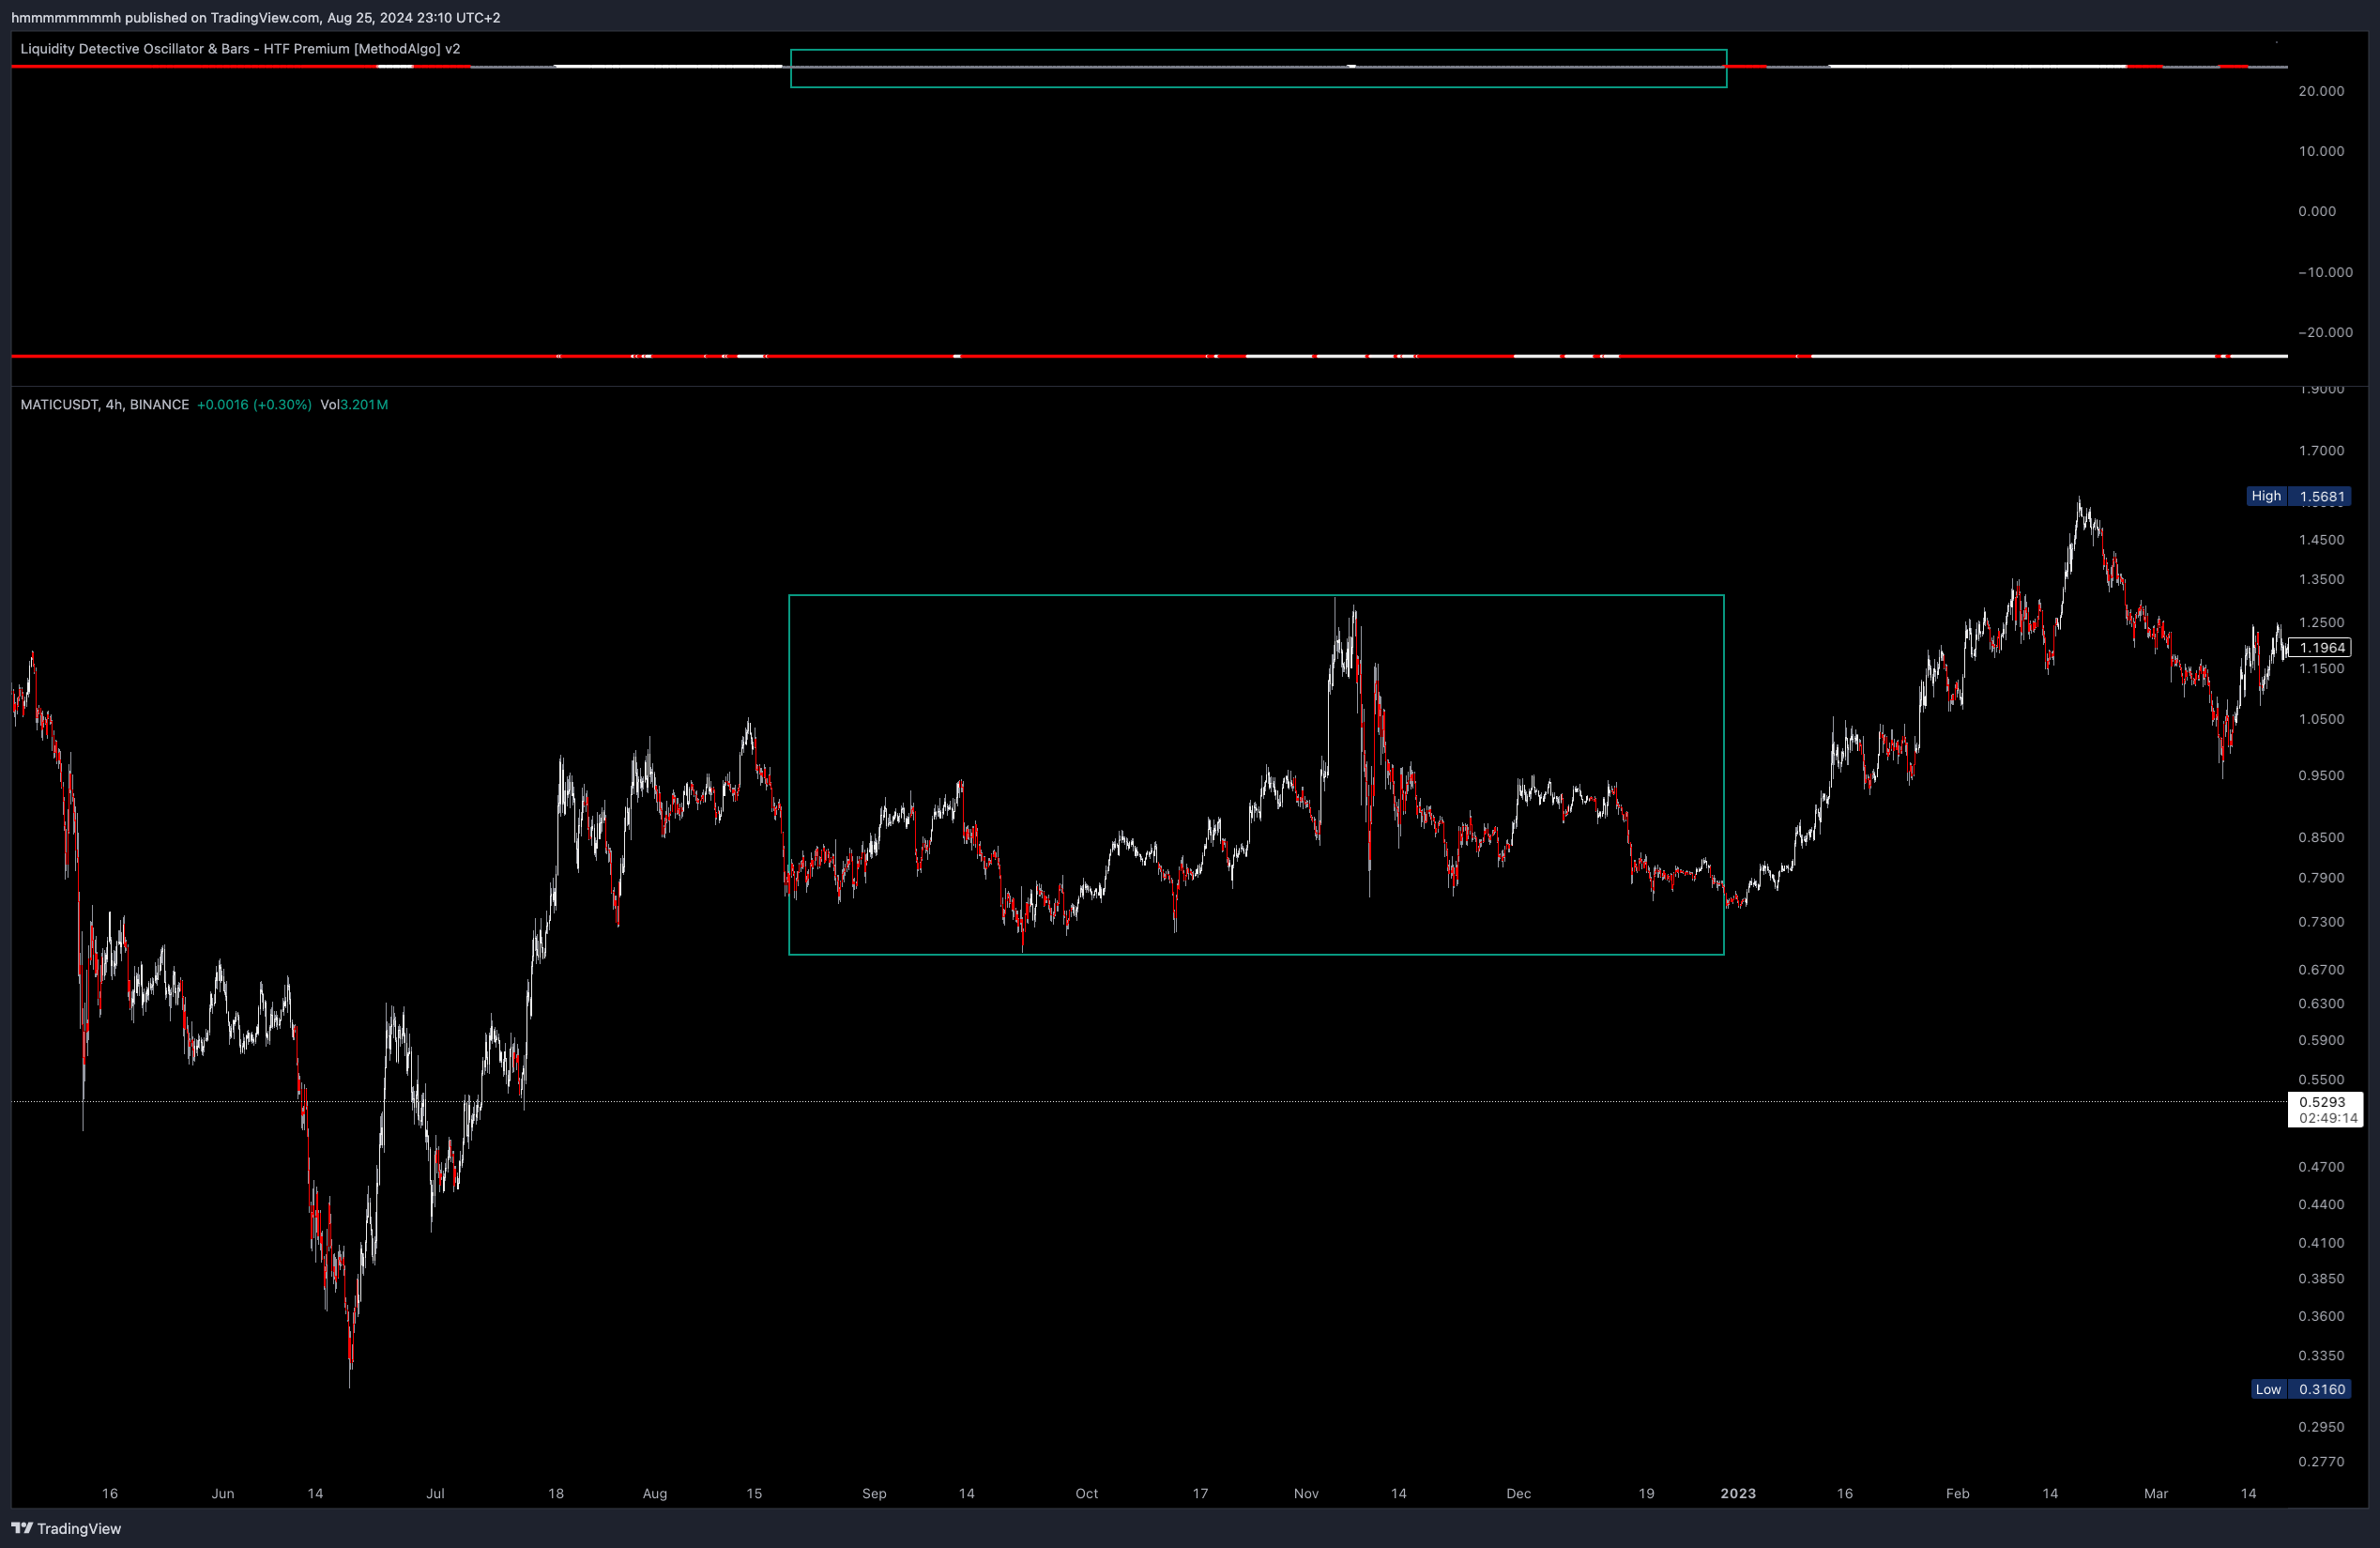
Utilizing Trendless Phases (Gray Lines)
During consolidation phases, prices fluctuate randomly within a narrow range.
- Some traders' strategies involve avoiding opening positions during these phases (such as breakout strategies). ADX is a perfect tool for identifying consolidation, as prices are unlikely to make impulsive moves during gray ADX phases.
- When the line shifts from bright to gray or to the opposite color, it is an early signal that the previous impulsive price movement has ended, providing confidence for reversal or swing trading strategies.
- When ADX shifts from gray to bright, it is usually passed the ultimate entry level. If your other analyses predicted the future direction after this consolidation, entering at Pivot low/high during this phase and waiting for the trend to arrive can offer more profit potential.
Parameter Settings
Toggle: Turn on theTrendlinefeature under theFeaturessection to enable or disable the display of ADX and trendline.Trending threshold: ADX's default threshold for confirming trends is20. Higher values provide more confirmed results (e.g., using at least 25 for breakout validation) but result in more gray lines. Lower values can capture more early signals, but it's not recommended to set it below 20.
Remarks
- ADX is primarily used to measure the strength of directional buying power. The main/bigger trend direction should be determined using the lower
Trendline. - When ADX shifts from bright to light, it should be interpreted as weakening strength rather than a trend reversal signal.
- A continuously bright ADX line indicates increasing trend strength, allowing traders to let profits run rather than close positions early.
- When the ADX line is gray and dotted, it usually indicates a consolidation phase, where both buyers and sellers agree that the current price level is fair. This price level can be considered as potential support or resistance in the future.
- Entering during gray dotted ADX lines is allowed but not ideal. Prices will only start to rise or fall when the ADX line turns bright. Without trend strength, price movements are minimal. If you have other tools signaling a bias, the gray dotted ADX line isn't a negative factor. If no other analysis provides a bias, avoid entering during this time.
- If the
AutopilotTFfeature is enabled, the ADX uses data from a time frame that is twice the current chart's time frame, which can be customized. - The ADX and trendline horizontal lines also serve as threshold lines for the overbought/oversold regions of
CycleWavesandRSI.
The engineers at MethodAlgo are proud of their work, but it's essential for you to understand that no indicator / algorithm can guarantee perfect success. Trading profits and losses are greatly influenced by the trader's psychology, knowledge, experience, and risk management.
The algorithmic interfaces we provide are all part of T.A.T.A. When trading in reality, traders should make their decision like T.A.T.A, considering various factors and signals from other tools to establish confluence system.
Any unclear explanations or errors in this tutorial? Please contact MethodAlgo's @Staff on the Discord Trading Terminal for corrections.