Strategies
Pinpointing and Sniping
The number and density of liquidation lines shown by Grim Reaper vary between different trading pairs because of differences in liquidity volatility and market volume. However, the relative attractiveness of liquidation lines to the price remains unchanged.
Traders can compare different pairs to discover attraction preferences for liquidation lines at different leverage levels, considering market cap and liquidity volatility:
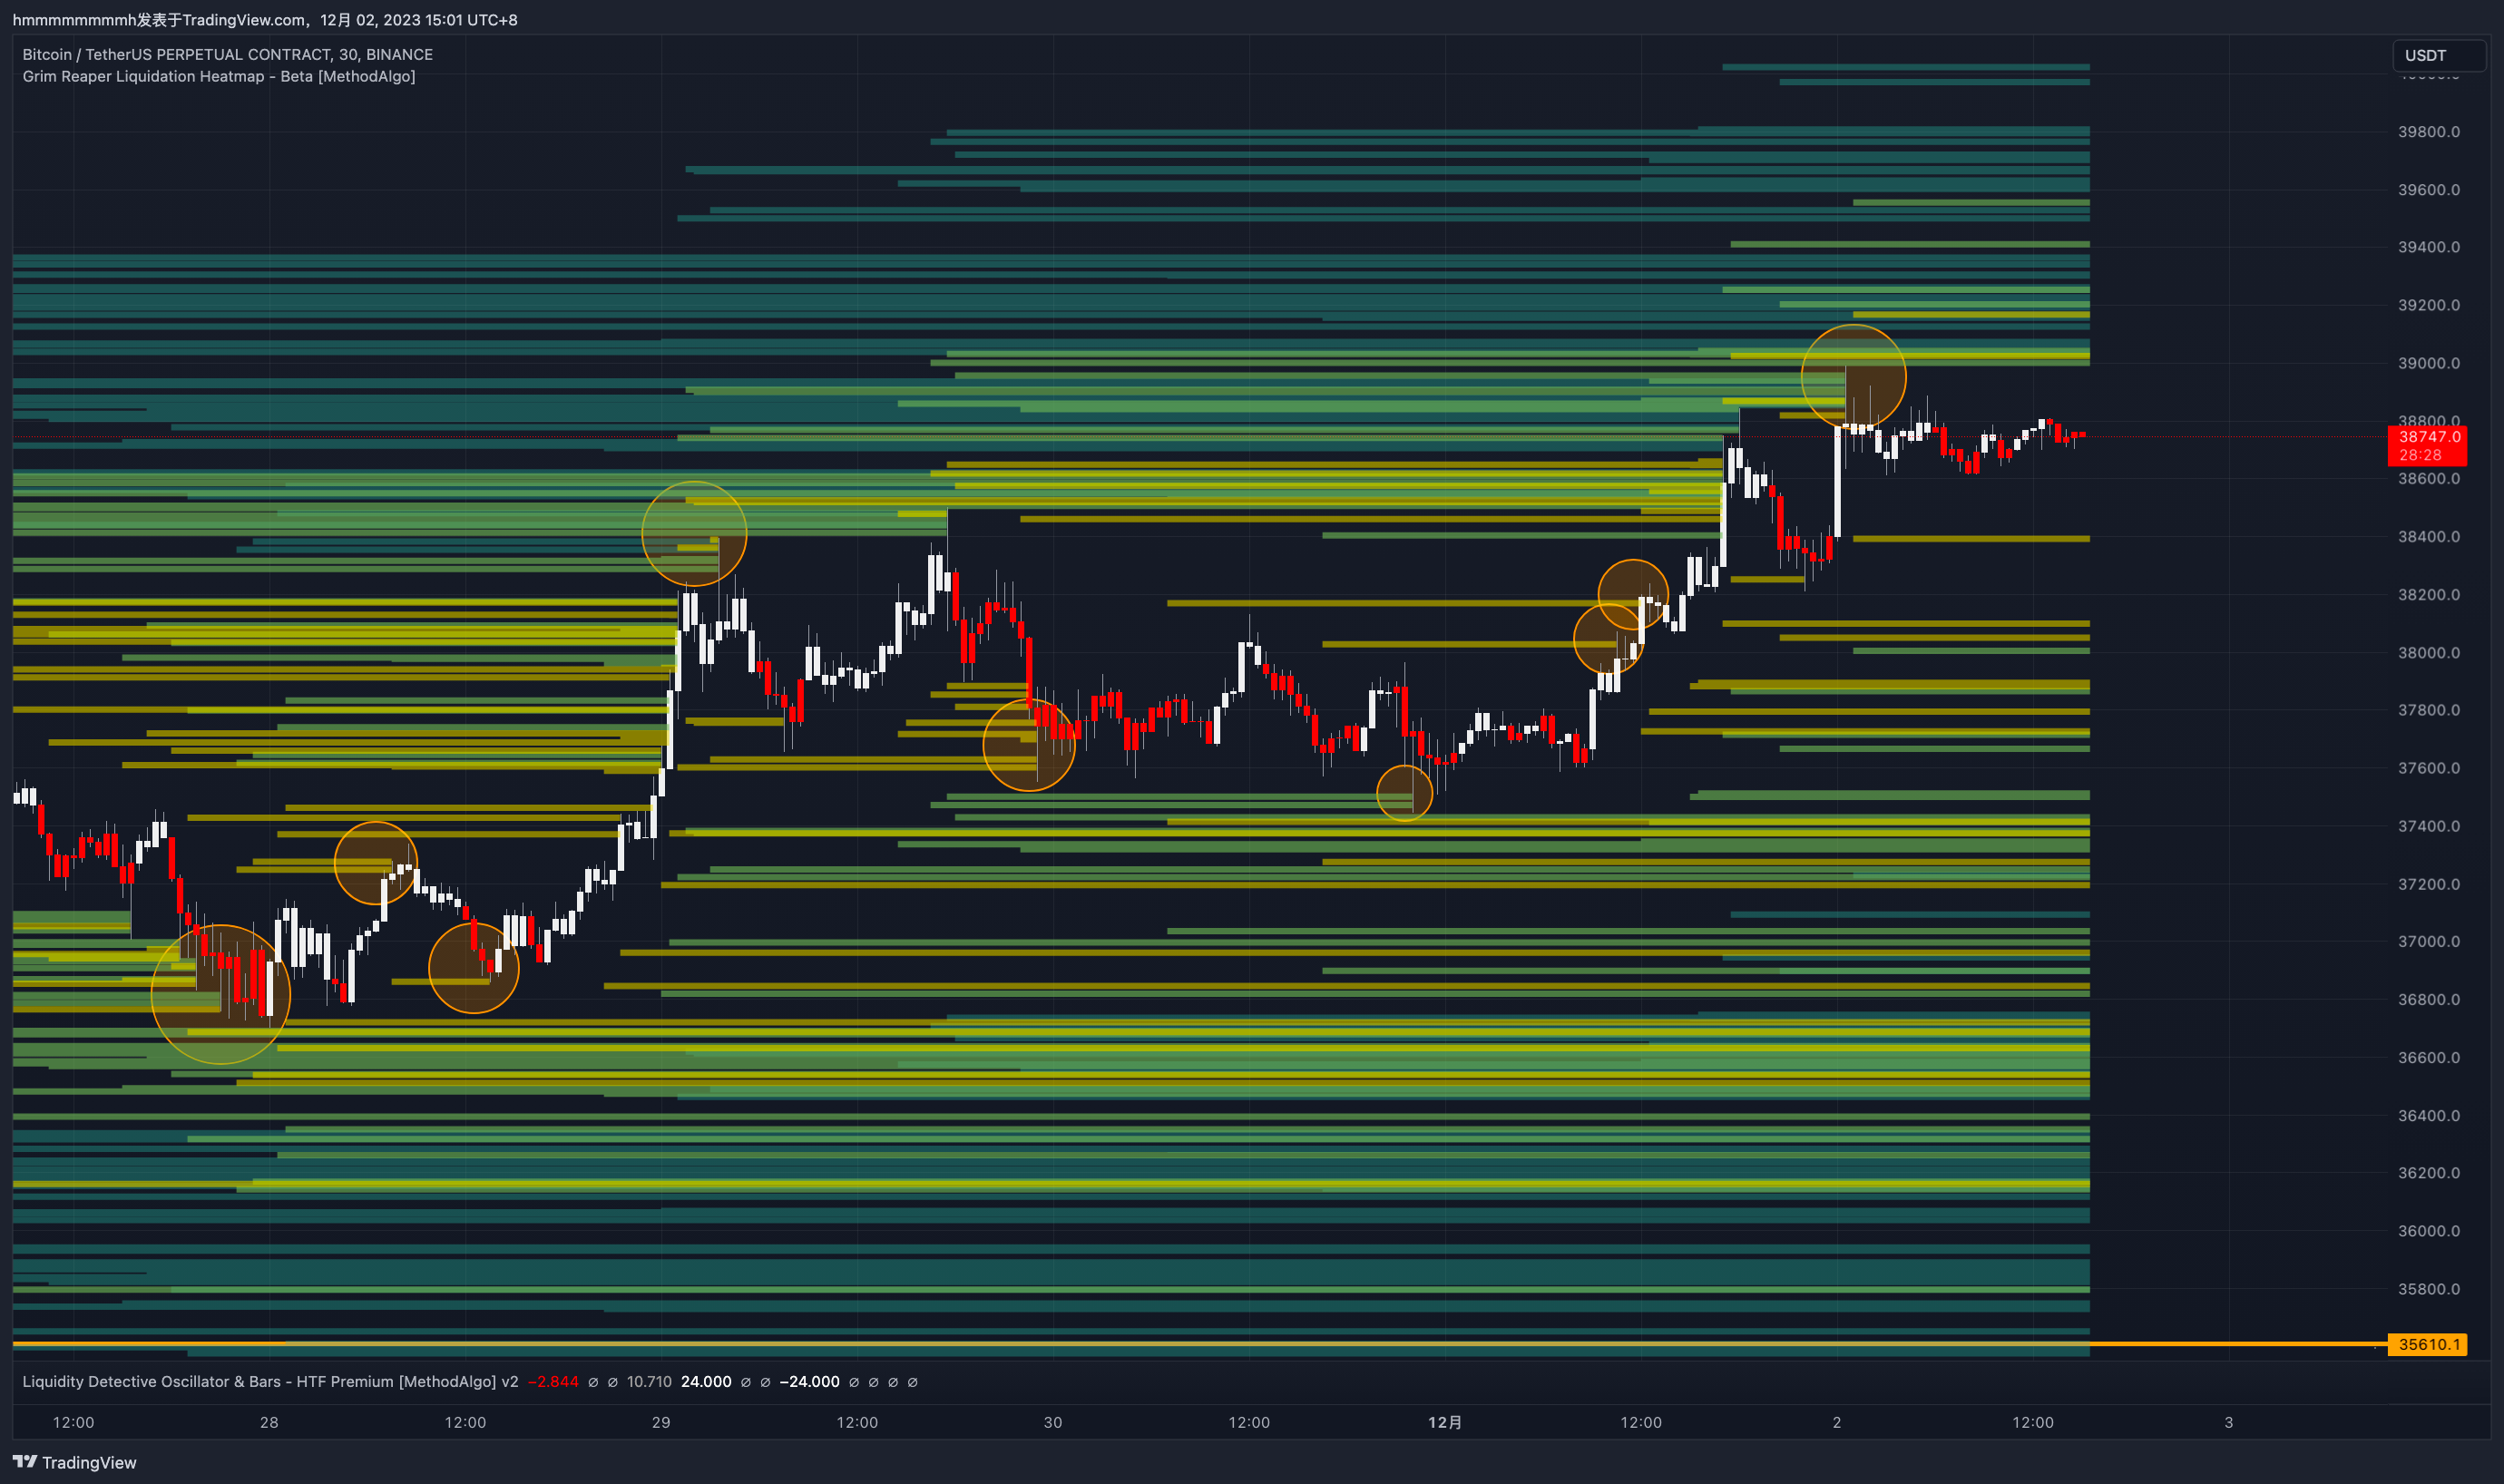
- Large market cap pairs like BTCUSDT often disregard blue lines (10x leverage) , and likes to clear for yellow lines (100x leverage).
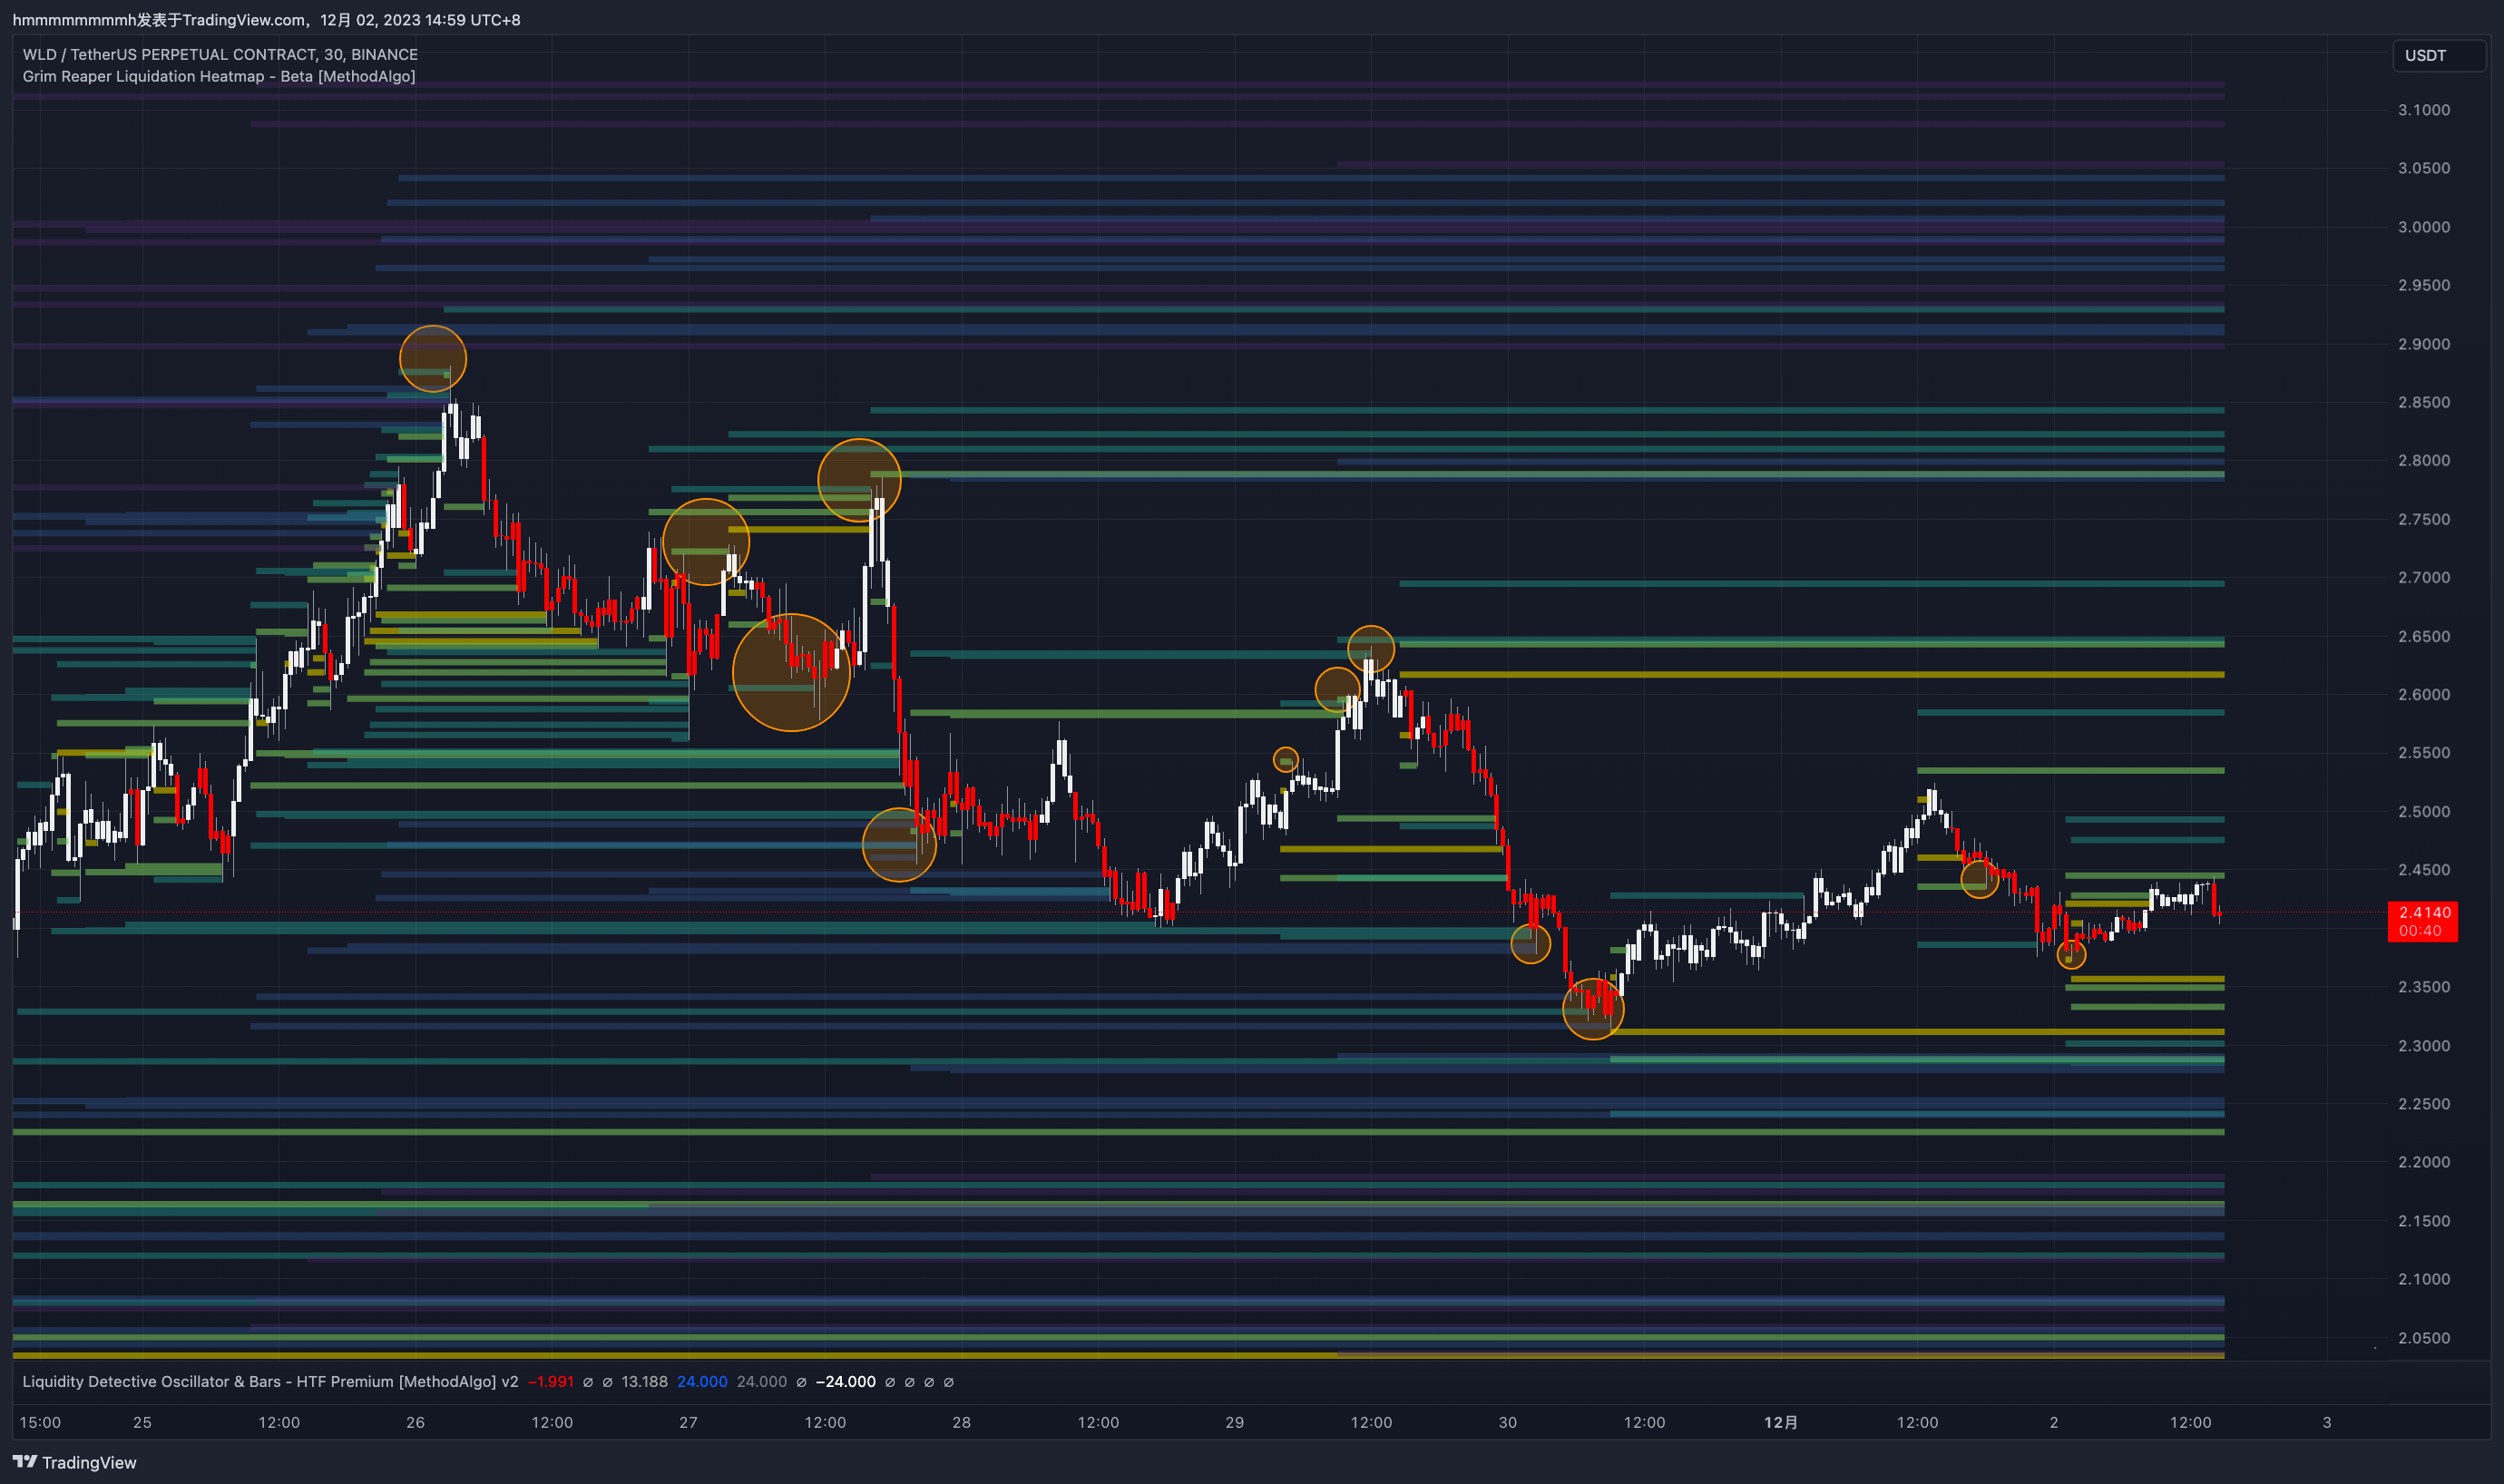
- Low market cap pairs with like WLDUSDT often like to maximizing their trading volume, and clears much as they could, so blue lines (10x leverage) levels are favorable on the chart .
Pairs without high leverage will still show liquidation lines exceeding the exchange's maximum leverage. For example, CELOUSDT on Binance supports up to 25x leverage, but it will display predicted 100x leverage liquidation lines in yellow. These lines appear because significant fluctuations in new open positions have been detected. Think of it like this: 100 traders entering 20x leverage trades can have a similar liquidation price level to 20 traders at 100x leverage. Since these are market orders, their impact on the market price is similar. Traders can consider these high-leverage predictions as indicators of the Pain Levels traders endure when incurring losses. Furthermore, the attractiveness of liquidation lines to the price also depends on the strategies of market makers and whales, adding multiple factors to consider.
Gaps
Support and Resistance
Support levels prevent further price declines, while resistance levels prevent further increases. Each MethodAlgo tool has different concepts for support and resistance, which can be based on trading volume, specific price actions, or unique algorithms. Regardless of the condition, they all align with the core concepts.
Support and resistance confluence provided by Grim Reaper is price levels without liquidation lines, also called liquidity gaps. The principle is that price ranges without liquidation levels require substantial market orders to move prices up or down, which market makers and whales avoid doing. Thus, it is reasonable to expect the price to:
- Halt further movement
- Reverse, triggering opposite liquidations
- Consolidate, attracting new market liquidity, eventually filling the vacuum with new liquidation levels/lines before resuming movement
Gaps Near Price
Vacuum ranges near the price are also liquidity gaps. Following significant moves, prices tend to be in trendless states within these gaps, often consolidating to attract new liquidity and determine subsequent direction.
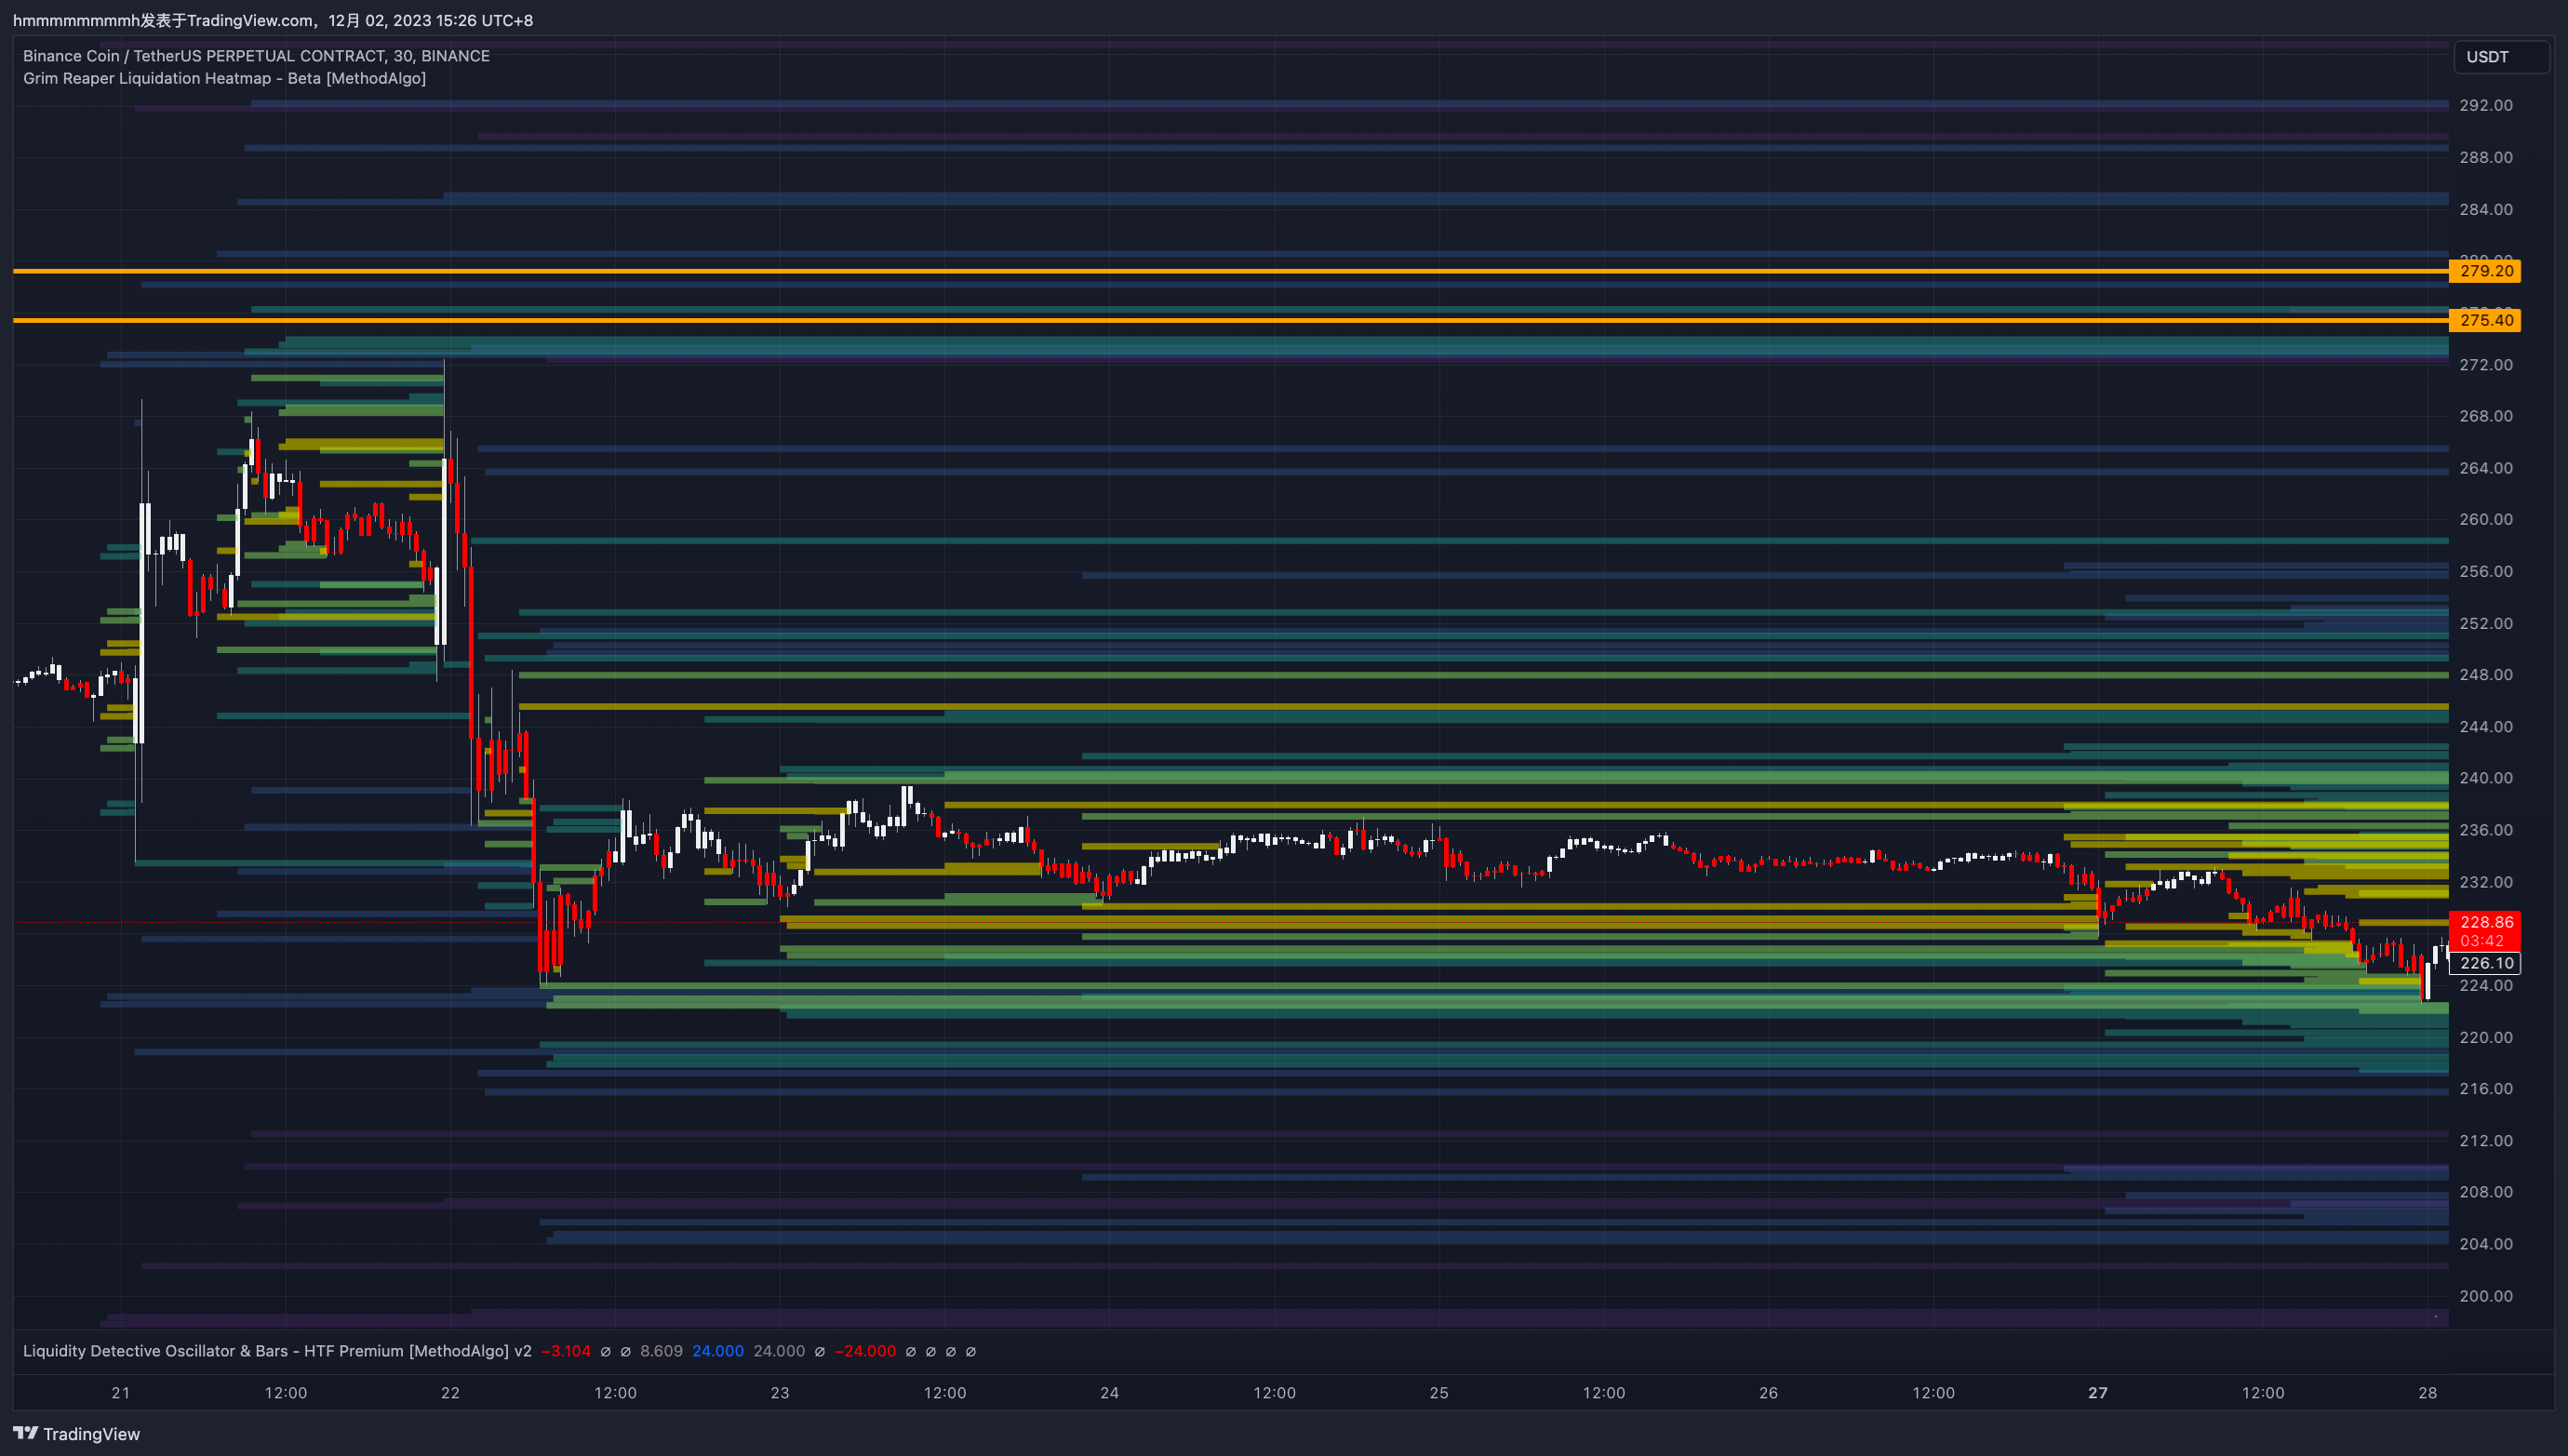
The case below shows BNBUSDT on 23-12-21 at 6 AM and later. After a major spike and dip due to DOJ and CZ's $4 billion settlement news, key liquidation positions on both ends were cleared. Such significant moves attract numerous traders, leading to consolidation and betting, determining subsequent trends. The news was both positive and negative, so the liquidation levels of incoming trades were balanced, making future price directions equally probable.
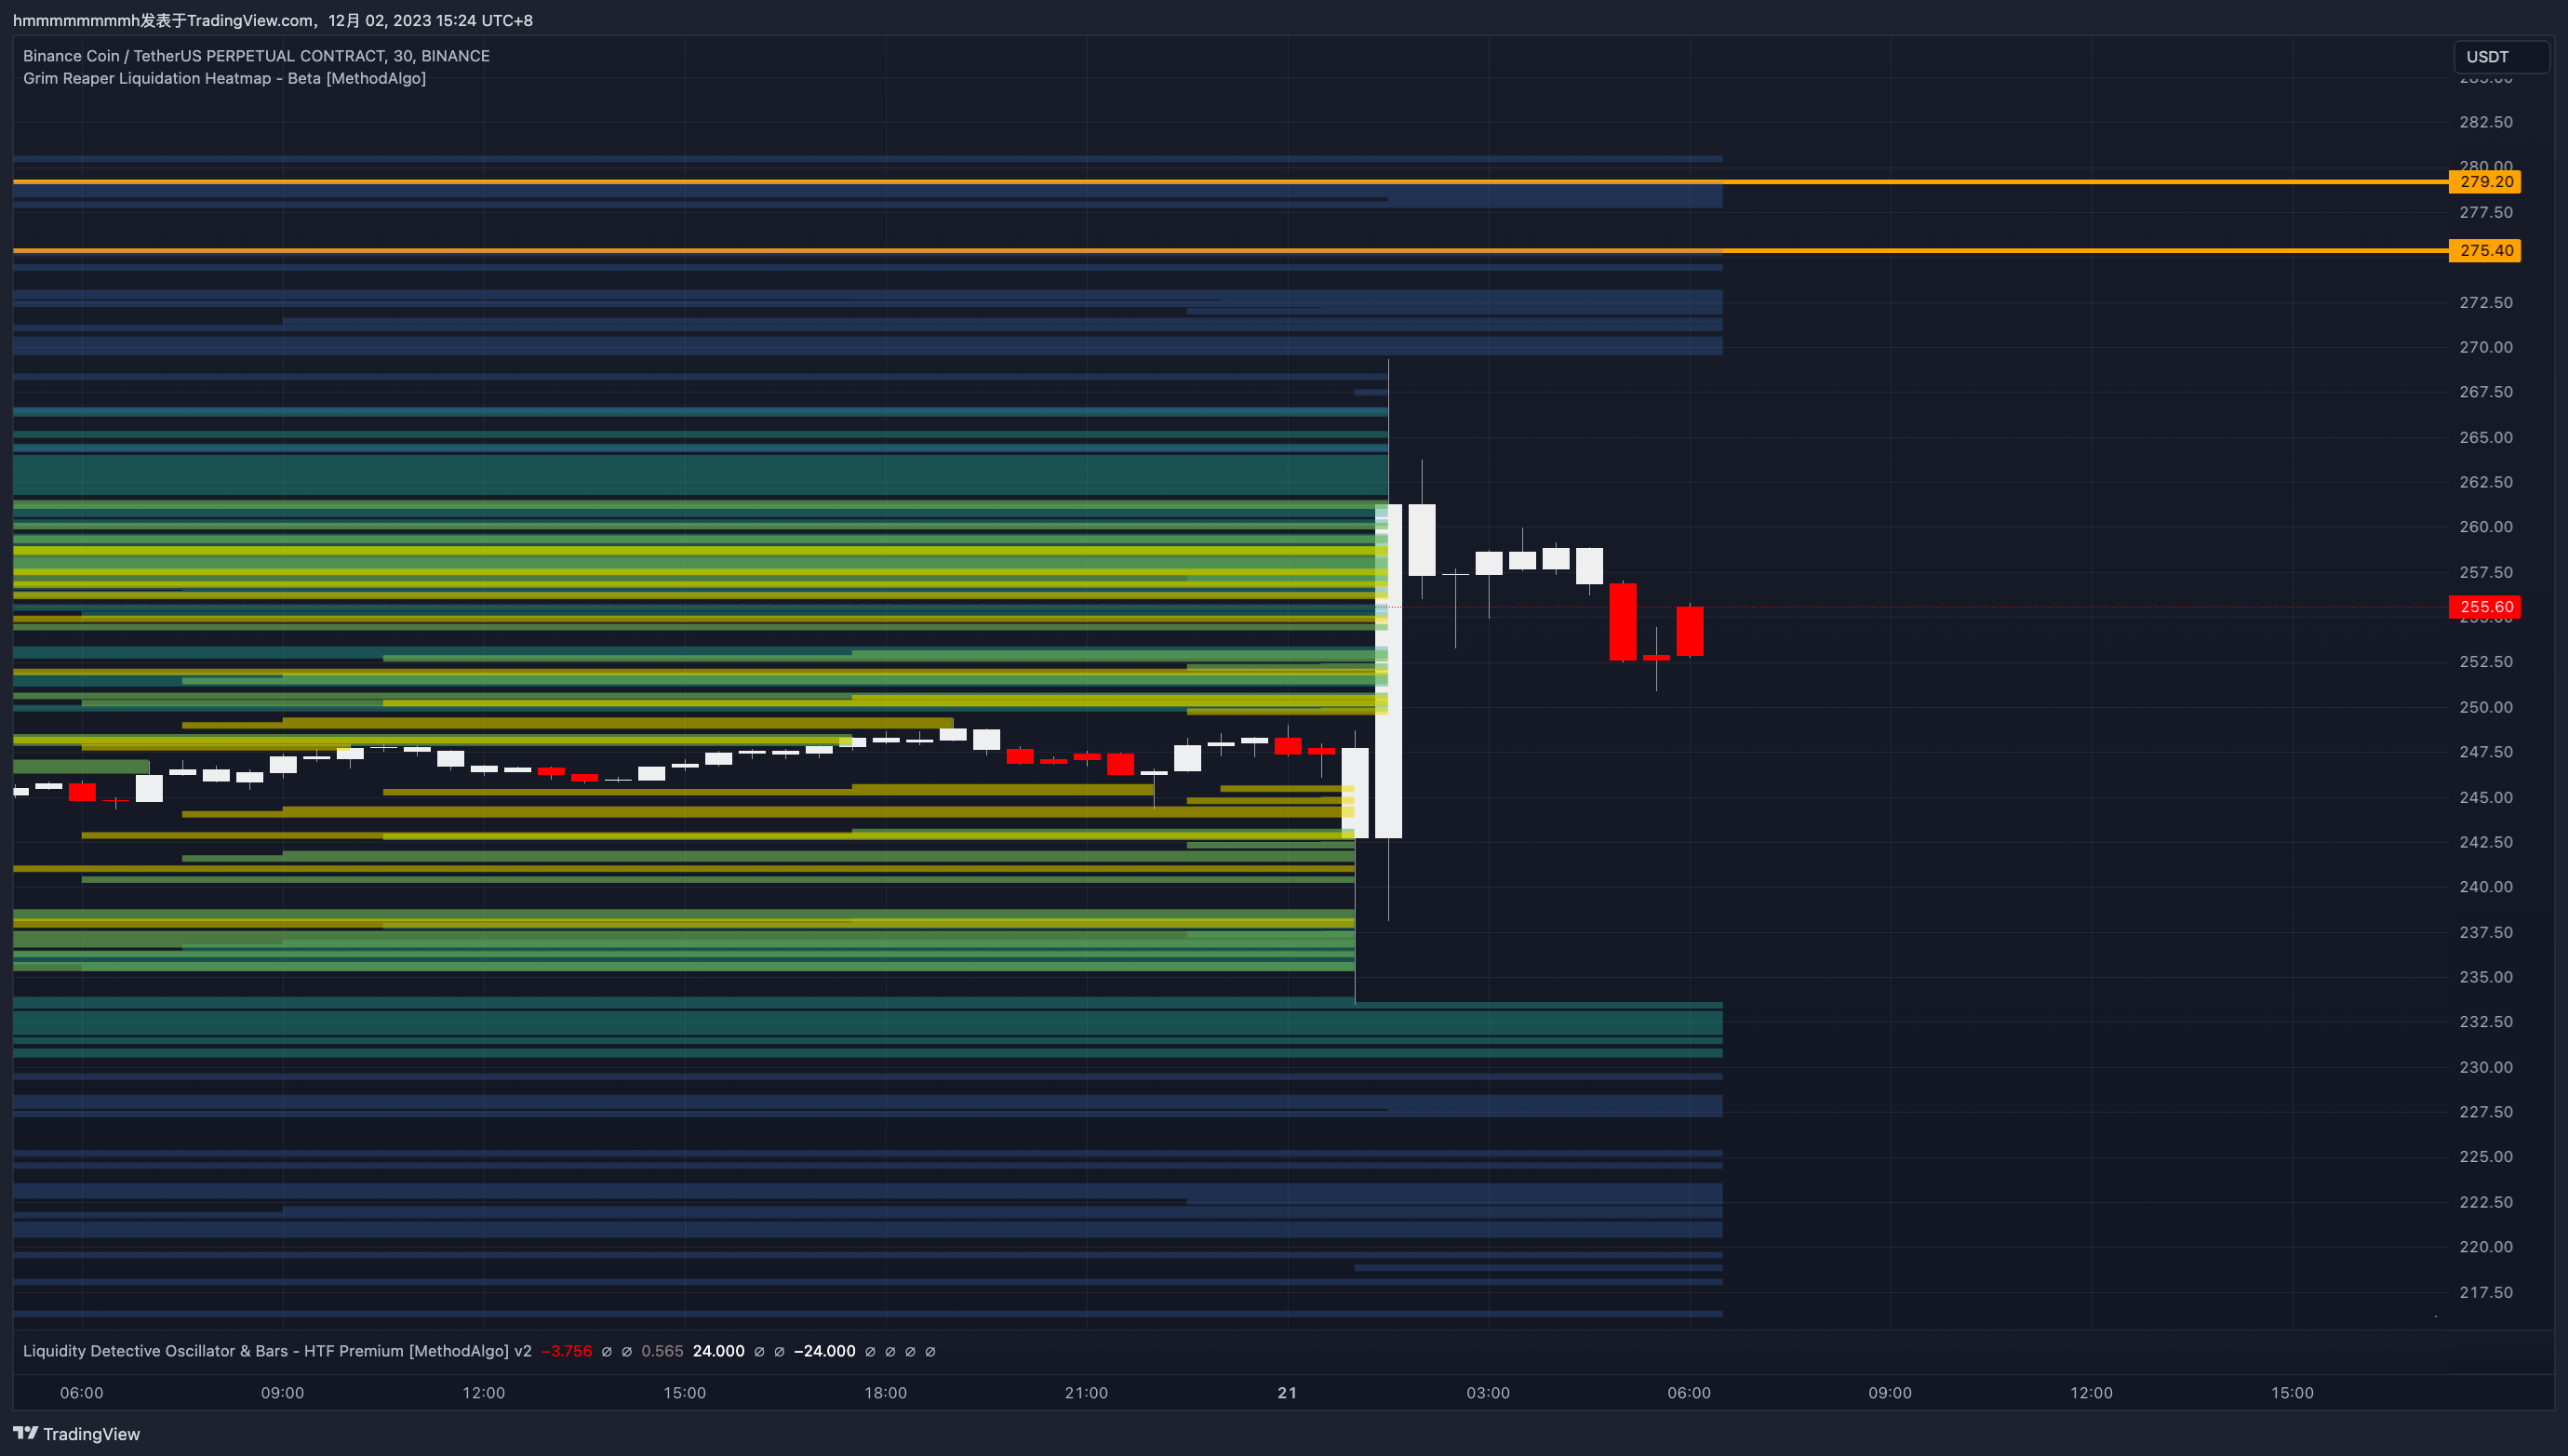 BNB Chart 1
Liquidity Equilibrium
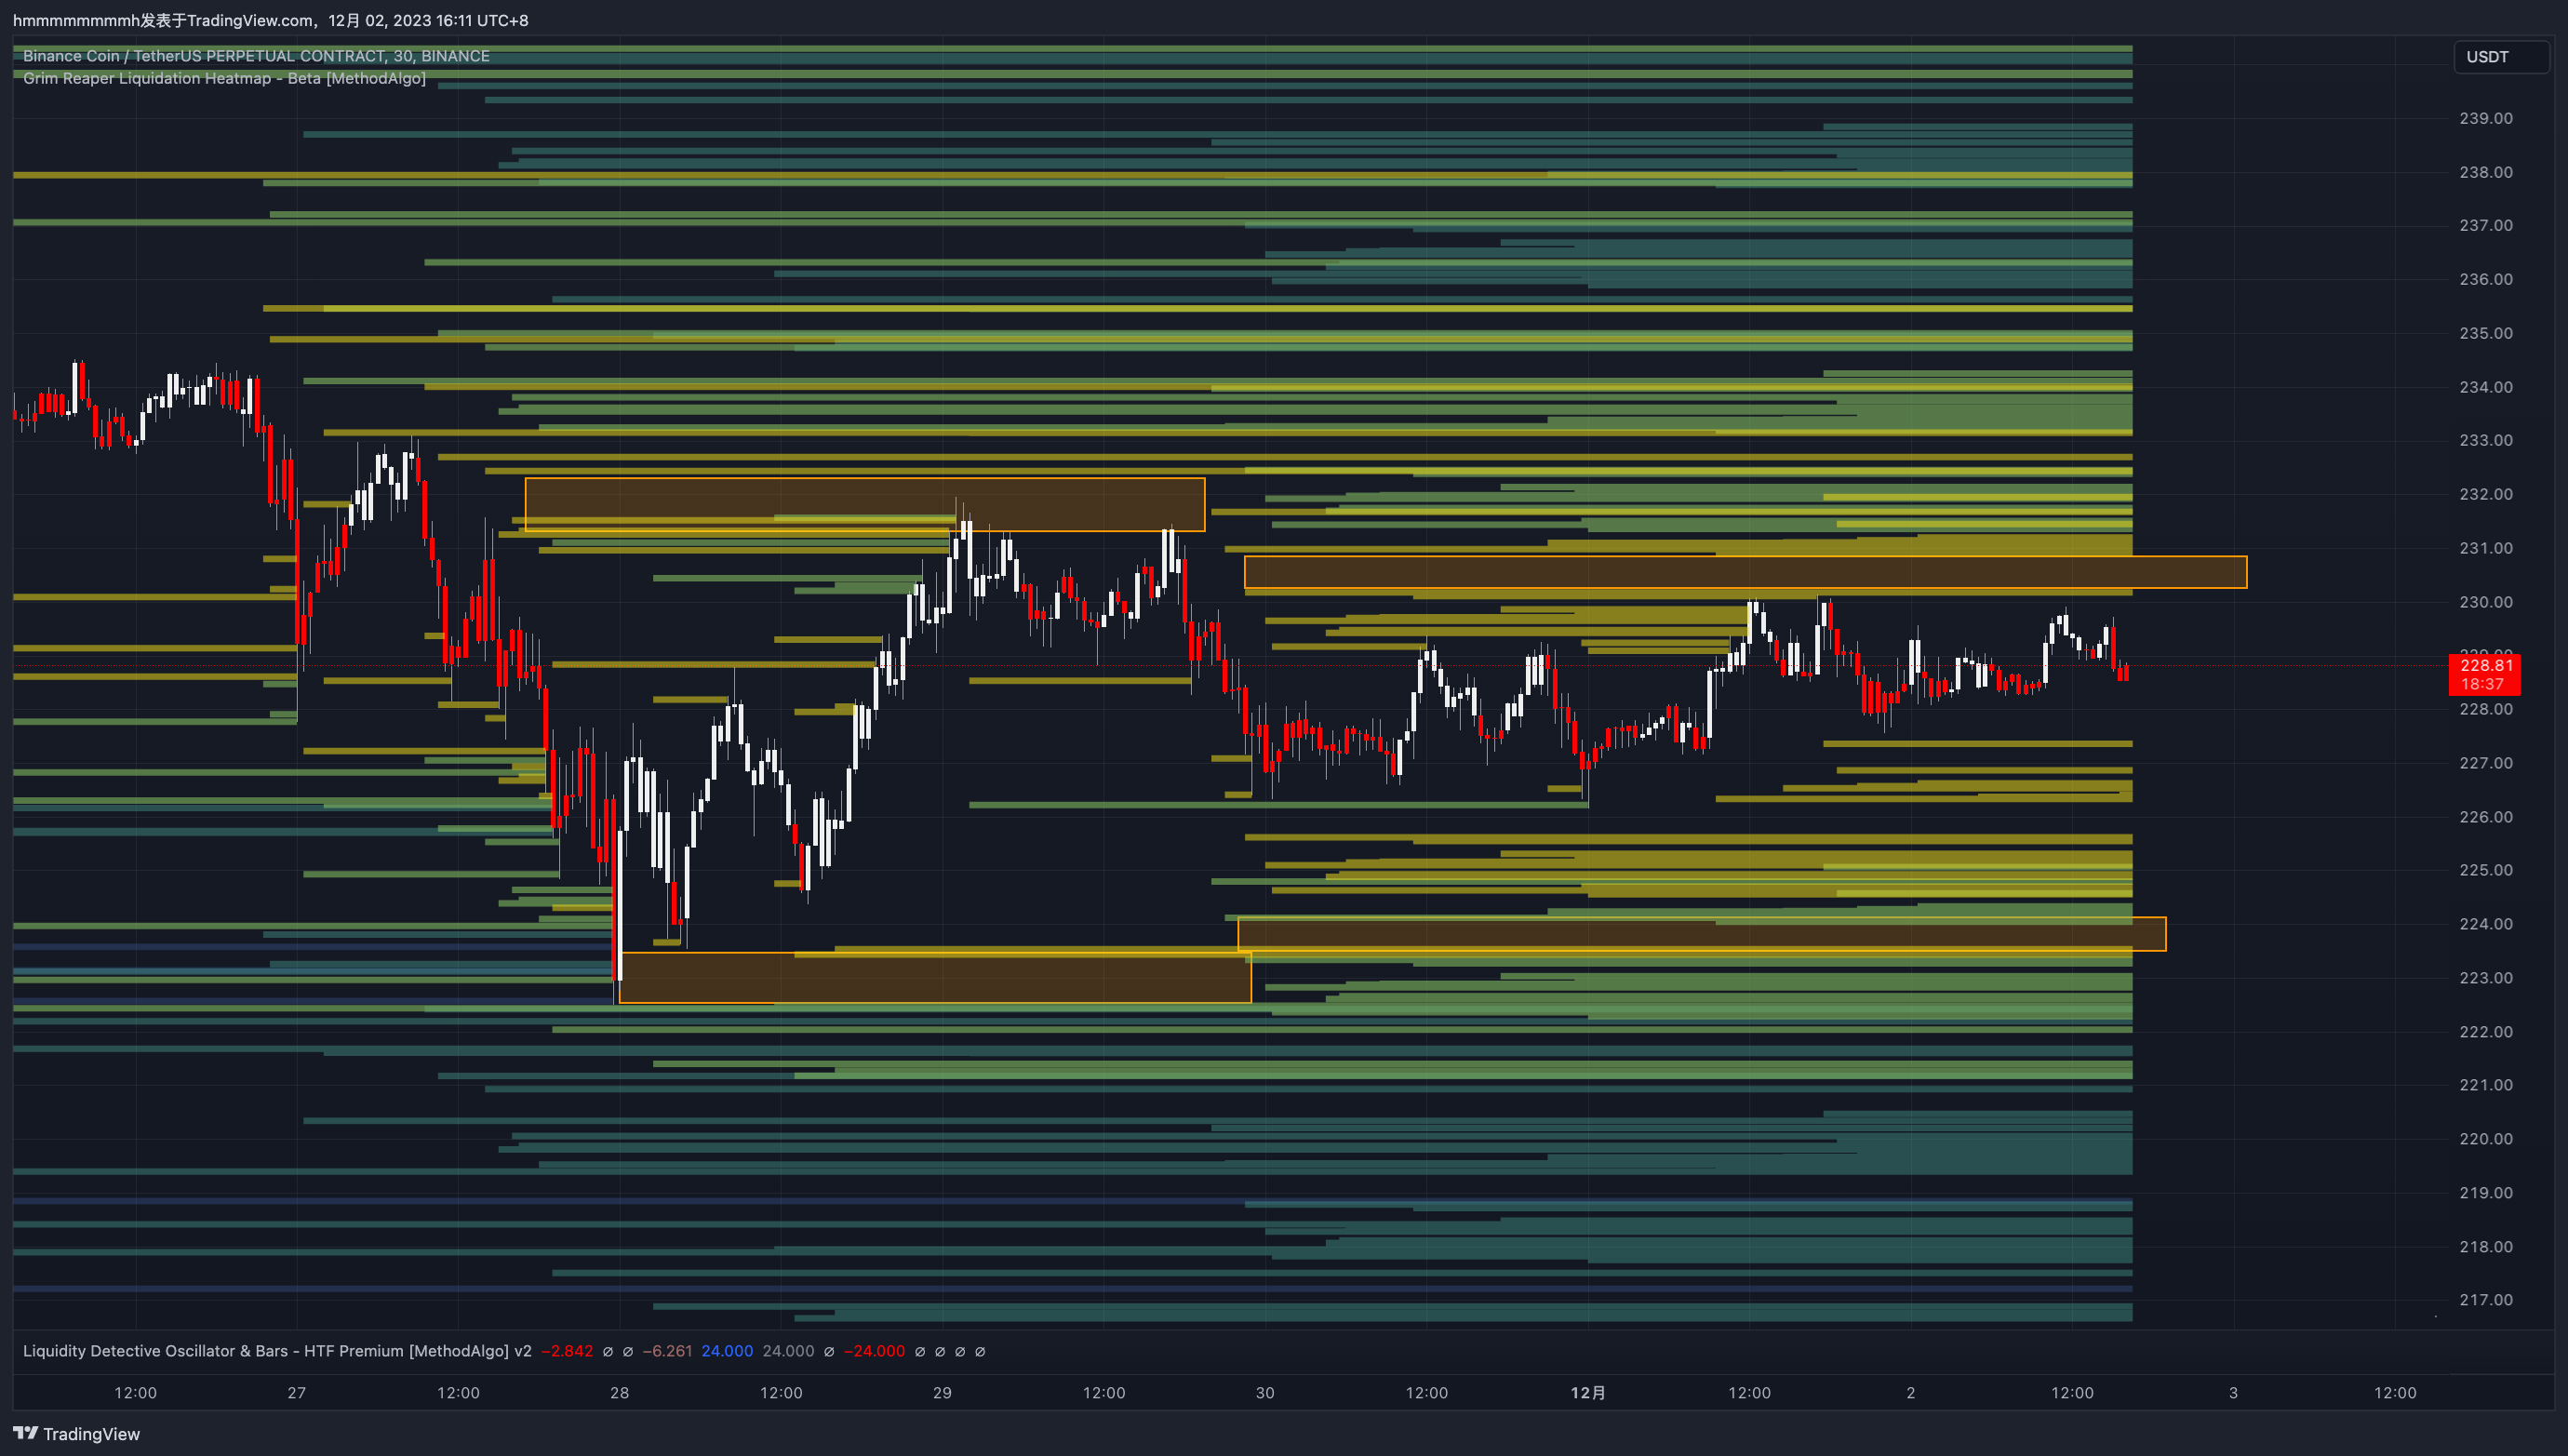
The chart below shows the second significant spike and dip following the initial move in BNB.
Initially, the price cleared lower long positions, accumulating liquidity above the price as short positions increased. The market then liquidated the upper short positions. As both sides were cleared, market sentiment became cautious.
Finally, BNB started to range sideways, achieving a state favorable to market makers (liquidity equilibrium). During liquidity equilibrium, future price movements are equally probable, as it could be either accumulation or distribution. with the market makers holding the initiative. This state allows those with substantial holdings to trigger trends with minimal cost, regardless of direction.
Grim Reaper does not provide trend bias when market in this state, it only indicating trends when imbalances occur, which in the end of below chart. we can assume price will aim to heavy & dense upside.
 BNB Chart 2
Strategies
Given that liquidation lines are symbols for substantial liquidity, prices are naturally attracted to these levels. Also, liquidity gaps can halt further price movement. Traders can develop strategies based on these principles.
High-Volume, Favorable Price Execution
Set entry or take-profit limit orders at major liquidation levels. Utilize the surge of market orders during liquidation events to ensure quick execution, avoiding partial fills or slippage from market orders and iceberg orders.
Take-Profit Levels
Refer to the Pinpointing and Sniping section for examples. Setting take-profit targets at 25x or 50x liquidation levels increases the likelihood of execution, especially below gaps, preventing near-misses or missing larger profit opportunities.
Stop-Loss Levels
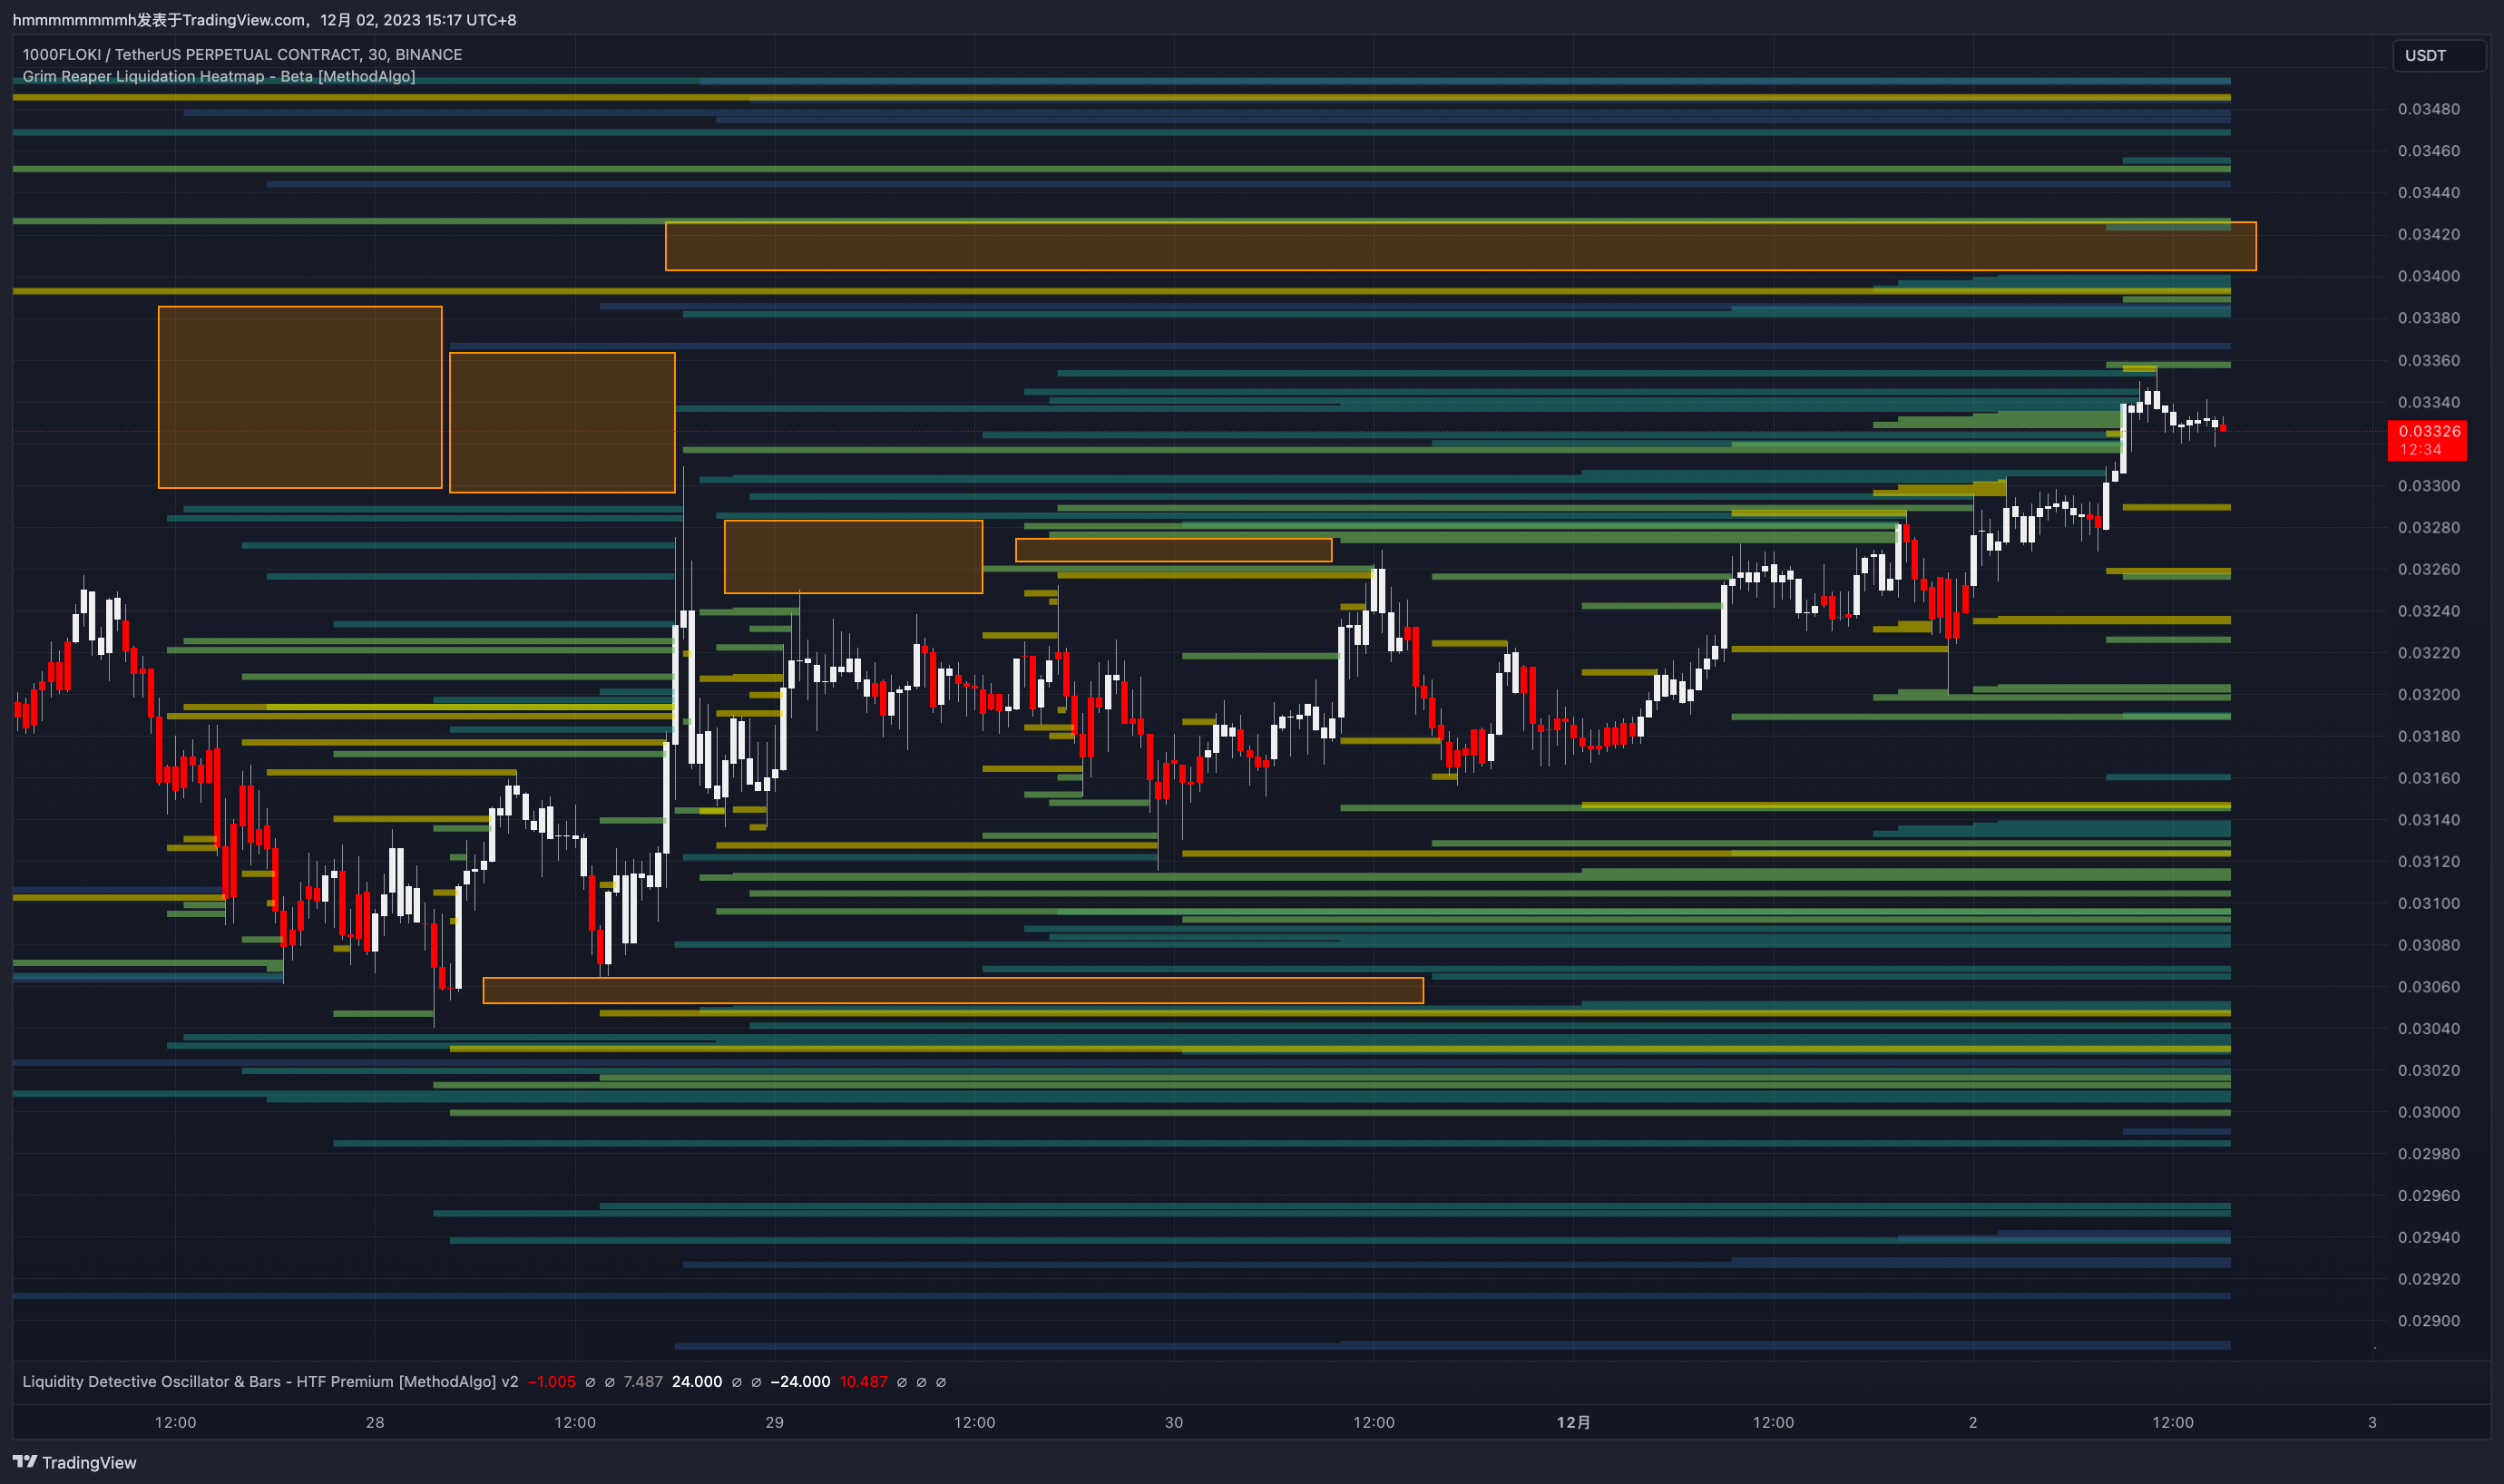
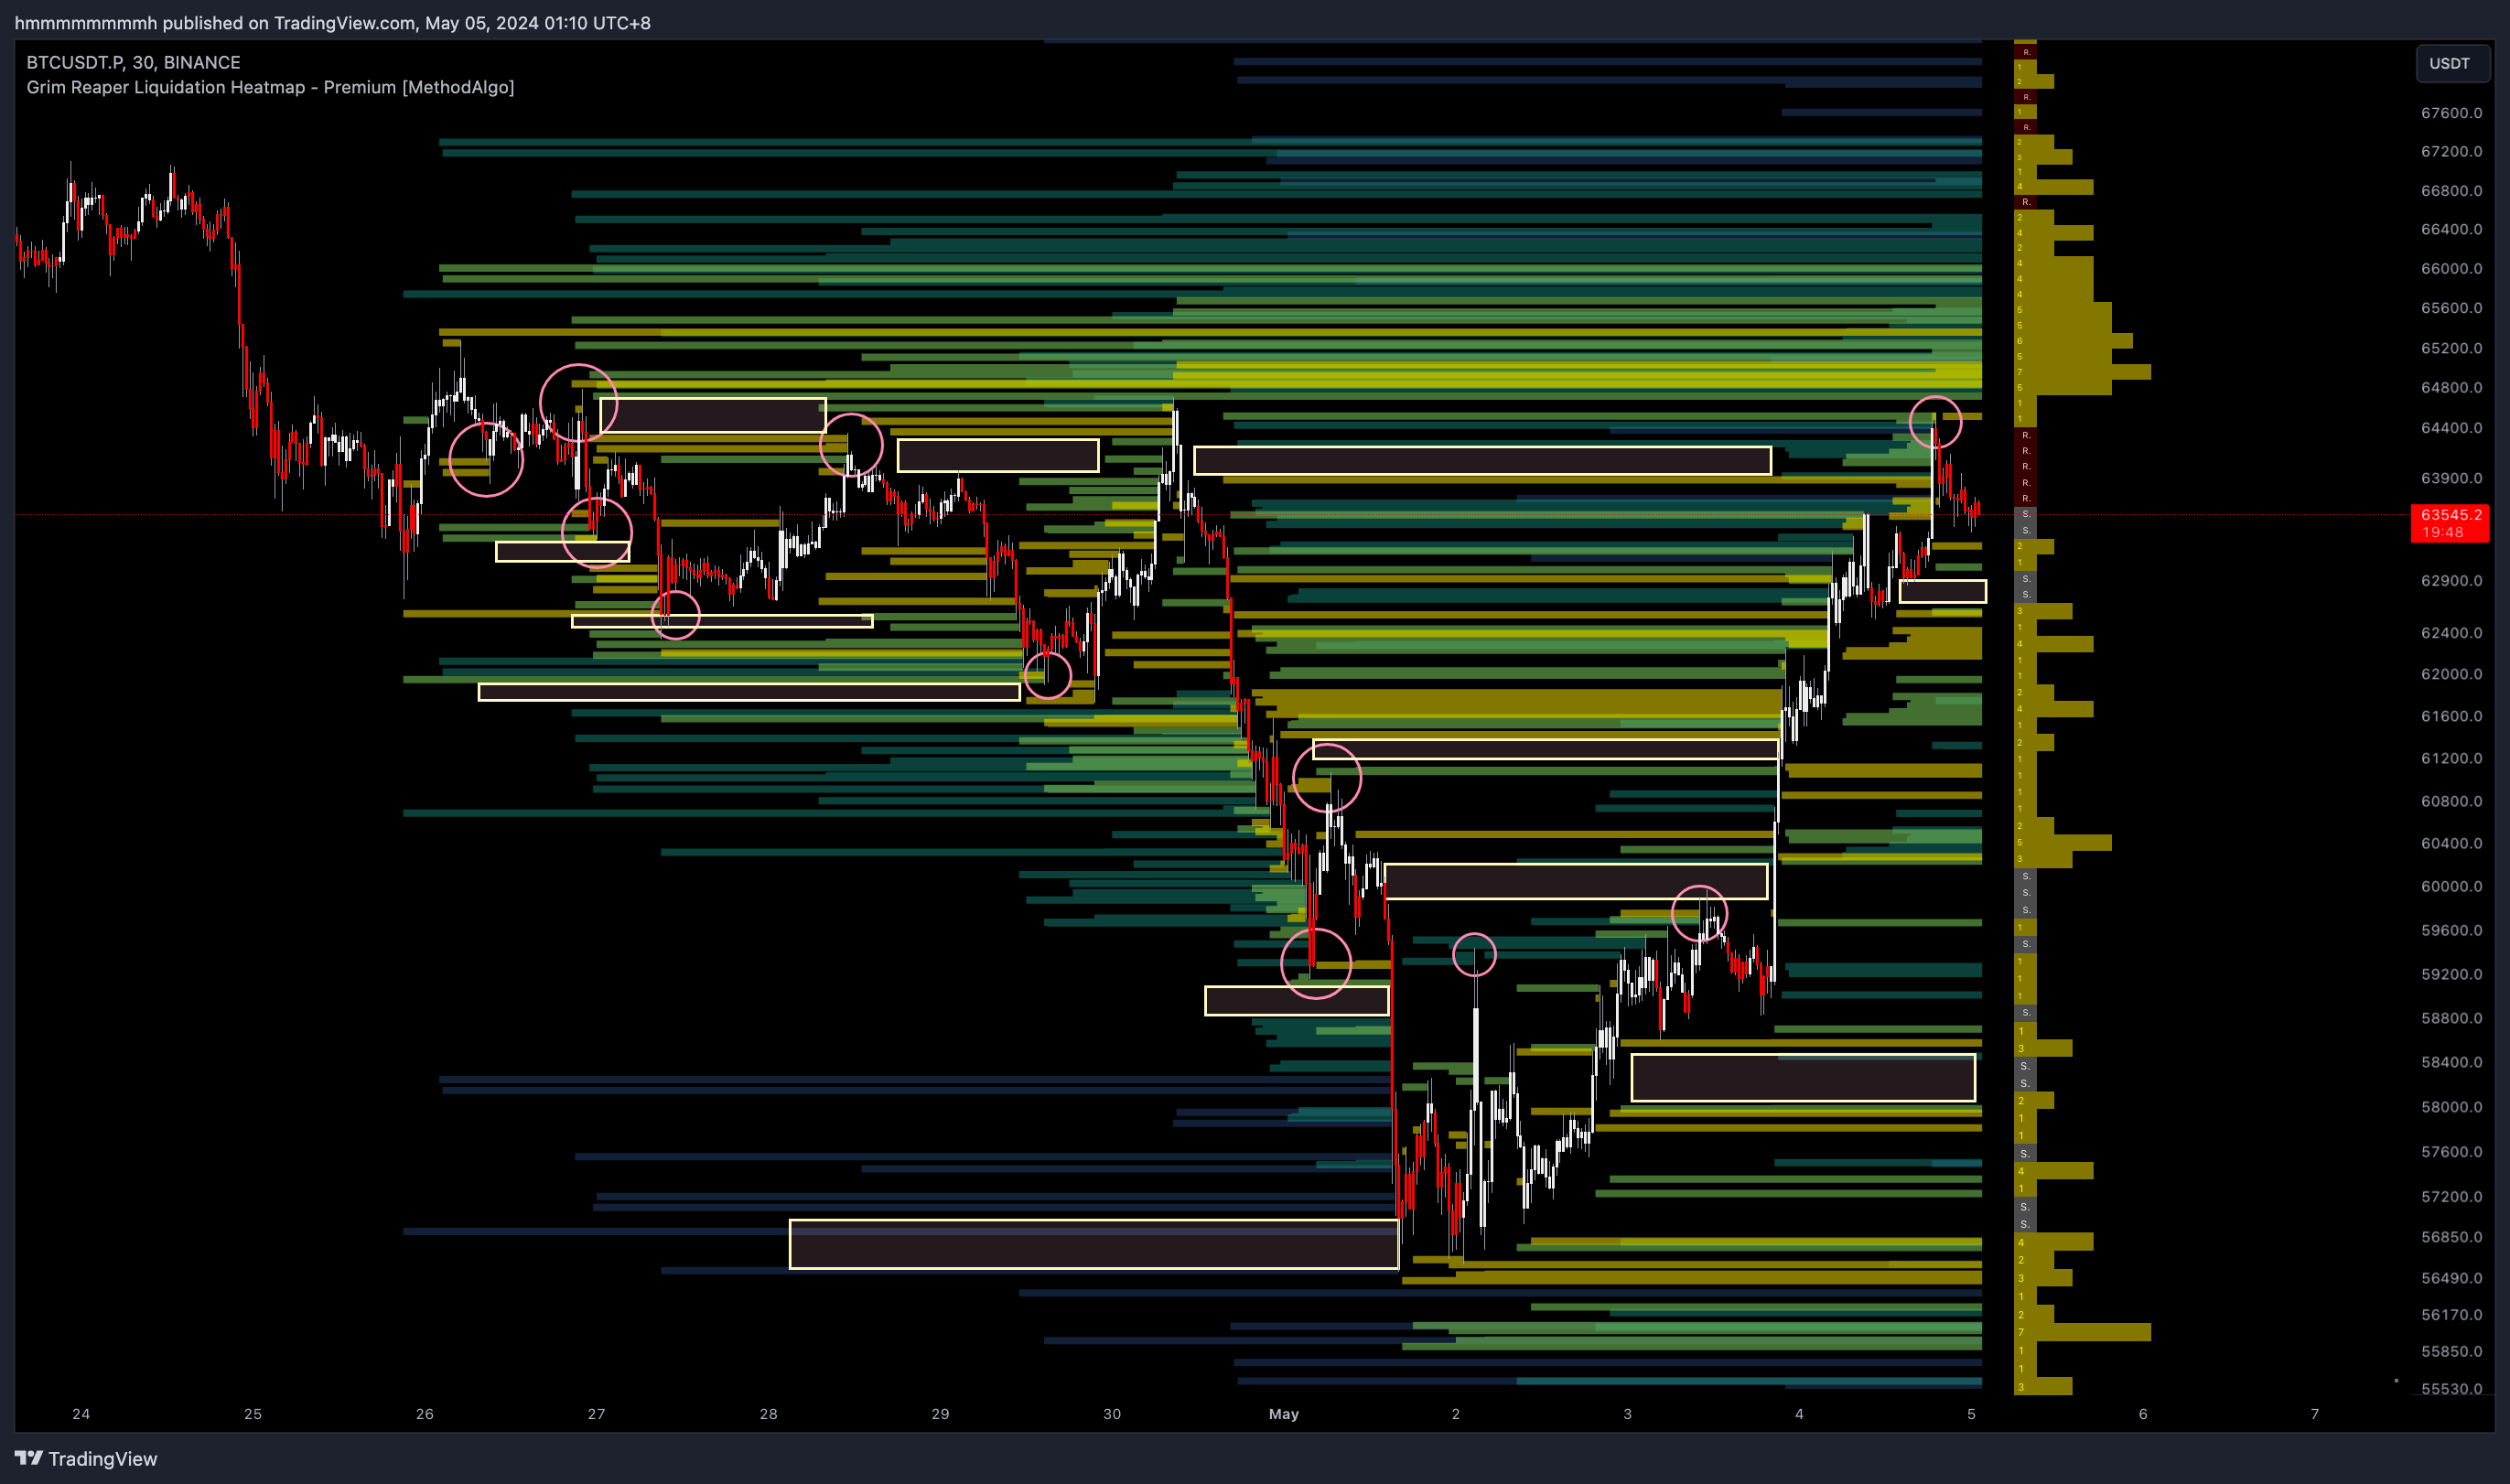
Refer to the Support and Resistance illustrations and the image below to use gaps as stop-loss references.
Grim Reaper's core is dynamic support and resistance, with liquidity being non-static and changing over time. When using gaps for stop-loss, monitor the chart closely to account for new liquidation lines filling observed gaps. Since gaps provide dynamic support and resistance based on liquidity, the strength of these levels also depends on other factors. Confirm the strength of support/resistance with at least one other tool during analysis.
The illustration below highlights some gaps and pin-point areas. Observe and verify additional rules about gaps:
- Once gaps are filled by new liquidation lines, they become attractive for price movement instead of preventing it.
- Larger gaps are more effective.
- Strong trends can break through small gaps.
Trend Reference
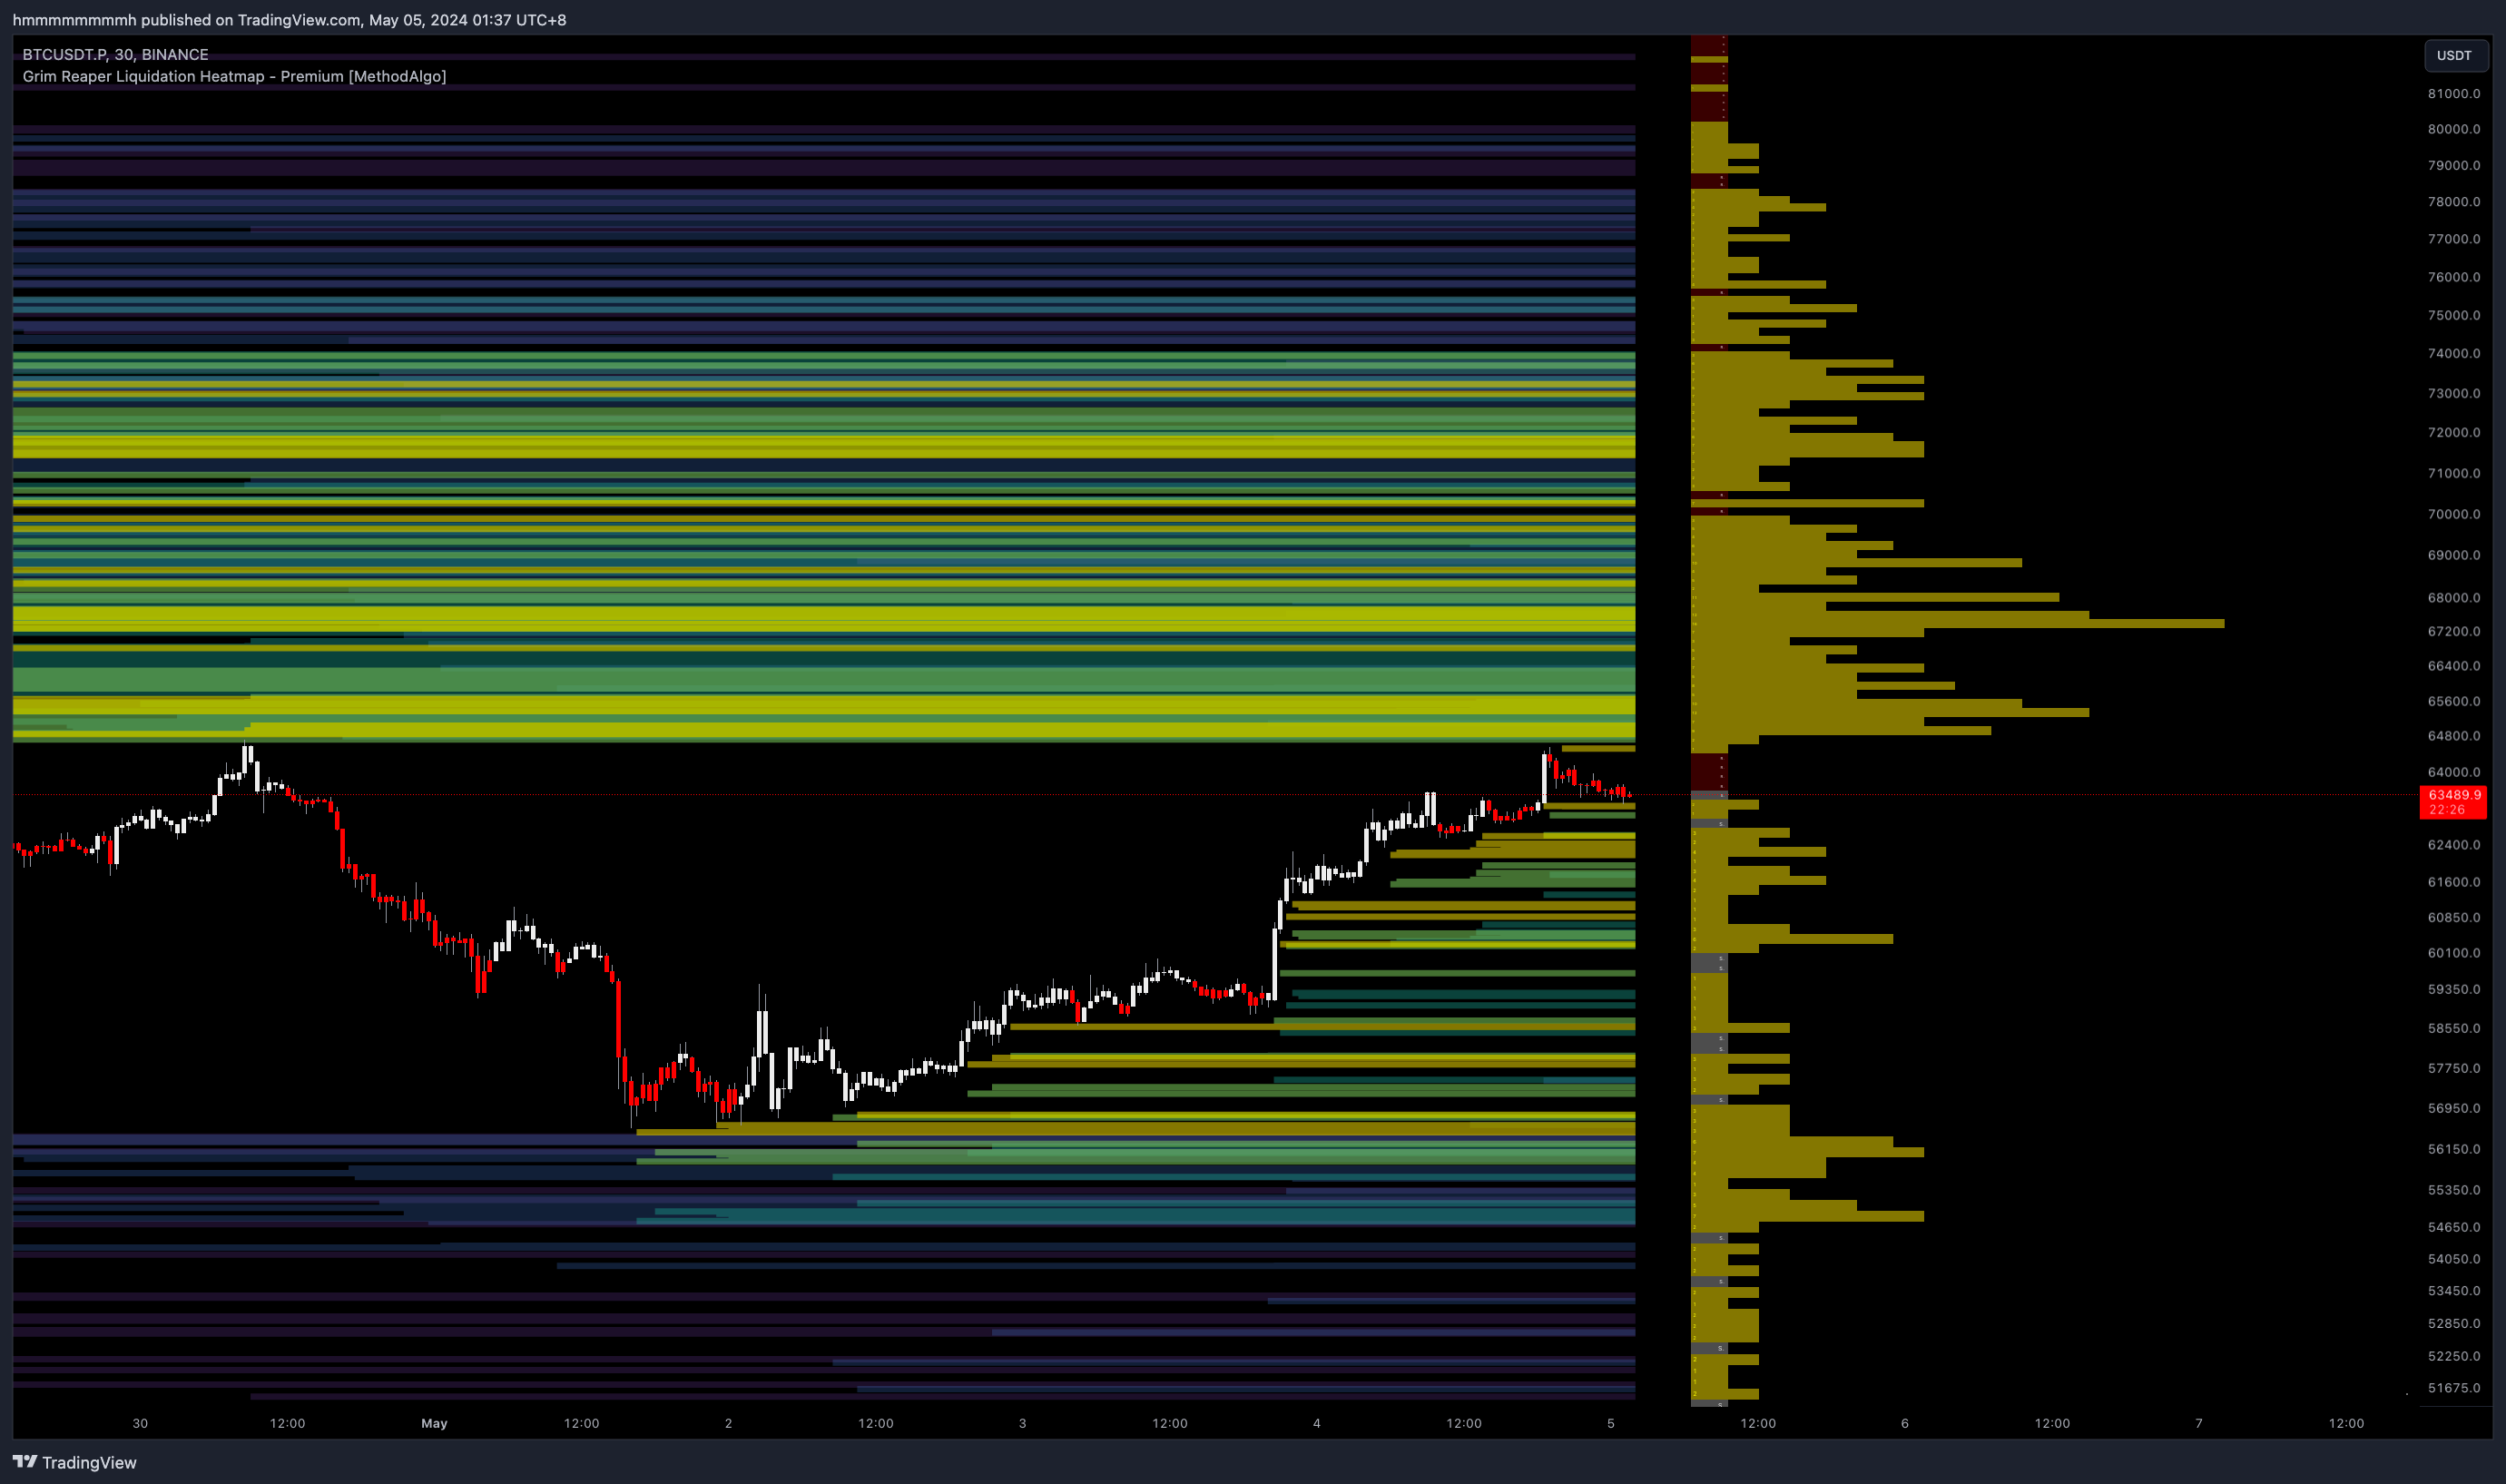
As introduced in Signals and Patterns, prices tend to move towards brightly colored (hot) and densely packed liquidation lines. When one side has significantly denser and brighter liquidation lines, prices should be attracted in that direction. Except during liquidity equilibrium, where Grim Reaper’s liquidation lines provide no trend signals, with price movement influenced by other factors.
Smart Level
The Smart Level tool is similar to CoinGlass's Liquidation Map, but it visualizes the number of liquidation lines, offering traders an additional perspective on liquidity attractiveness. It helps target price levels for order placement.
It's recommended to disable the default show liquidated levels when using this feature to allow Grim Reaper to display the maximum number of uncleared price levels.
Combine Smart Level with PowerRanger to Verify Magnets
PowerRanger's (Super Rangers) magnet blocks are classified as strong or weak. Use Smart Level to verify the strength of magnet blocks. The following chart setup includes:
- Fixed 30m/15m timeframe
- PowerRanger (Super Rangers) on the chart
- Grim Reaper on the chart
- Grim Reaper's
Enable Heatmapoption disabled andEnable SmartLevelenabled
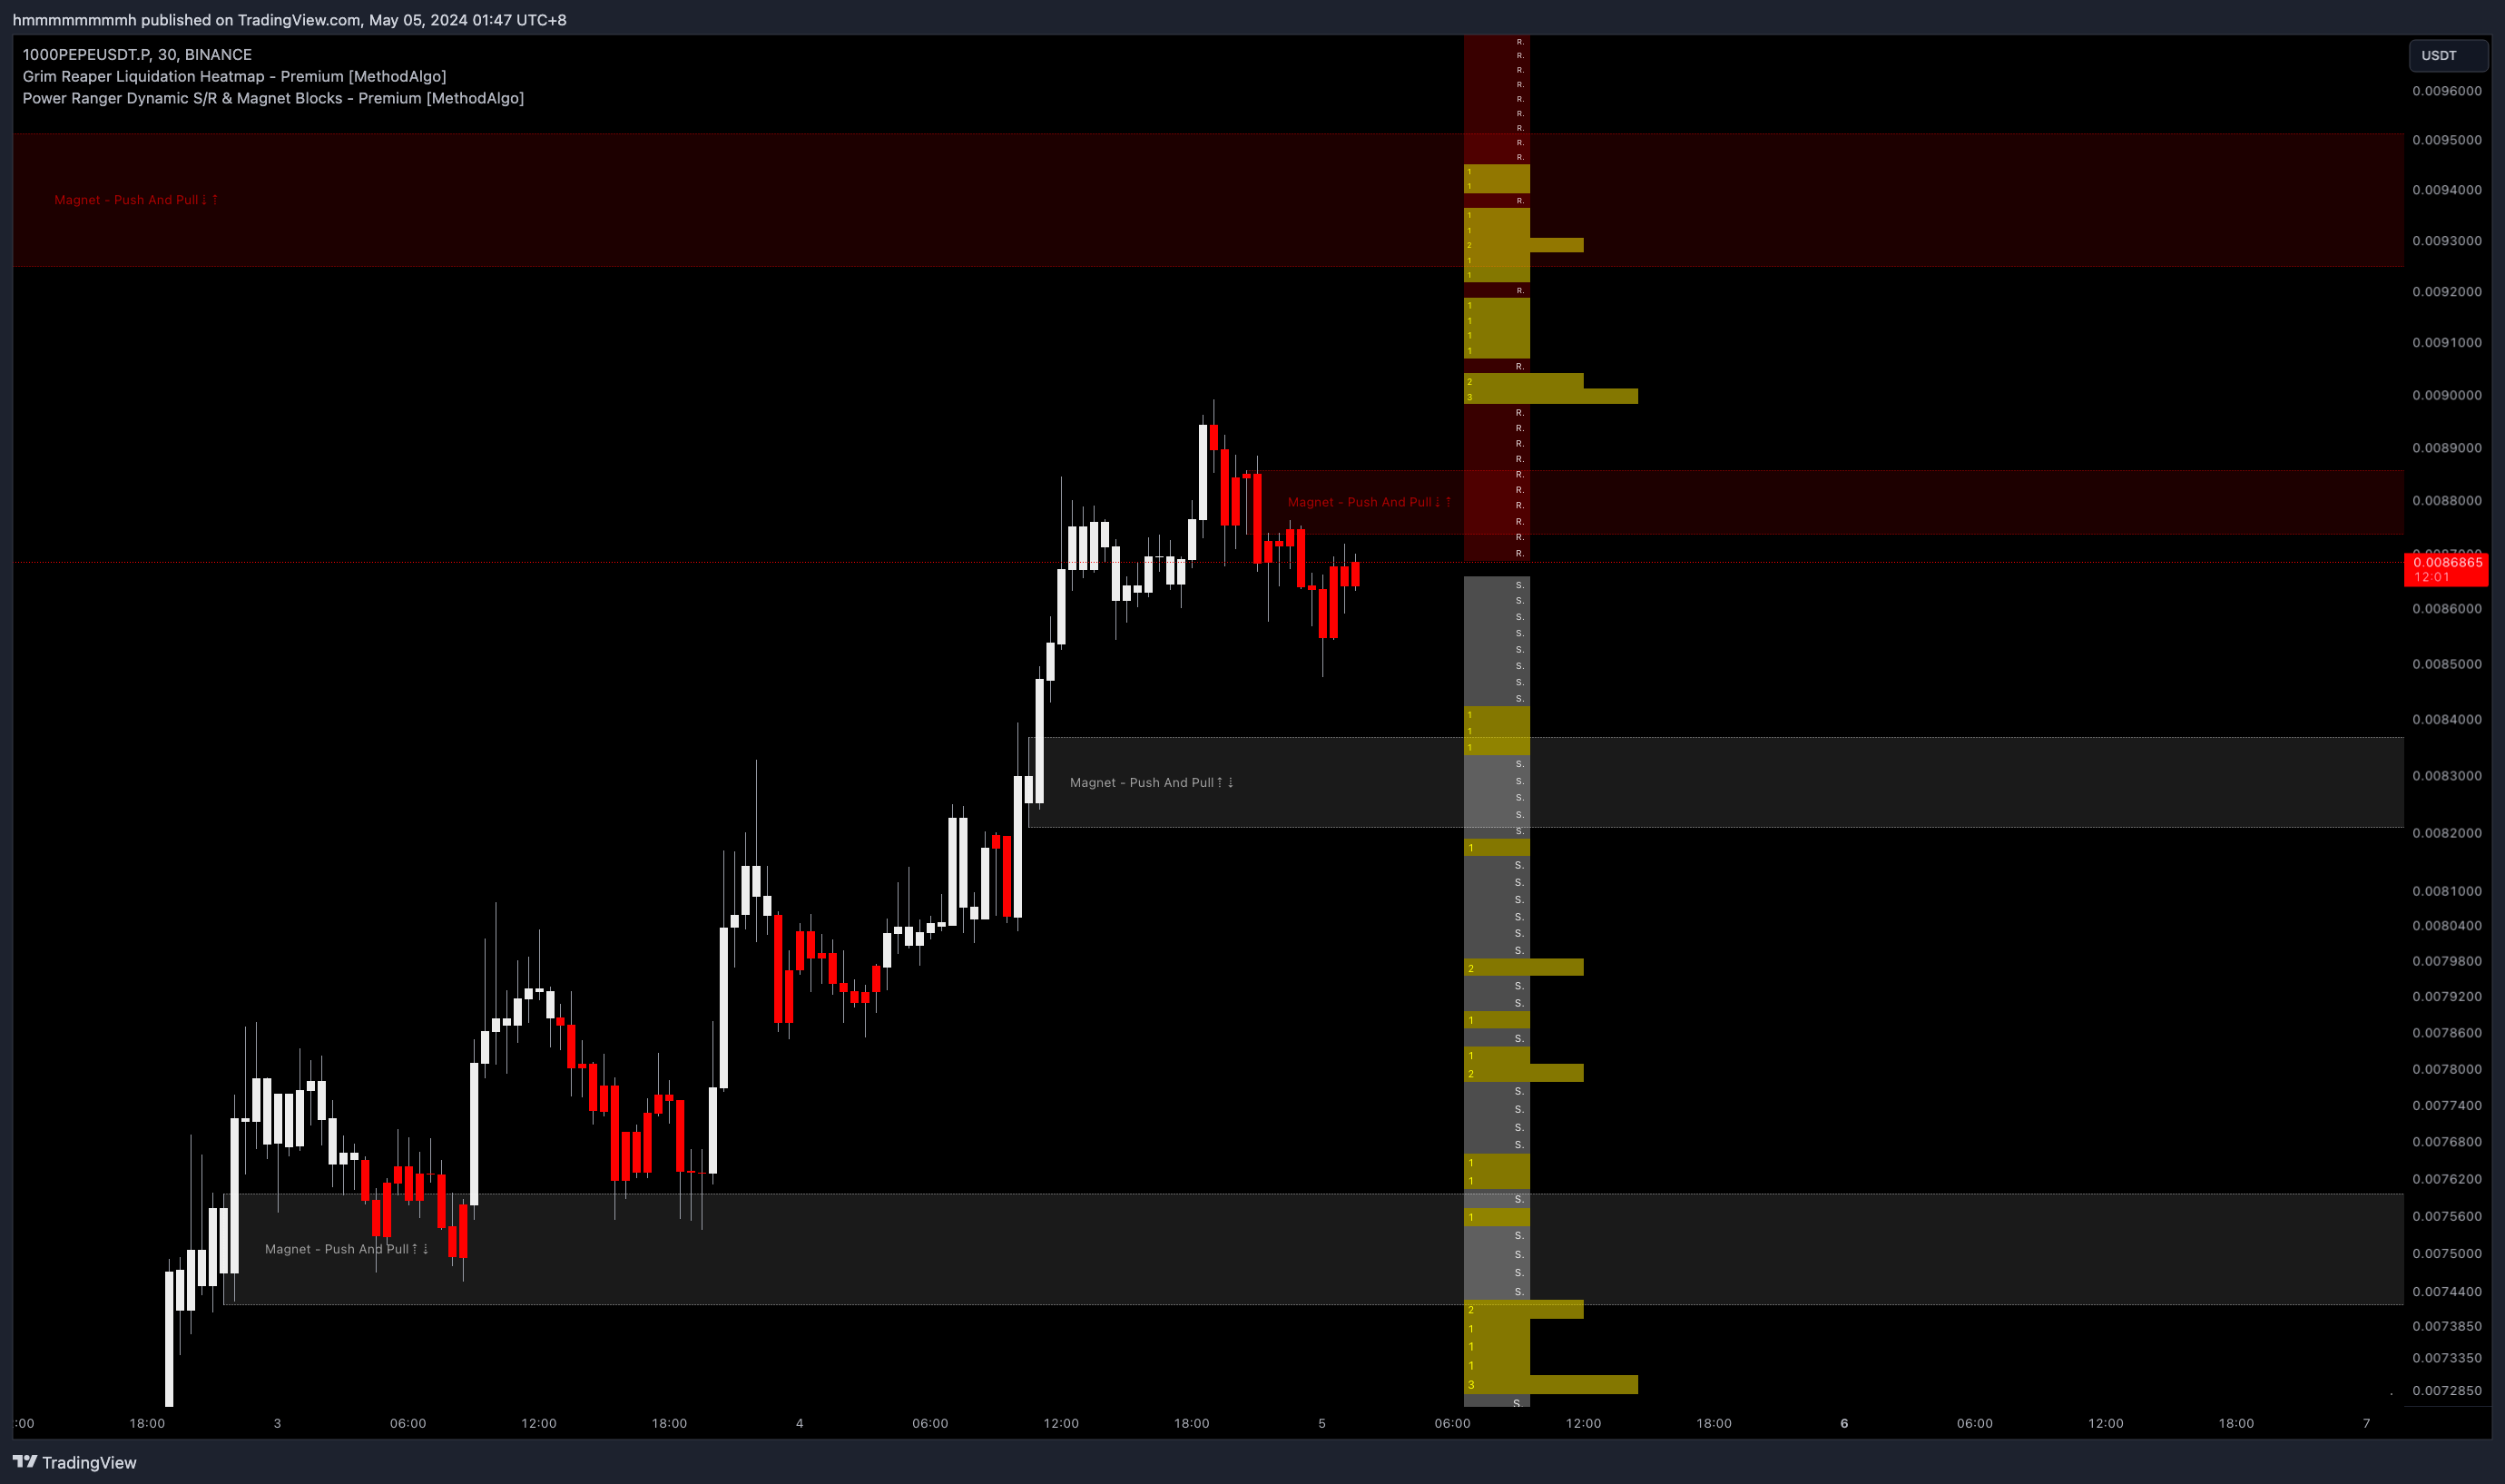 In the chart above, we can see that the magnets above and below the price are support and resistance (gaps without liquidation lines), causing the magnets to push (repel) the price.
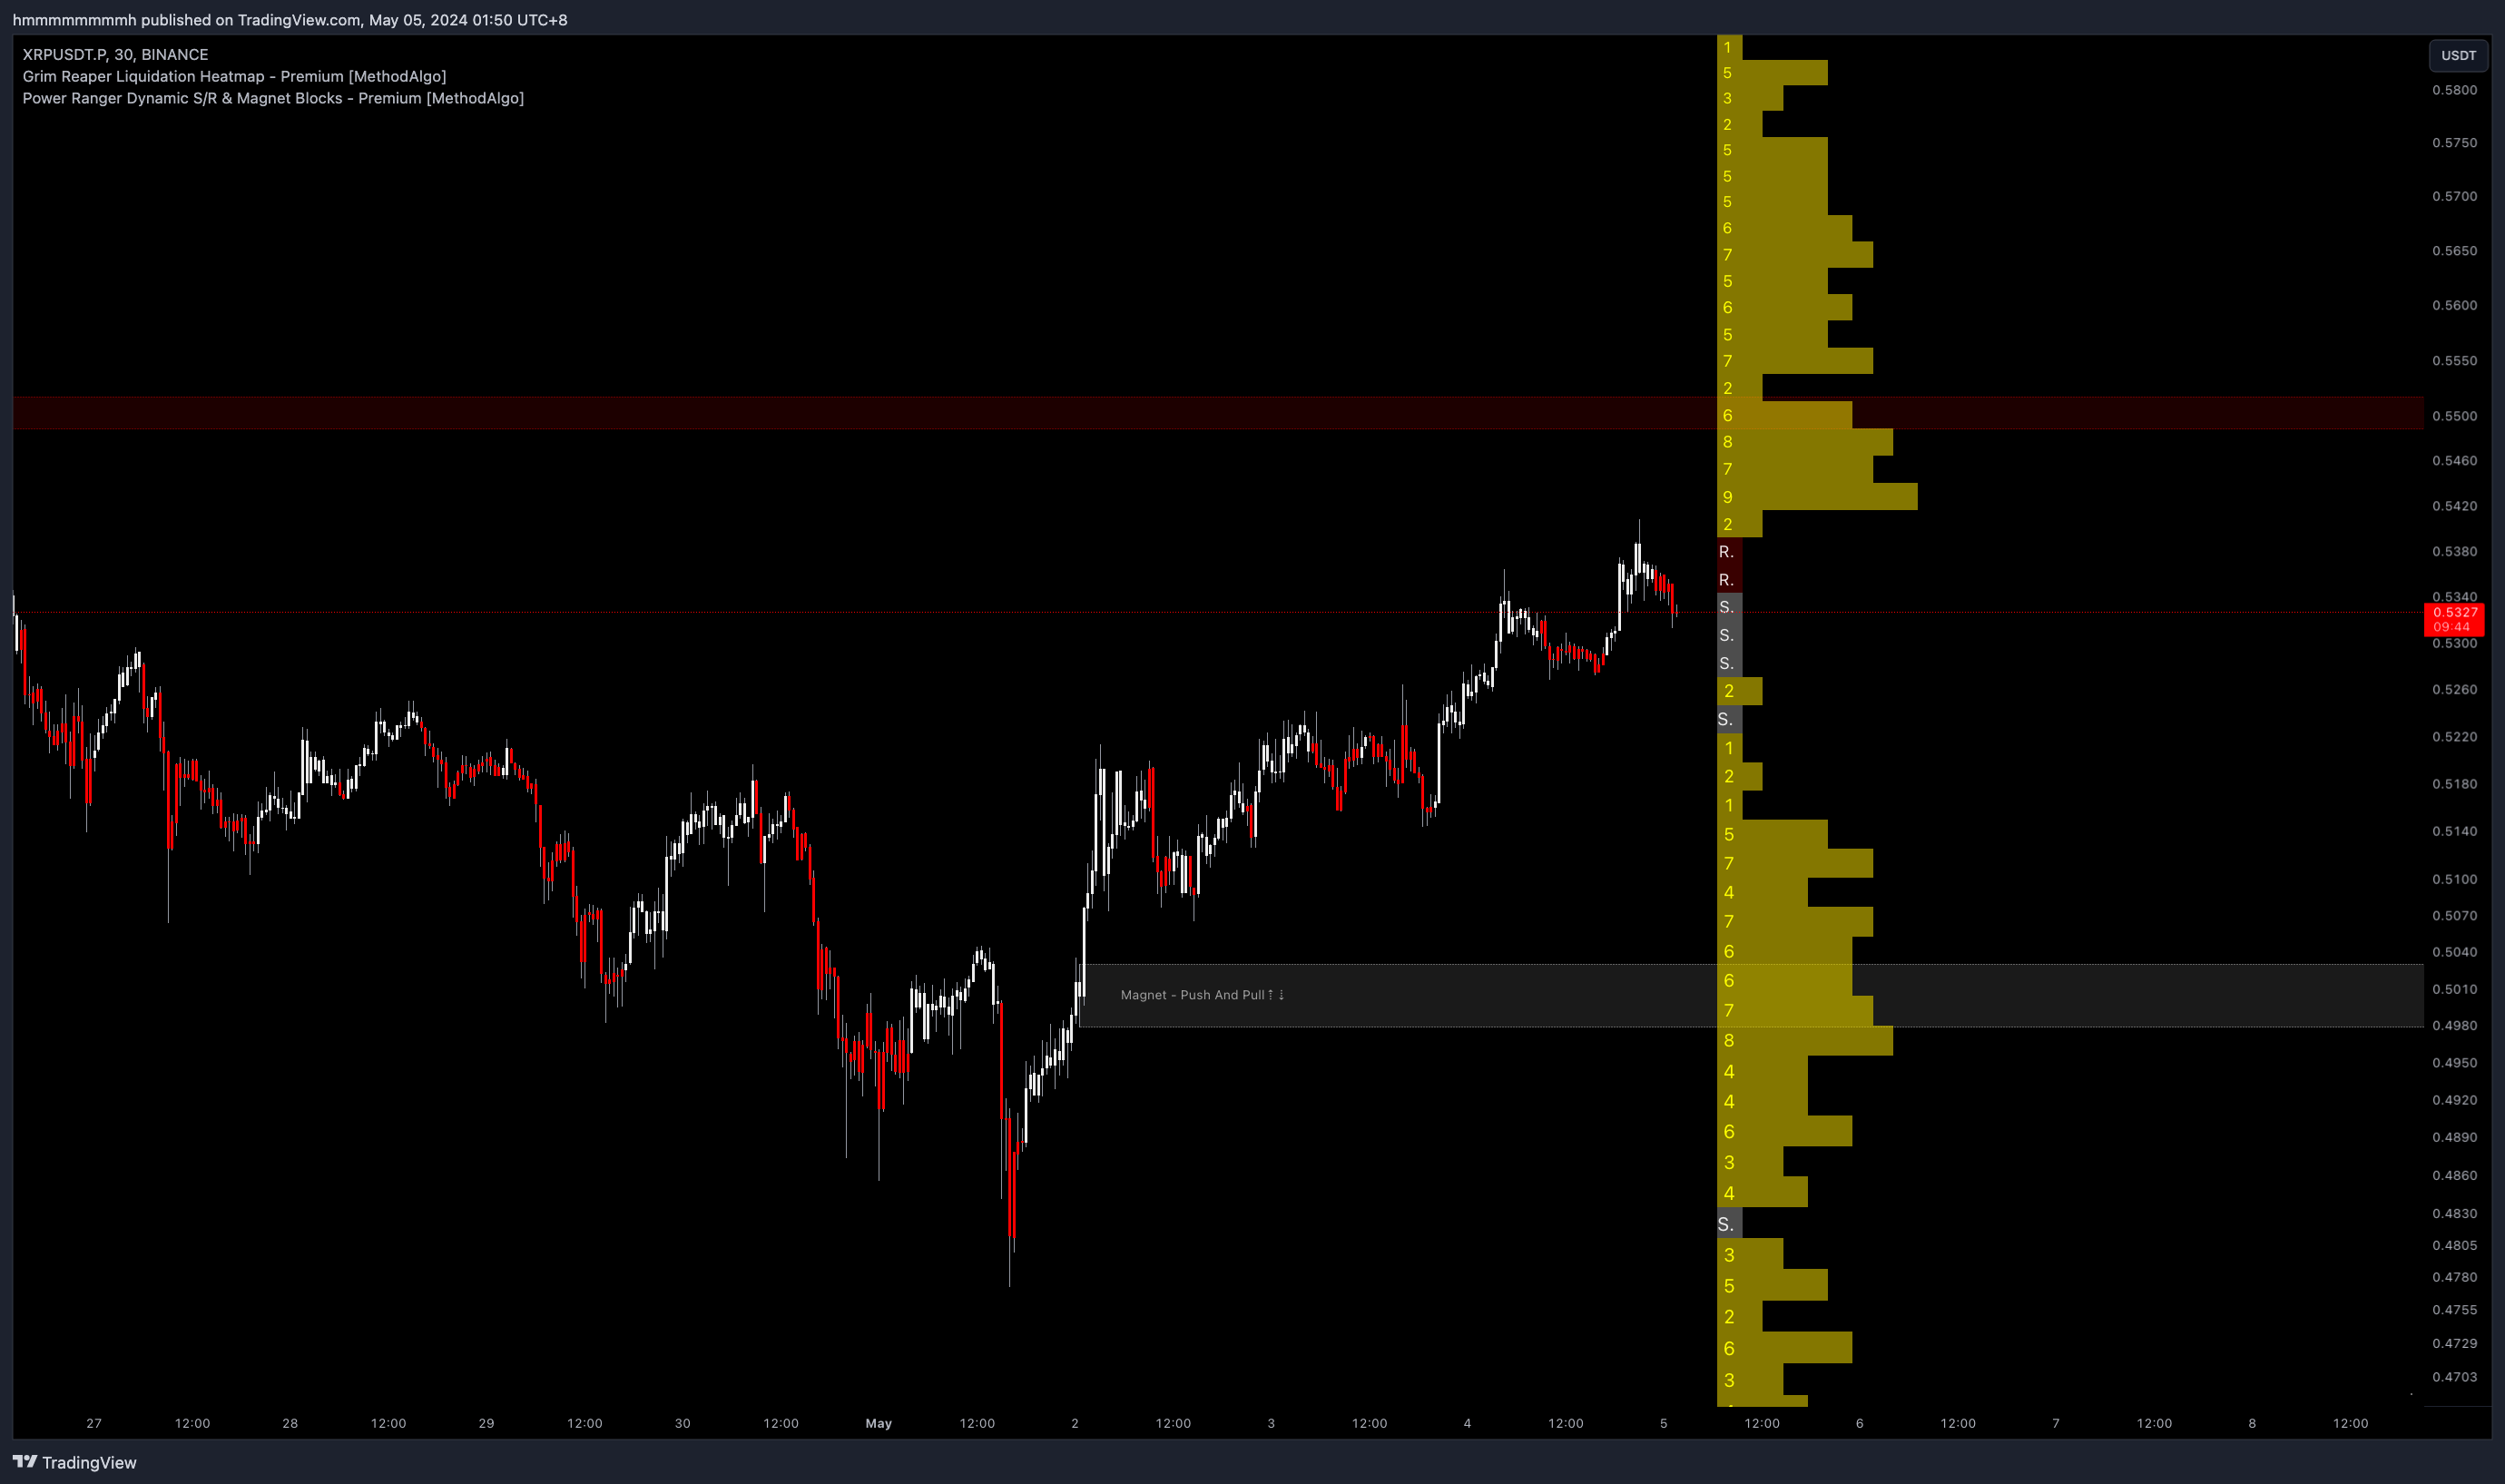
In the chart below, the magnets above and below the price have liquidation lines, indicating strong attraction (pull) by the magnets.
Next Steps
Now that you understand Grim Reaper's full concepts and functions, continue learning about its specific settings and parameters.
MethodAlgo's engineers take pride in their work, but you should recognize that no indicator/algorithm guarantees perfect win rates. Trading outcomes depend heavily on the trader's psychology, knowledge, experience, and risk design. Our algorithm interfaces are part of T.A.T.A. In actual trading, traders should consider multiple factors and signals from other tools to build their confidence system, following the analysis mode of T.A.T.A.
If this tutorial contains any unclear explanations or errors, please contact MethodAlgo's @Staff on the Discord trading terminal for corrections.