Concept and Layers
Concept
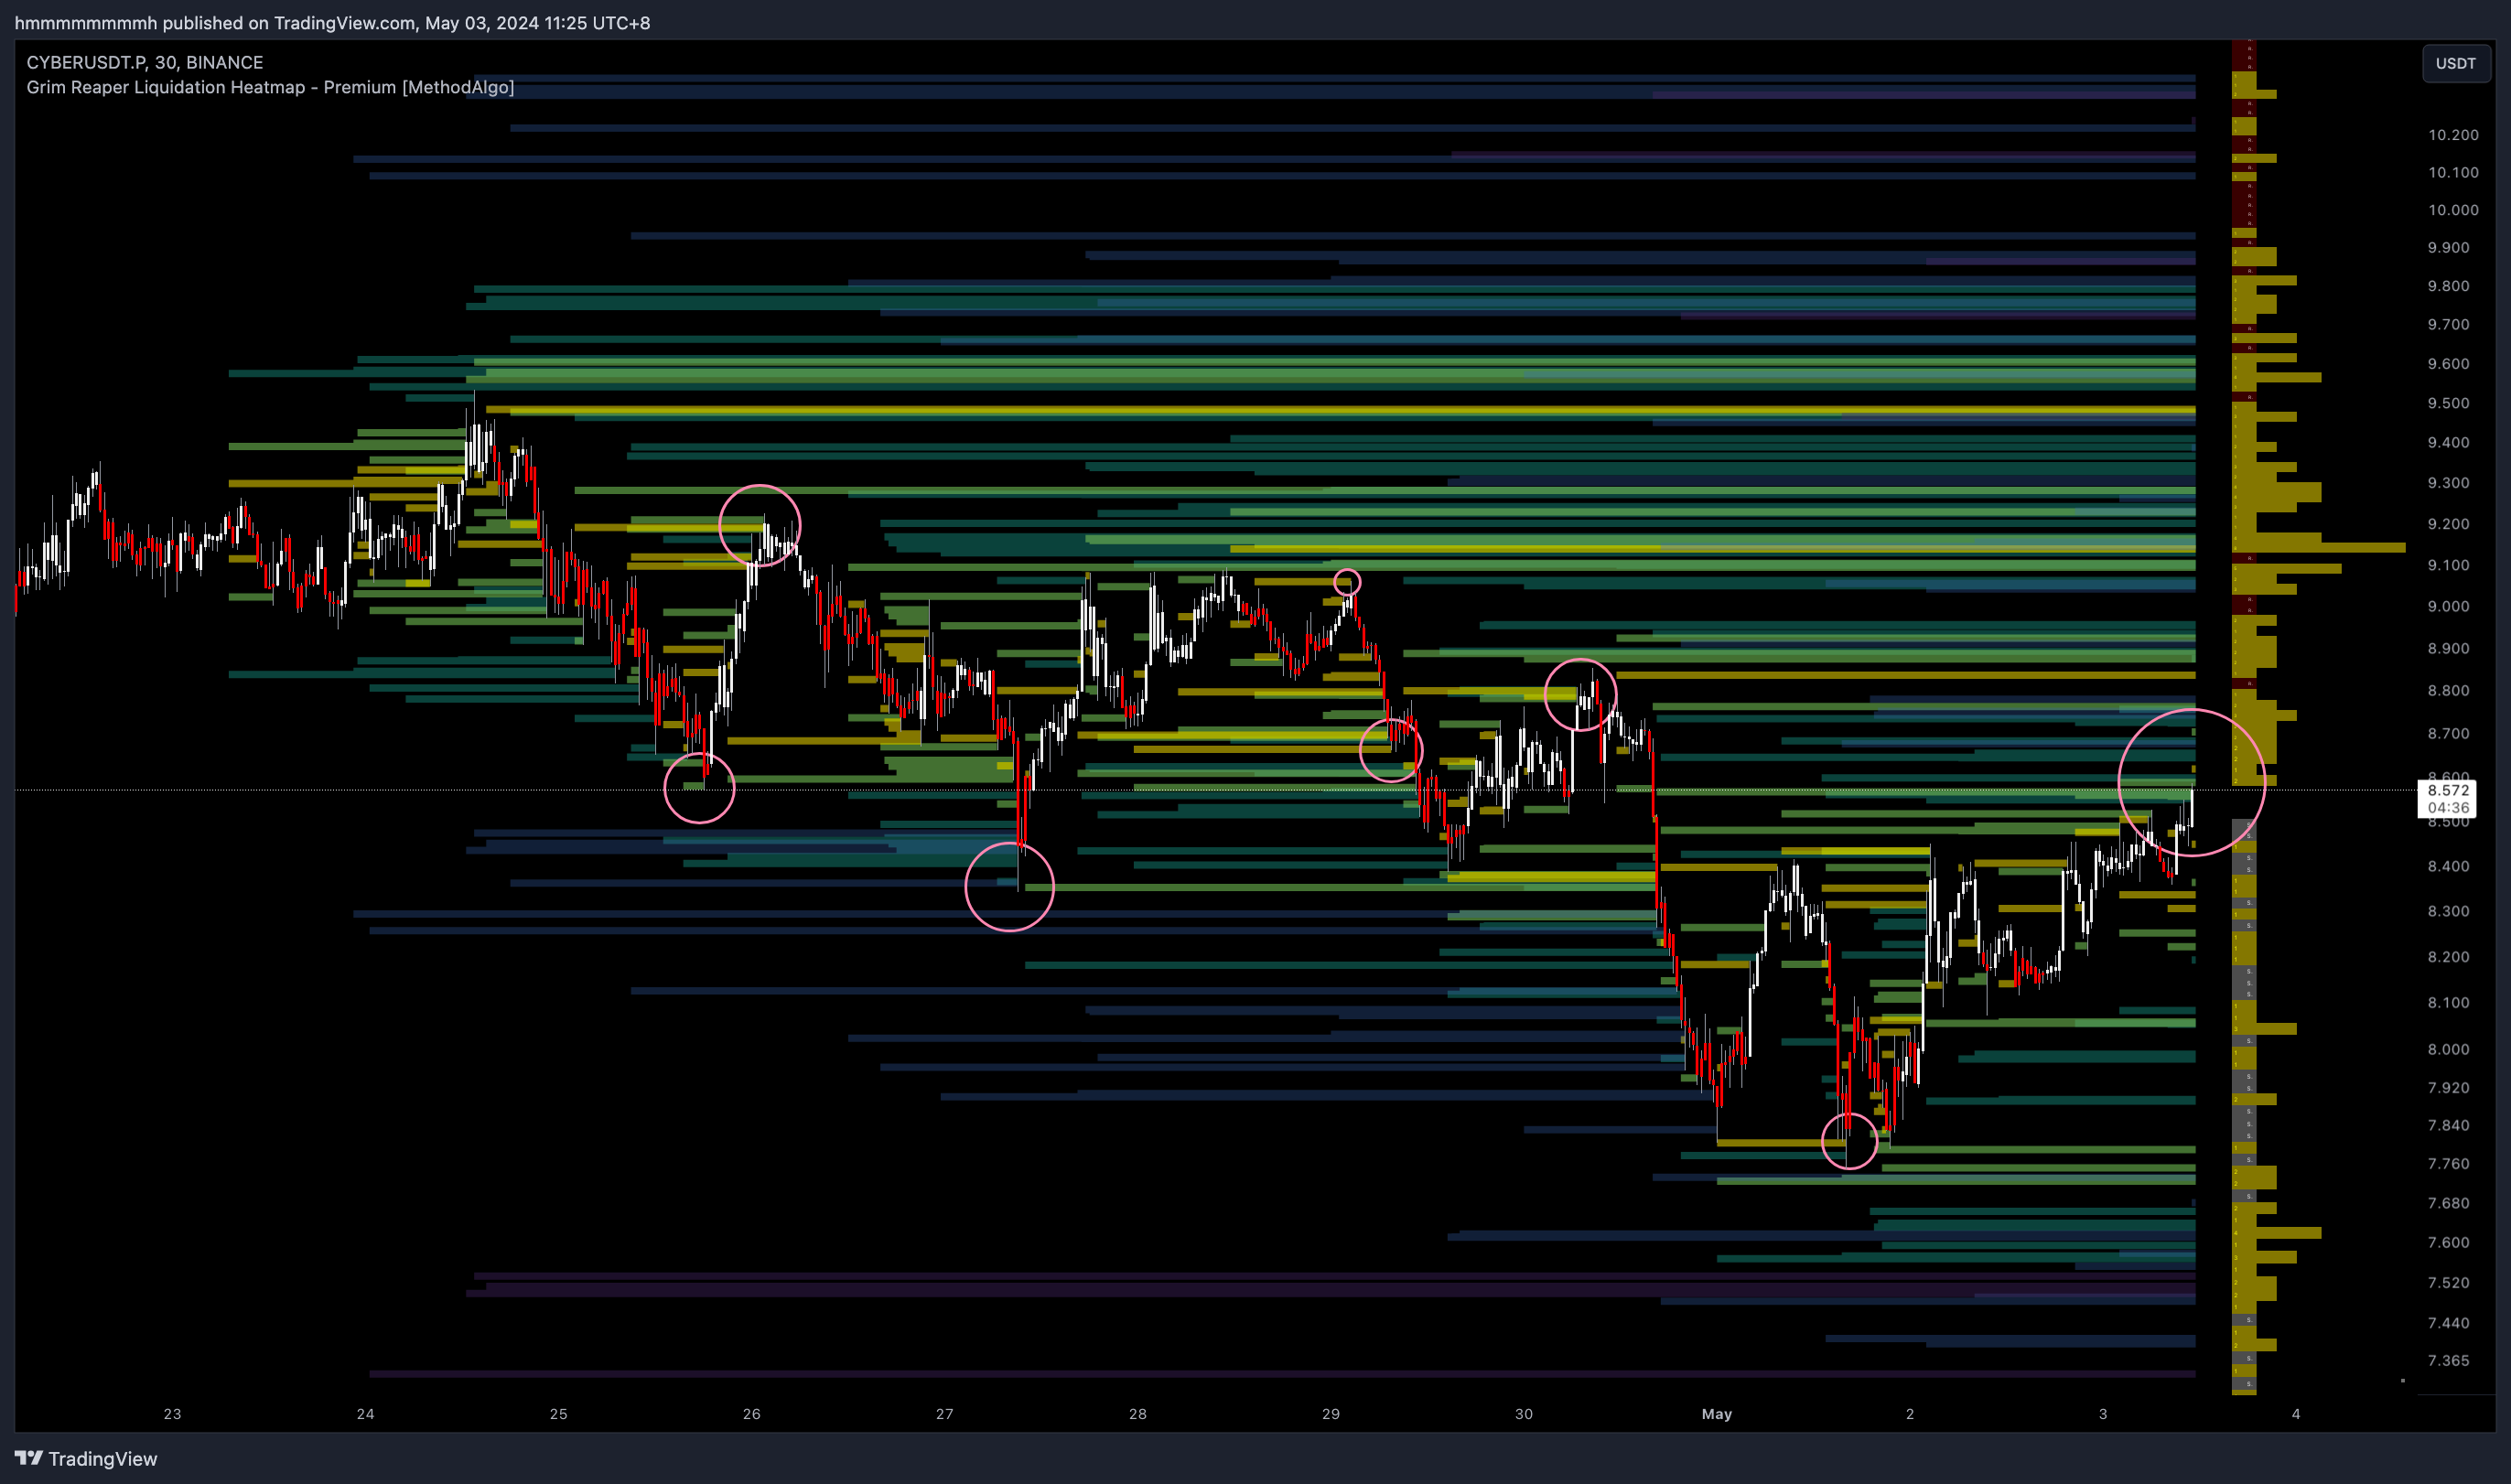
The advanced indicator Grim Reaper (Liquidation Heatmap) by MethodAlgo is designed to predict potential price levels where large-scale liquidations might occur. This algorithm uses exchange big data information (Open Interest, O.I) and calculates potential liquidation price levels at different leverage levels over time. It aims to help traders find optimal high-liquidity trading positions.
Grim Reaper estimates liquidation points based on five different leverage levels (5x, 10x, 25x, 50x, 100x), represented in different colors (from cool purple to hot yellow). Traders can identify high liquidity areas by observing the density and color of the lines.
What is Liquidation?
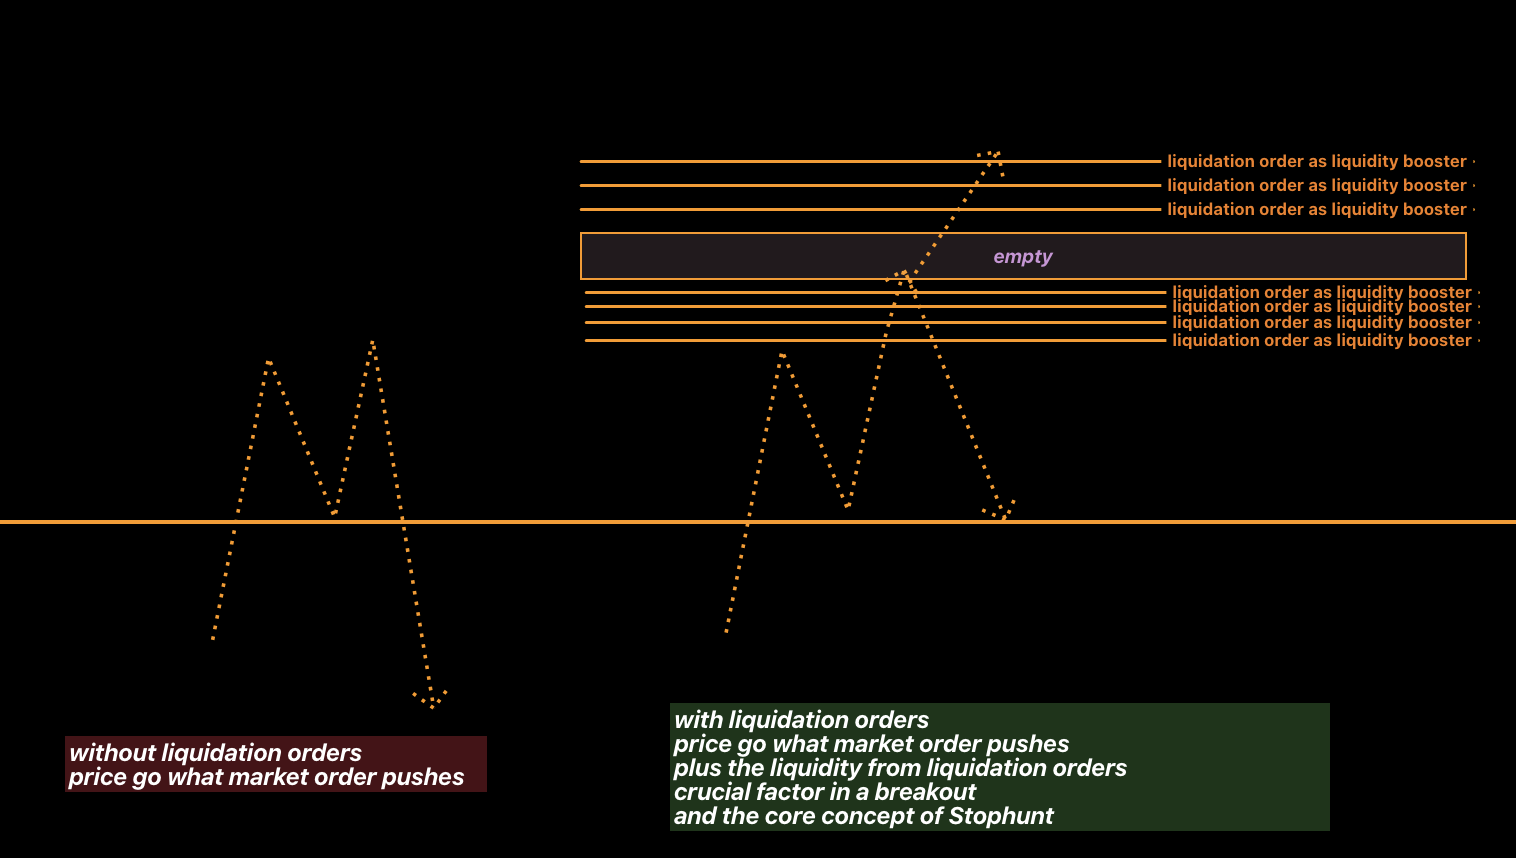
Liquidation, also known as forced liquidation or margin call, occurs when a trader's margin is insufficient to cover their open positions. To prevent further losses for the trader and the exchange, most exchanges set a liquidation level. In leveraged trading, positions will be liquidated at this level. Liquidation acts like a stop-loss order, where a long position's stop-loss is a market sell order, and a short position's stop-loss is a market buy order. Once triggered, these orders quickly fill the limit orders in the order book, causing market prices to move rapidly. Traders can use Grim Reaper to identify and profit from these price behaviors.
Dynamic Support and Resistance Analysis Against Market Manipulation
One of the core values provided by Grim Reaper is its visualized liquidity support/resistance, which is also a tool for dynamic support/resistance analysis.
Regular support/resistance analysis and concepts like Price Action / SMC's Order Block / Order Book are susceptible to manipulation by market makers or whales during low-volume periods. This can lead traders to mistakenly believe that support and resistance levels are static and unchanging.
In reality:
- Support and resistance levels adjust themselves with changes in time and liquidity; a resistance level present a few hours ago may no longer exist later.
- New buyers might enter the market at any moment, and existing liquidity can exit at any time.
- Large orders by whales manipulating the market in the order book can be withdrawn at any time, invalidating analyses and trapping retail traders.
In this context, the signals provided by Grim Reaper's liquidation level algorithm are more reliable, as it is costly for whales or market makers to manipulate such data levels. Analyzing the Grim Reaper indicator can help traders identify invalidated support/resistance and hidden support/resistance, offering invaluable insights.
Confluence
- Reference stop-loss levels
- Set TP target from counterpart liquidation levels
- Quickly execute large entry orders at favorable prices
- Analyze dynamic support/resistance
- Analyze liquidity trends
- liquidity gap strategy
Supported Trading Pairs
Currently, Grim Reaper supports all futures trading pairs on Binance and OKX. For spot trading pairs, the corresponding futures trading pair's liquidation prediction layer will be displayed (since only futures has O.I data). Due to some exchanges not providing O.I data, Grim Reaper features an intelligent auto-matching mode based on the following conditions:
- Binance/OKX Futures pairs: Fully supported
- Binance/OKX Spot pairs: Automatically match and display the corresponding futures trading pair's liquidation layer
- Other exchange Futures pairs: If the exchange provides O.I data, it will automatically match and display; if not, it won't display. However, users can enable an option in Grim Reaper's settings to display same pairs liquidation levels from Binance datasource.
Supported Time Frames
Based on continuous testing since 2023, the best-performing time frames for Grim Reaper predictions are:
- 15m (sufficient)
- 30m (optimal, best performance)
- 1h and 4h (recommended only for pairs with substantial historical data like BTC; performance not as good as 30m)
Hourly and daily data are not friendly to new coins, as the Grim Reaper algorithm requires sufficient historical data to establish a baseline for comparing O.I fluctuations. Therefore, using time frames other than 15m/30m will display a warning in the bottom right corner, which can be turned off in the indicator settings.
Interface
-
Liquidation Lines: Five different leverage levels (5x, 10x, 25x, 50x, 100x) are visualized using horizontal lines, with colors ranging from cool (purple) to hot (yellow). The colors can be customized, and the default liquidation line colors for the indicator are:
100x 50x 25x 10x 5x Yellow Light Green Dark Green Blue Purple -
Smart Levels: Disabled by default, can be enabled in the indicator settings. Smart Levels work similarly to volume profile but calculate liquidation lines instead. They provide visual aid for traders to set orders on chart, and work the same if not better like the coinglass liquidation map.
- Price levels with No liquidation lines above market price are marked
R(resistance). - Price levels with No liquidation lines below market price are marked
S(support). - Price levels with liquidation lines show the number of overlapping liquidation lines and display a yellow bar on the right side based on the number of lines. The more lines, the longer the bar, visualizing the density of liquidation lines.
- Price levels with No liquidation lines above market price are marked
Signals and Patterns
- Prices tend to move towards areas with brighter (hot) colors and dense liquidation lines.
- During continuous liquidation in one direction, prices often stop at a gap (area without lines) between liquidation zones, starting to consolidate or reverse.
- After clearing a major liquidation zone, prices often reverse using opposite liquidation lines from positions accumulated during the journey.
- When there are few or no liquidation lines on one side, prices may consolidate to attract traders to bet or directly start reverse liquidation.
- The heatmap predicts where large-scale liquidation will start, not where it will end. Be cautious when using gap reversal trading and confirm with other tools.
- Scattered purple liquidation lines generally do not attract prices significantly during normal times but may be targeted during the LiquidityDetective's Apex mode.
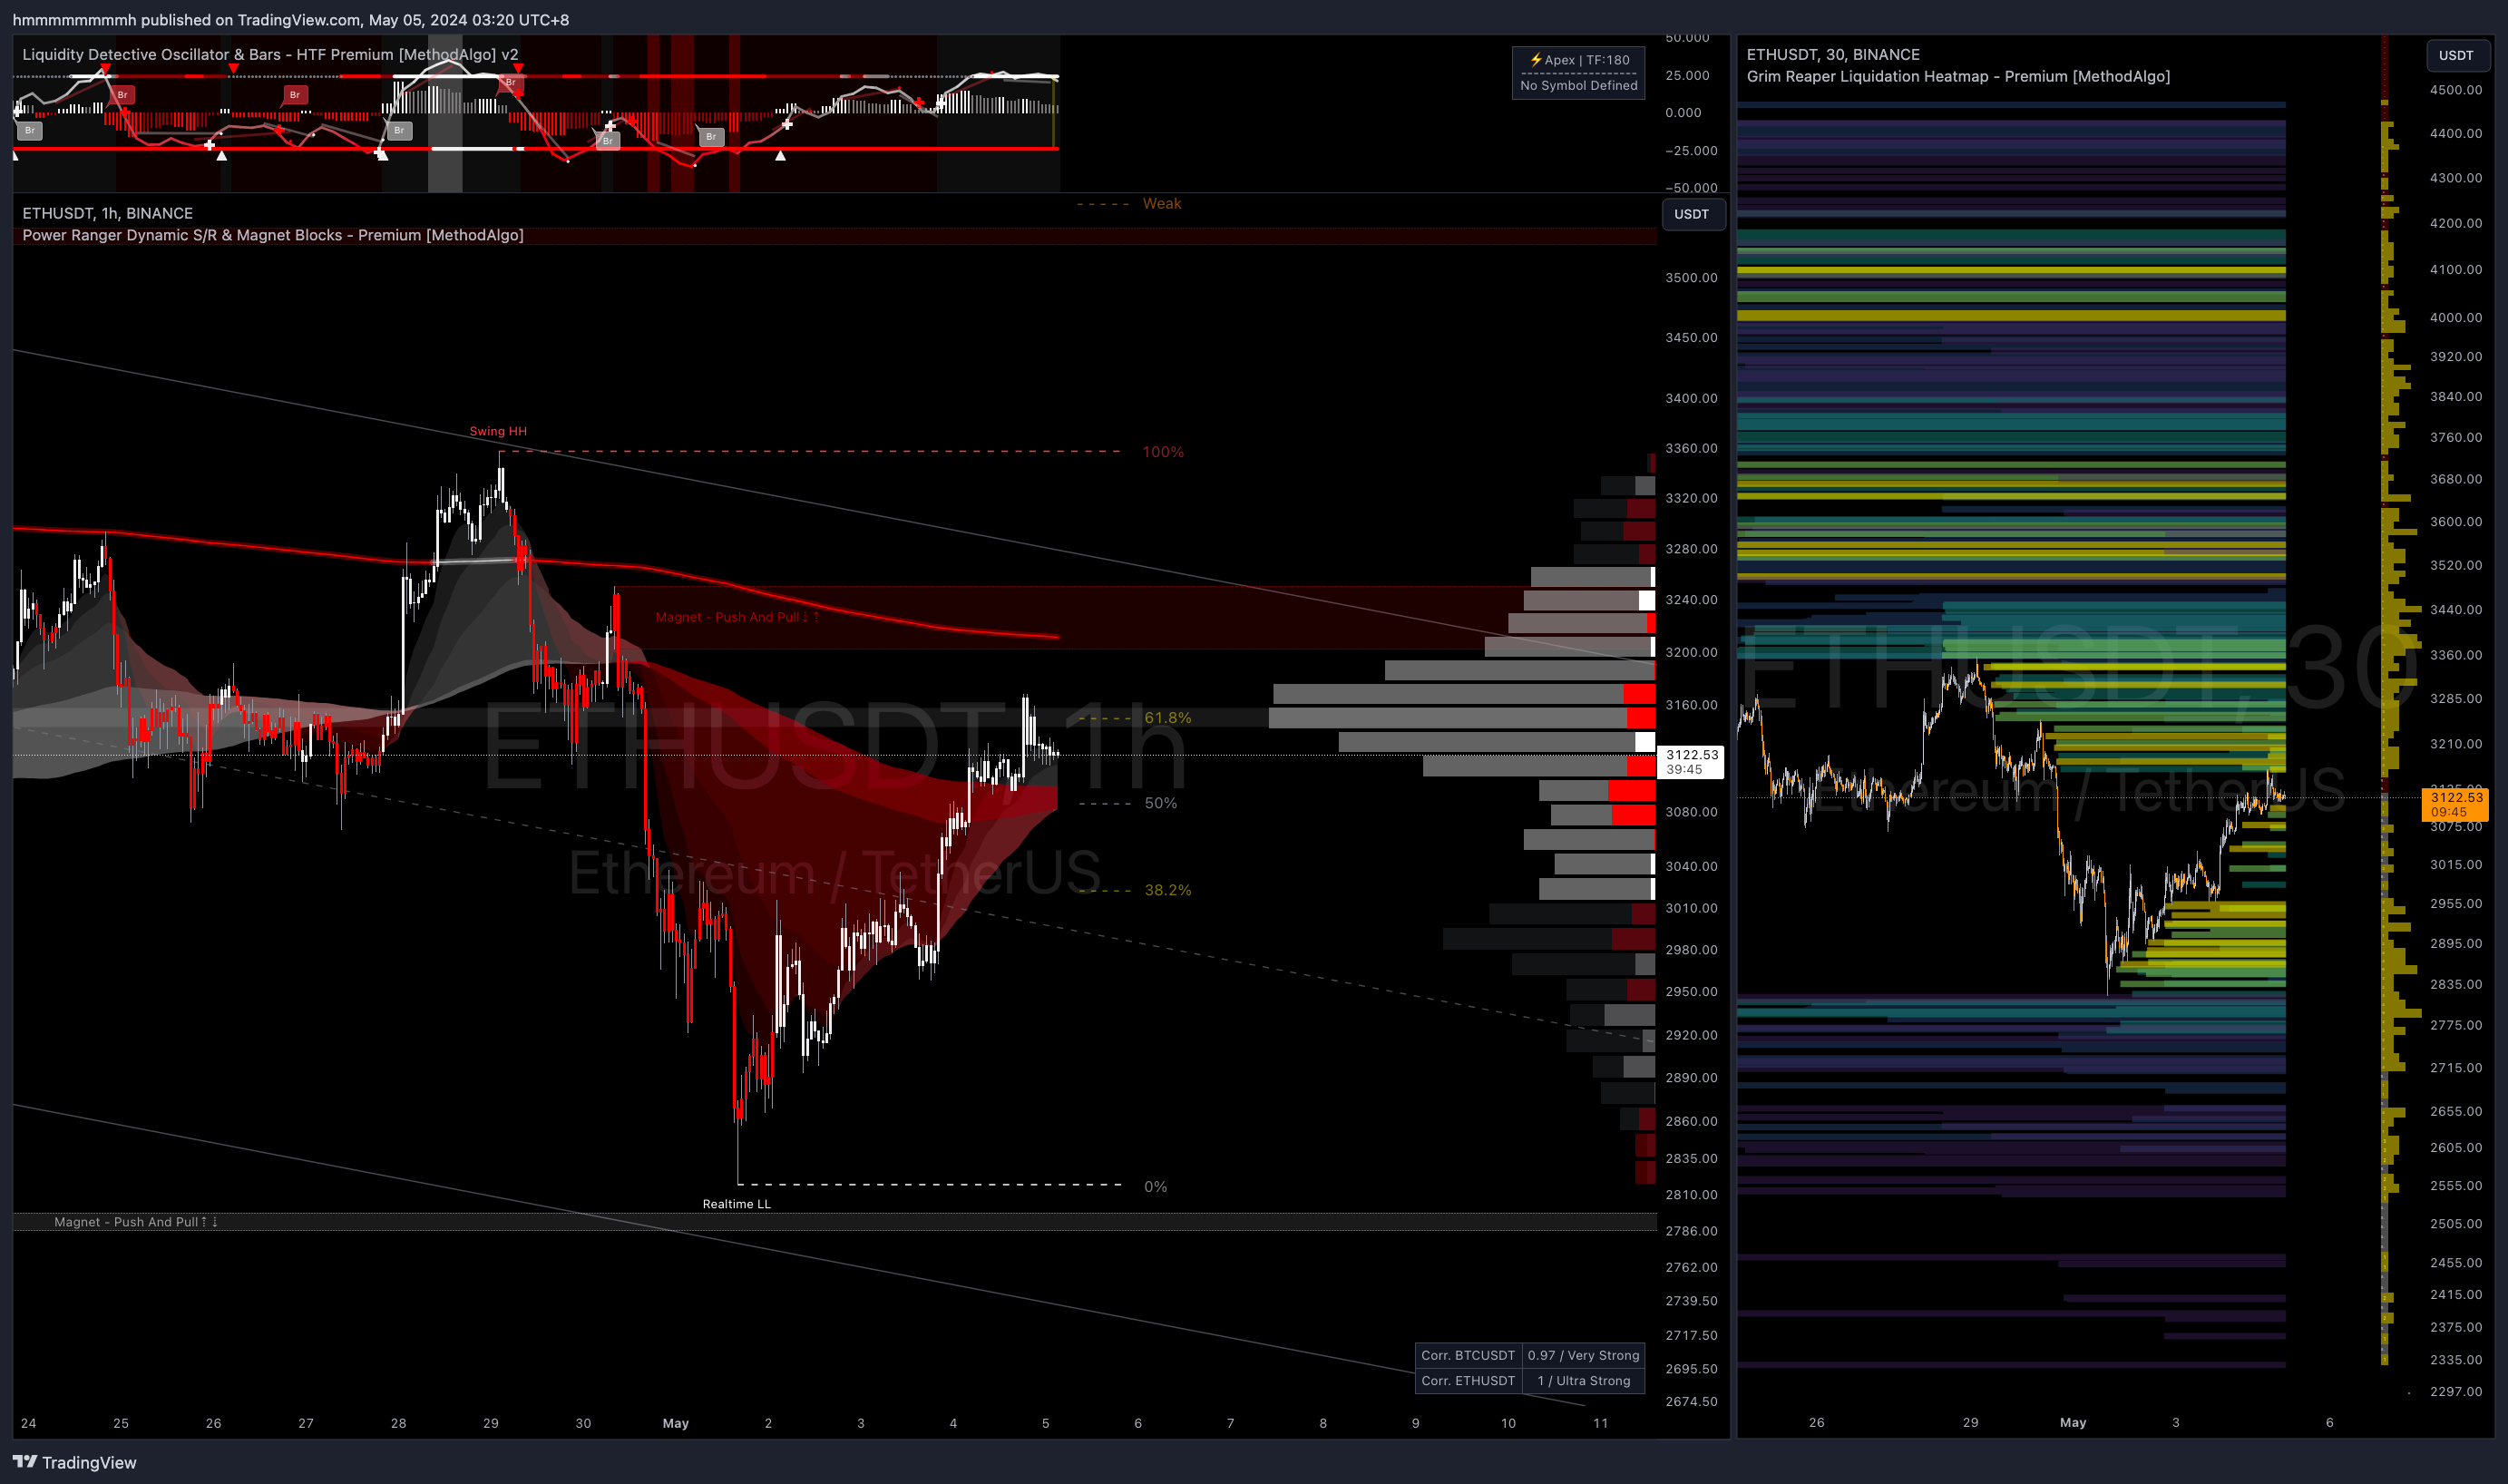
It is recommended to set the Grim Reaper liquidation chart to a single time frame instead of constantly switching between different time frames, making it easier to grasp the patterns quickly. The best chart setup for using Grim Reaper is to purchase TradingView's subscription for split-screen functionality. Fix Grim Reaper as a sub-chart at a 30m time frame and synchronize it with the main chart's symbol, keeping the main chart clean for analysis.
Notes
- Grim Reaper calculates liquidation positions from the latest fluctuations until it exhausts TradingView's limit of 500 visible lines. Therefore, Grim Reaper's liquidation positions differ from Coinglass's fixed time range calculations, but a comparison will show Grim Reaper's data is superior.
- As with all indicators, the liquidation line signal from the last candle is only confirmed after candle closes.
- You can TURN OFF the default
show liquidated levelsin the Grim Reaper settings to hide already liquidated lines, utilizing the 500-line limit for plotting unliquidated lines. default is ON because its easy for new trader to validate patterns and backtesting on first use.
Next Steps
Now that you understand the main information about Grim Reaper, continue reviewing the following documents to learn about specific use cases and parameter settings:
Found any unclear instructions or errors in this tutorial?
Please contact MethodAlgo's @Staff on the Discord Trading Terminal for corrections.